Memory
disk space
[root@ZT-TEST ~]# df -h
 file system                 Capacity used available used% Mount point
devtmpfs                 3.9G     0  3.9G    0% /dev
tmpfs                    3.9G     0  3.9G    0% /dev/shm
tmpfs                    3.9G  402M  3.6G   11% /run
tmpfs                    3.9G     0  3.9G    0% /sys/fs/cgroup
/dev/mapper/centos-root   95G   10G   86G   11% /
/dev/sda1               1014M  207M  808M   21% /boot
tmpfs                    799M   16K  799M    1% /run/user/42
tmpfs                    799M     0  799M    0% /run/user/0
Running memory
[root@ZT-TEST ~]# free -g
              total        used        free      shared  buff/cache   available
Mem:              7           0           2           0           4           6
Swap:             3           0           3
[root@ZT-TEST ~]# free -m
              total        used        free      shared  buff/cache   available
Mem:           7982         880        2851         408        4250        6394
Swap:          4095           3        4092
[root@ZT-TEST ~]# free -k
              total        used        free      shared  buff/cache   available
Mem:        8174056      902304     2919436      417952     4352316     6547824
Swap:       4194300        3368     4190932
Virtual memory (swap)
[root@ZT-TEST ~]# vmstat 1 10
procs -----------memory---------- ---swap-- -----io---- -system-- ------cpu-----
 r  b   swpd   free   buff  cache   si   so    bi    bo   in   cs us sy id wa st
 2  0   3368 2919400   4204 4348128    0    0     0     1    0    0  0  0 100  0  0
 0  0   3368 2919252   4204 4348128    0    0     0     0  173  240  1  0 99  0  0
 0  0   3368 2919220   4204 4348128    0    0     0     0  139  219  1  0 99  0  0
 0  0   3368 2919220   4204 4348128    0    0     0     0  121  208  1  0 99  0  0
Memory swap settings:
- To view the swappiness scale:
[root@ZT-TEST ~]# cat /proc/sys/vm/swappiness
30
- Temporarily modify the swing scale:
sudo sysctl vm.swappiness=10
- Permanently modify the swing scale:
vim /etc/sysctl.conf
- Close swap: swapoff -a
- Open swap: Swap on - A
Bottleneck analysis
Command: vmstat
[root@ZT-TEST ~]# vmstat 1 10
procs -----------memory---------- ---swap-- -----io---- -system-- ------cpu-----
 r  b   swpd   free   buff  cache   si   so    bi    bo   in   cs us sy id wa st
 2  0   3368 2919400   4204 4348128    0    0     0     1    0    0  0  0 100  0  0
 0  0   3368 2919252   4204 4348128    0    0     0     0  173  240  1  0 99  0  0
 0  0   3368 2919220   4204 4348128    0    0     0     0  139  219  1  0 99  0  0
The IO indicators are explained as follows:
- bi: the speed at which the disk is read, in KB / sec
- bo: write speed to disk
- wa: time of IO
Bottleneck analysis:
- wa does not reflect the bottleneck of the disk, but actually reflects the IO waiting time of the CPU
- The bi+bo reference value is 1000. If it exceeds 1000 and the wa value is relatively large, it indicates that there is a bottleneck in the system disk IO
Command: iostat
[root@ZT-TEST ~]# iostat -x -k -d 1
Linux 3.10.0-957.el7.x86_64 (ZT-TEST)   2021 October 3  _x86_64_        (4 CPU)

Device:         rrqm/s   wrqm/s     r/s     w/s    rkB/s    wkB/s avgrq-sz avgqu-sz   await r_await w_await  svctm  %util
sda               0.00     0.02    0.00    0.23     0.11     2.22    20.25     0.01   58.40    5.38   59.03  13.86   0.32
dm-0              0.00     0.00    0.00    0.24     0.11     2.21    18.71     0.01   57.77    5.58   58.32  13.01   0.32
dm-1              0.00     0.00    0.00    0.00     0.00     0.00    11.00     0.00    3.65    5.39    2.36   0.65   0.00

###
rrqm/s: The number of times read requests to the device are merged per second, and the file system reads the same block (block) Merge requests
wrqm/s: The number of times write requests to the device are merged per second
r/s: Number of reads completed per second
w/s: Number of writes completed per second
rkB/s: Data read per second (kB Unit)
wkB/s: Amount of data written per second (kB Unit)
avgrq-sz:Average time IO Amount of data operated (In sectors)
avgqu-sz: Is the average length of the request queue. The shorter the queue length, the better
await: Average time IO Request wait time (Including waiting time and processing time, in milliseconds). General system IO The response time should be less than 5 ms
svctm: Average time IO Processing time of the request (In milliseconds)
%util: 1 What percentage of a second is spent I/O Operation. This parameter indicates how busy the device is
Bottleneck analysis:
- The CPU will spend some time waiting for IO (iowait). If the disk utilization is full (util%), even if the CPU utilization is not high, the overall QPS of the system cannot go up. If the traffic continues to increase, the single iowait will continue to increase (IO requests are blocked in the queue), resulting in the collapse of the overall performance
- High iowait does not represent a disk bottleneck. The only way to explain that the disk is the system bottleneck is the high svctm (processing time of IO requests). Generally speaking, more than 20ms represents abnormal disk performance. As long as it is greater than 20ms, you must consider whether the disk is read and written too many times, resulting in reduced disk performance
- Svctm is generally smaller than await. The size of svctm is related to disk performance. Too many requests will also lead to the increase of svctm. The size of await generally depends on svctm and the length of the I/O queue. If svctm is close to await, there is almost no waiting time for I/O; If await is much larger than svctm, it means that the I/O queue is too long and the response time of the application becomes slow. If the response time exceeds the allowable range of the user, consider replacing a faster disk; Adjust the kernel elevator algorithm; Optimize application; Upgrade CPU
Browser level
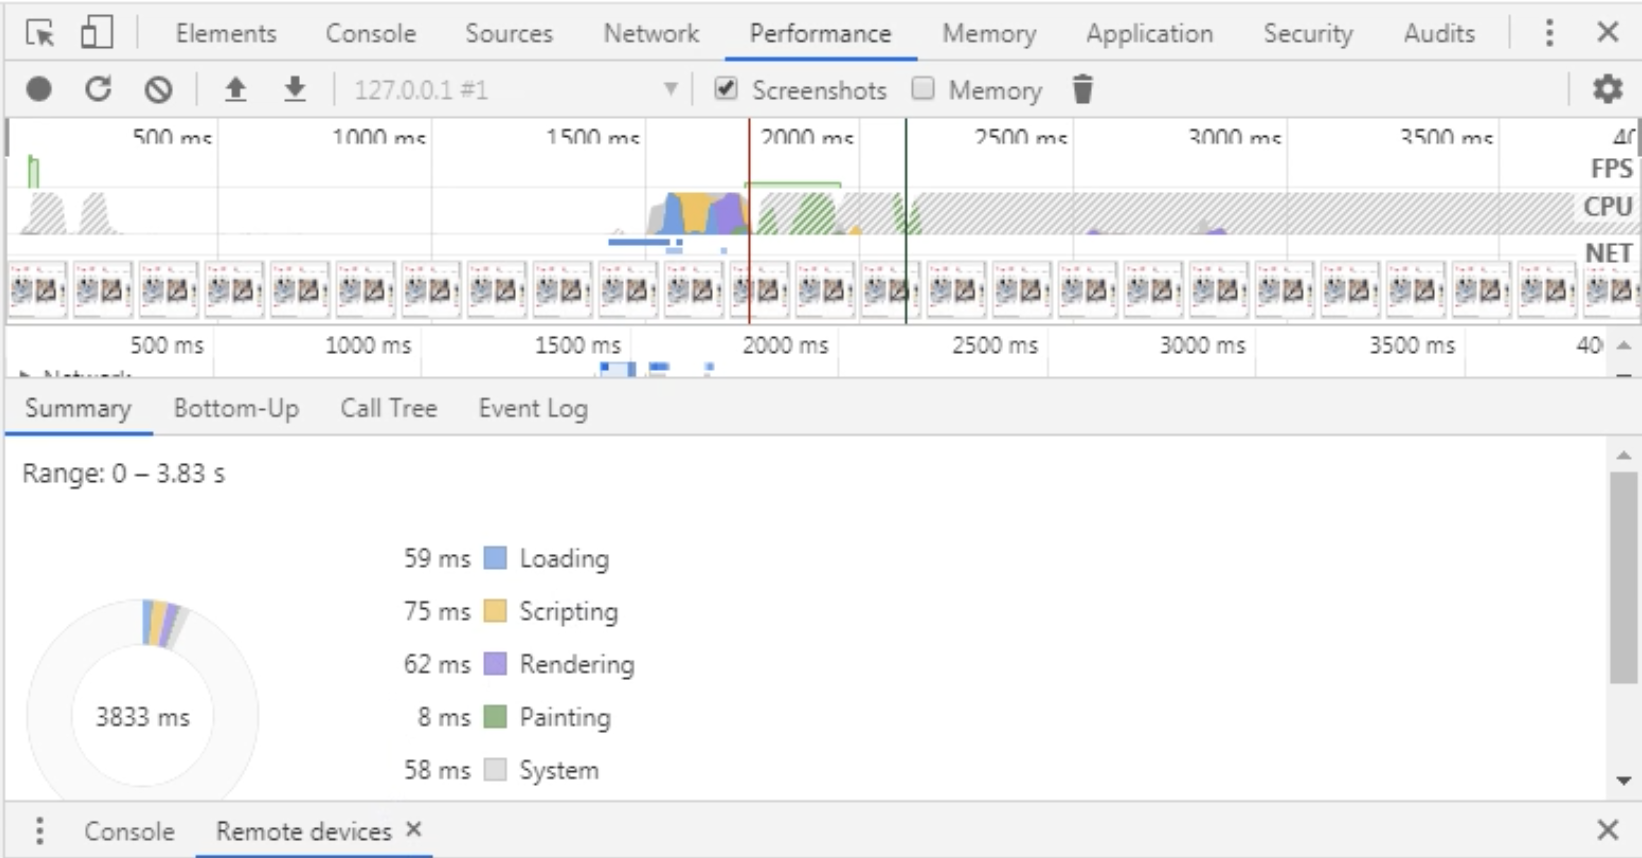
Focus on white screen time / first screen time

Interface level
- Concurrent testing
- Load test
- SQL layer

Server level
