brief introduction
Many individual webmasters use nginx as a server when they set up their websites. In order to know how the websites are visited, there are usually two ways:
- Insert js into the front-end page using methods such as CNZZ, trigger js when the user accesses, and record access requests.
- Analyze nginx's access log to extract useful information from the log.
Both approaches have advantages and disadvantages:
- CNZZ is relatively simple to use and various indicators are clearly defined.This way, however, only page access requests can be recorded, requests like ajax cannot be recorded, and crawler information cannot be recorded.
- The access log records all requests, which can be said to be very detailed, but requires the webmaster to have a detailed understanding and manual ability to access the log.
The two methods complement each other in order to have a better understanding of the status of the website.
The new SQL analysis function of log service greatly reduces the threshold for webmasters to analyze access log. This article will introduce how to use log service to analyze various indicators in access log.
Nginx Access Log Format
A typical nginx access log configuration:
      log_format  main  '$remote_addr - $remote_user [$time_local] "$request" $http_host '
                        '$status $request_length $body_bytes_sent "$http_referer" '
                        '"$http_user_agent"  $request_time';

      access_log  access.log  main;
Field Explanation:
- remote_addr: Client address
- remote_user: Client username
- time_local: Server time
- request: request content, including method name, address, and http protocol
- http_host: User request is the http address used
- Status: returned http status code
- request_length: Request size
- body_bytes_sent: Return size
- http_referer: Source page
- http_user_agent: Client name
- request_time: Overall request delay
Collect access logs to log services
-
First collect the logs to the log service
Refer to the documentation 5 Minute Quick Document
-
After collecting the logs to the log service, set the type of each column:

Note: request splits City method and uri columns
Log sample:


Analytical Access Log
Typically, access log s require viewing a website's pv, uv, hotspot pages, hotspot methods, error requests, client types, source pages, and so on.The calculation methods for each index are described in detail below.
-
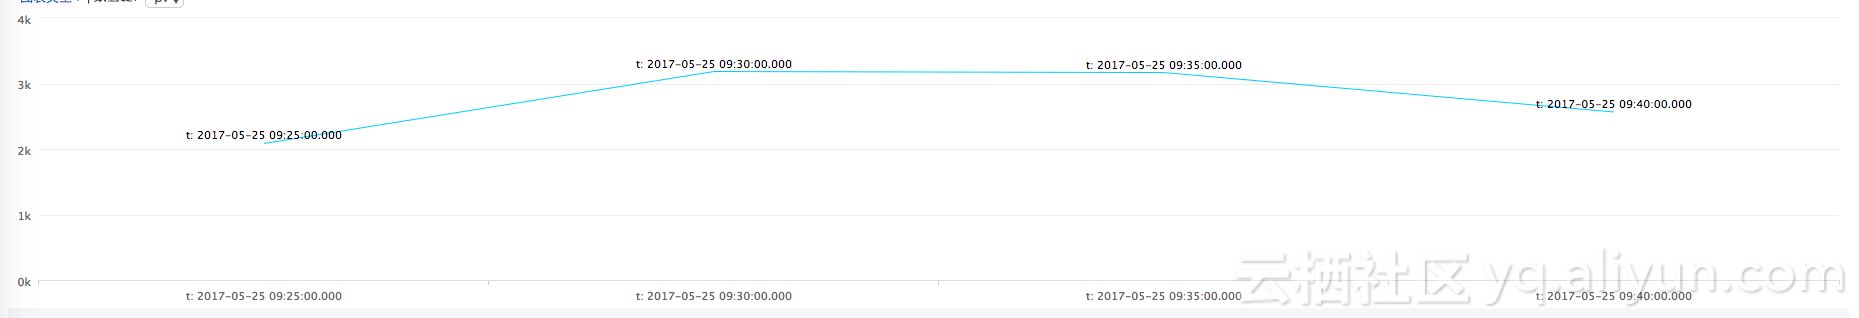
The PV statistics not only allow you to see the total PV over a period of time, but also view it over a small period of time, such as every 5 minutes of PV
Statistics Code
*|select from_unixtime( __time__- __time__% 300) as t,
     count(1) as pv
     group by __time__- __time__% 300
     order by t limit 60
Statistical Results
-
Count UV every 5 minutes in an hour
Statistics code:
*|select from_unixtime( __time__- __time__% 300) as t,
        approx_distinct(remote_addr) as uv
        group by __time__- __time__% 300
        order by t limit 60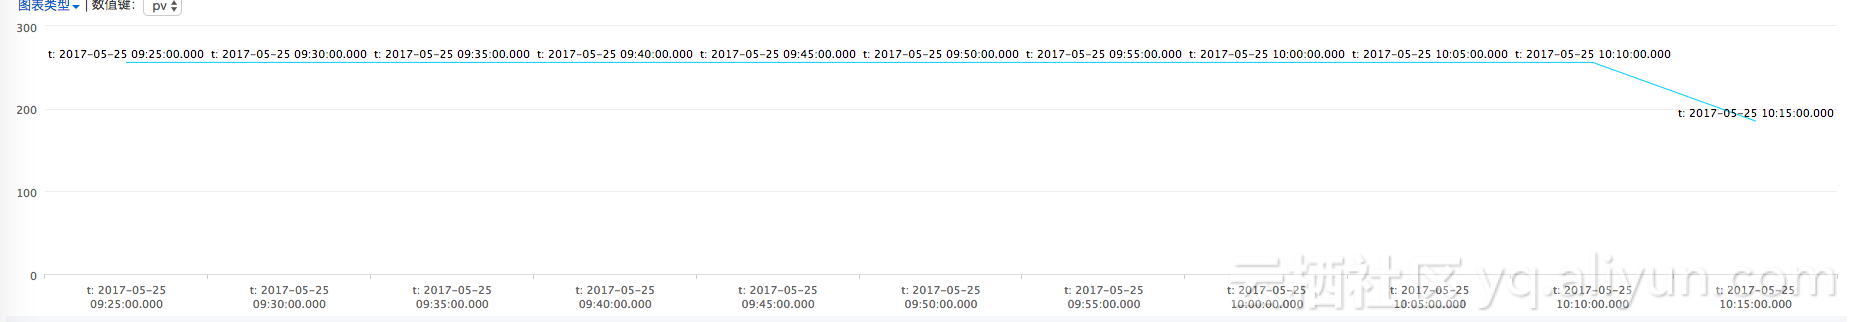
-
Count total UV in one hour
Statistics code:
*|select approx_distinct(remote_addr)Statistical results:

-
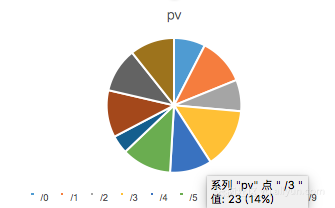
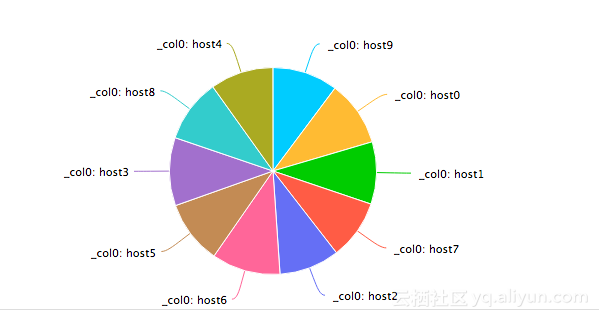
Top 10 pages visited in the last hour
*|select url,count(1) as pv group by url order by pv desc limit 10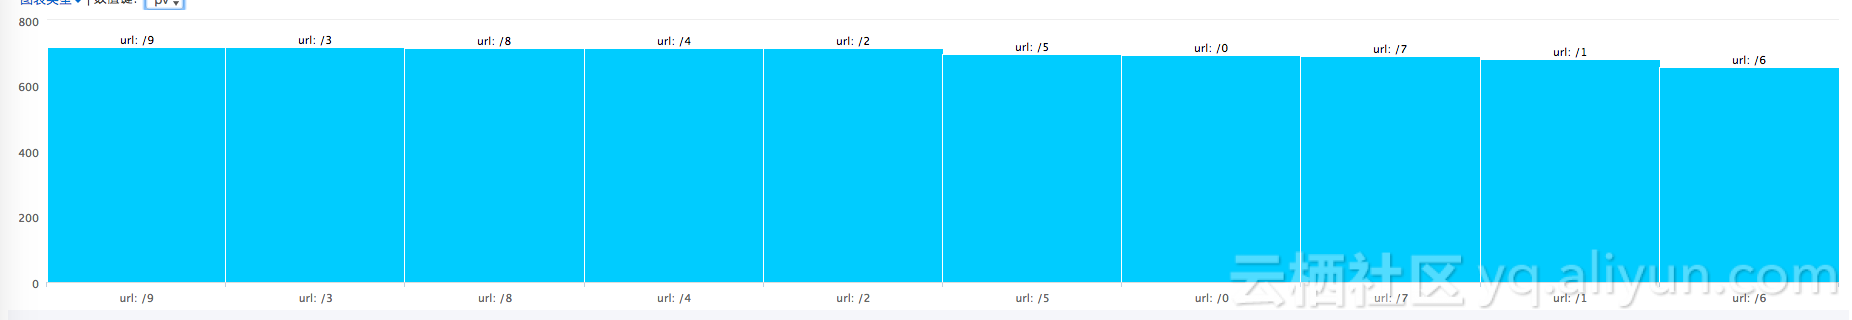
-
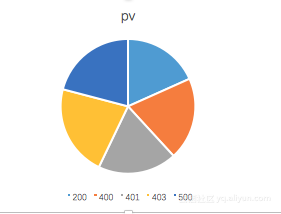
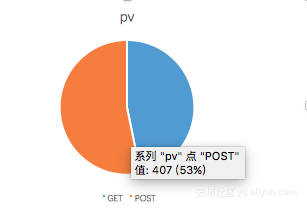
Percentage of various request methods in the last hour
*| select method, count(1) as pv group by method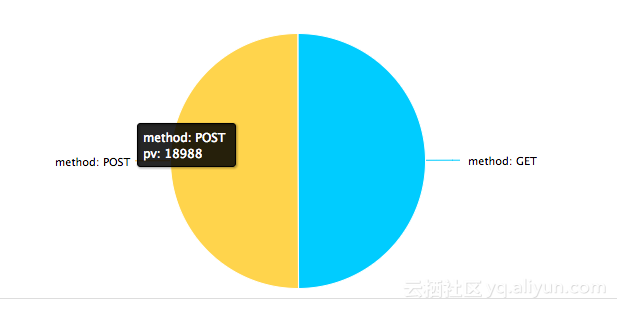
-
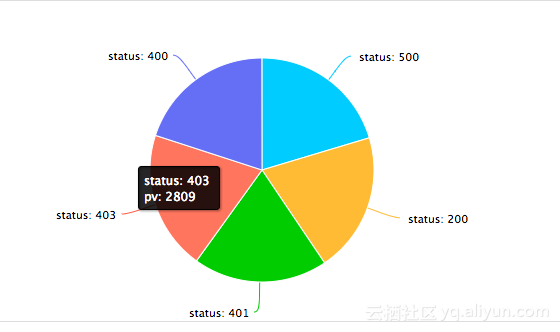
Percentage of various http status codes in the last hour
*| select status, count(1) as pv group by status
-
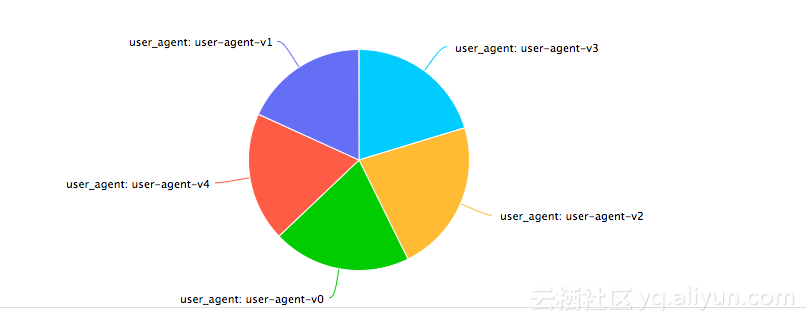
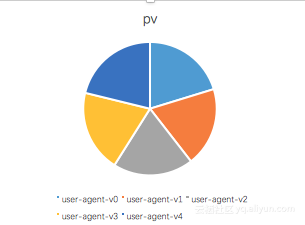
Percentage of browsers in the last hour
*| select user_agent, count(1) as pv group by user_agent
-
Percentage of referer s from different domain names in the last hour
*|select url_extract_host(http_referer) ,count(1) group by url_extract_host(http_referer)Note: url_extract_host is to extract the domain name from the URL

-
Percentage of users visiting different domain names in the last hour
*|select http_host ,count(1) group by http_host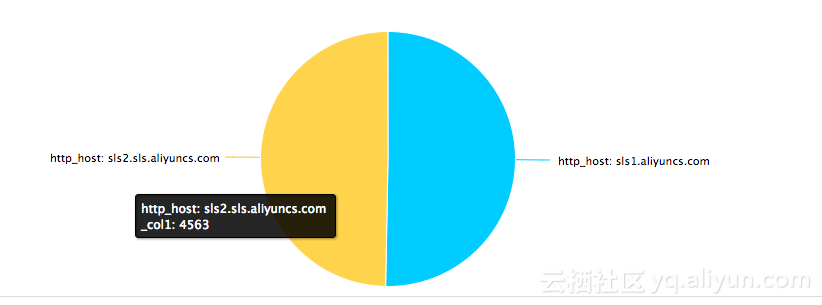
Some advanced features


In addition to some access metrics, webmasters often need to diagnose some access requests to see how late they are processing requests, what are the larger delays, and which pages have larger delays.
-
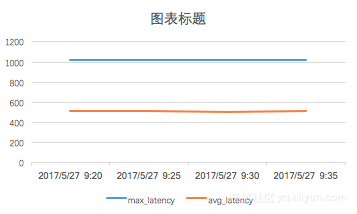
With average and maximum delays of every five minutes, you have an overall sense of the delay
*|select from_unixtime(__time__ -__time__% 300) as time,
         avg(request_time) as avg_latency ,
         max(request_time) as max_latency
         group by __time__ -__time__% 300
         limit 60
-
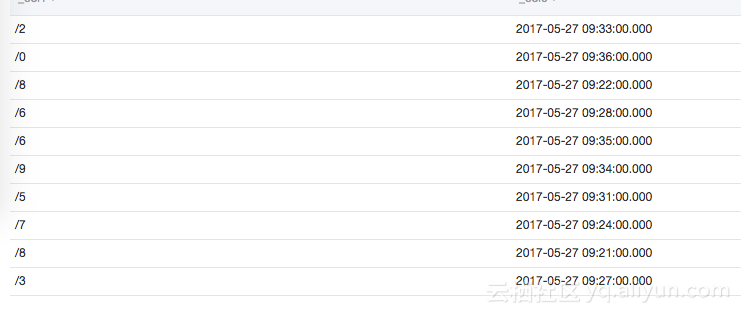
Knowing the maximum latency account number, we need to know which request page corresponds to the maximum latency to further optimize the page response.
*|select from_unixtime(__time__ - __time__% 60) ,
  max_by(url,request_time)
  group by __time__ - __time__%60
-
Overall, we need to know the distribution of latencies for all requests on the site, spread the latencies within ten buckets, and see the number of requests per latency interval
*|select numeric_histogram(10,request_time)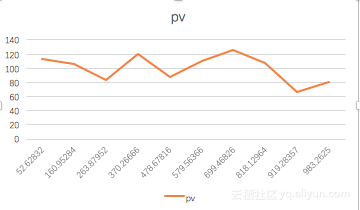
-
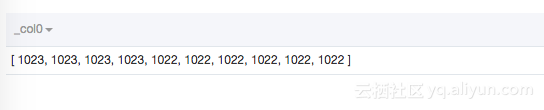
In addition to the maximum latency, we need to know what the maximum ten latencies are and what the corresponding values are
*|select max(request_time,10)
-
When we know that / 0 is the page with the most latency, in order to optimize the / 0 page, we need to count the number of visits to PV,UV, method s, status es, browsers, average latency, maximum latency of / 0 page.
url:"/0"|select count(1) as pv, approx_distinct(remote_addr) as uv, histogram(method) as method_pv,histogram(status) as status_pv, histogram(user_agent) as user_agent_pv, avg(request_time) as avg_latency, max(request_time) as max_latency

-
We can also limit the number of pv, uv, and individual url requests that view requests with request_time greater than 1000
request_time > 1000 |select count(1) as pv, approx_distinct(remote_addr) as uv, histogram(url) as url_pv