catalogue
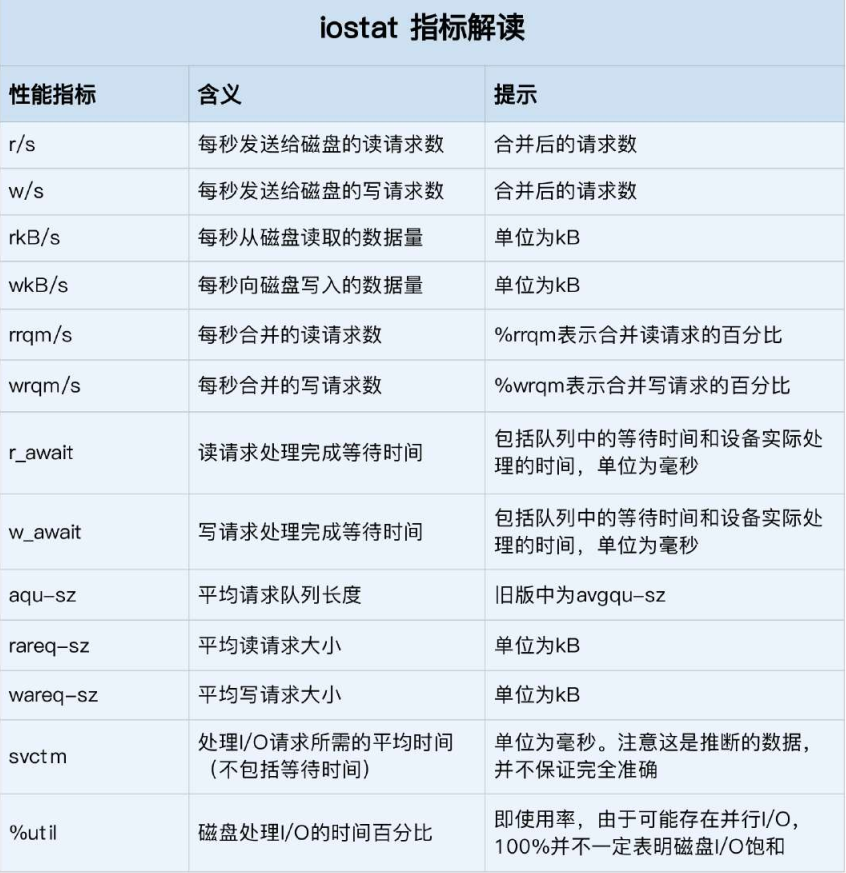
Interpretation of iostat index
How to determine whether it is random io or sequential io?
Disk performance index
Utilization, saturation, IOPS, throughput, response time, etc. These five indicators are the basic indicators to measure disk performance.
- Utilization is the percentage of time that the disk processes I/O. Excessive utilization (such as over 80%) usually means that there is a performance bottleneck in disk I/O.
- Saturation refers to the busy degree of disk processing I/O. Too high saturation means that the disk has a serious performance bottleneck. When the saturation is 100%, the disk cannot accept new I/O requests.
- IOPS (Input/Output Per Second) refers to the number of I/O requests per second.
- Throughput is the size of I/O requests per second.
- Response time refers to the interval between the sending of an I/O request and the receipt of a response
Attention
Combined with the read-write ratio, I/O type (random or continuous) and I/O size, it is analyzed comprehensively. You can't look at an indicator in isolation.
Usage scenario
IOPS can better reflect the overall performance of the system in scenarios with more random reads and writes such as databases and a large number of small files;
In scenarios with more sequential reads and writes such as multimedia, the throughput can better reflect the overall performance of the system
Performance testing tool fio
Performance of different I/O sizes (generally several values in the middle of 512B to 1MB) in various scenarios such as random read, sequential read, random write and sequential write
Disk I/O observation
iostat is the most commonly used disk I/O performance observation tool. It provides various common performance indicators such as utilization, IOPS and throughput of each disk. Of course, these indicators are actually from / proc/diskstats.
-d -x indicates the indicator showing all disk I/O
Alicloud ESC has only one disk device
[root@ninesun ~]# iostat -d -x 1
Linux 5.10.60-9.al8.x86_64 (ninesun) 	01/18/2022 	_x86_64_	(1 CPU)

Device            r/s     w/s     rkB/s     wkB/s   rrqm/s   wrqm/s  %rrqm  %wrqm r_await w_await aqu-sz rareq-sz wareq-sz  svctm  %util
vda              0.01    0.37      0.39      4.45     0.00     0.31  15.61  45.93    1.39    1.81   0.00    33.49    12.09   0.74   0.03

Device            r/s     w/s     rkB/s     wkB/s   rrqm/s   wrqm/s  %rrqm  %wrqm r_await w_await aqu-sz rareq-sz wareq-sz  svctm  %util
vda              1.00    0.00      8.00      0.00     0.00     0.00   0.00   0.00    1.00    0.00   0.00     8.00     0.00   1.00   0.10

Device            r/s     w/s     rkB/s     wkB/s   rrqm/s   wrqm/s  %rrqm  %wrqm r_await w_await aqu-sz rareq-sz wareq-sz  svctm  %util
vda              0.00    0.00      0.00      0.00     0.00     0.00   0.00   0.00    0.00    0.00   0.00     0.00     0.00   0.00   0.00

Device            r/s     w/s     rkB/s     wkB/s   rrqm/s   wrqm/s  %rrqm  %wrqm r_await w_await aqu-sz rareq-sz wareq-sz  svctm  %util
vda              0.00    0.00      0.00      0.00     0.00     0.00   0.00   0.00    0.00    0.00   0.00     0.00     0.00   0.00   0.00

Device            r/s     w/s     rkB/s     wkB/s   rrqm/s   wrqm/s  %rrqm  %wrqm r_await w_await aqu-sz rareq-sz wareq-sz  svctm  %util
vda              0.00    0.00      0.00      0.00     0.00     0.00   0.00   0.00    0.00    0.00   0.00     0.00     0.00   0.00   0.00
iostat of a node in the GP database of the production environment
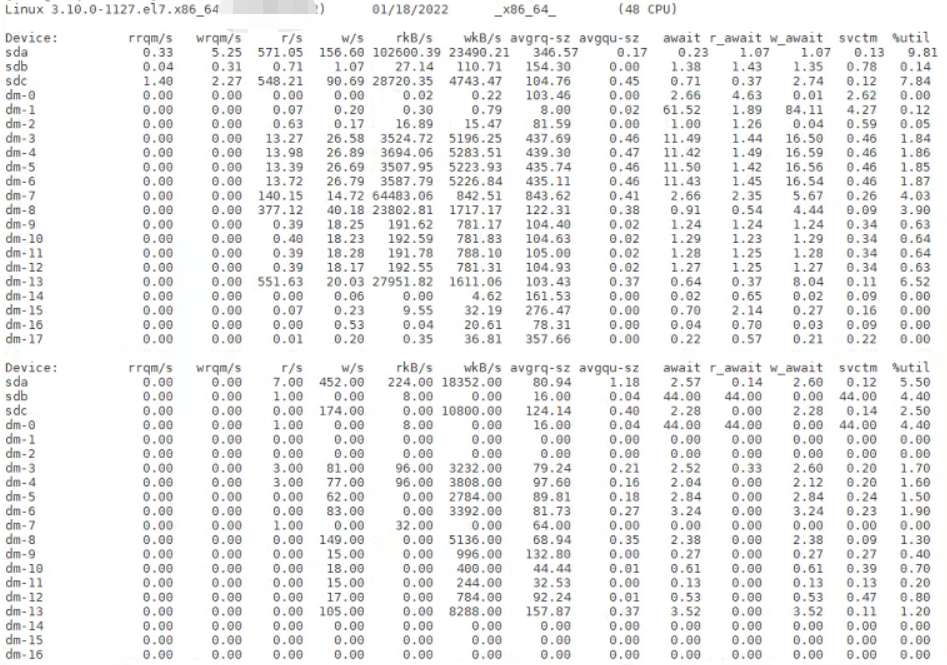
Interpretation of iostat index
- % util is the disk I/O utilization mentioned earlier;
- r/s+ w/s is IOPS;
- rkB/s+wkB/s is the throughput;
- r_await+w_await is the response time
Disk saturation cannot be obtained directly from iostat. There are usually no other simple observation methods for saturation. However, you can compare the observed average request queue length or the waiting time for the completion of read-write requests with the benchmark results (such as through fio) to comprehensively evaluate the saturation of the disk.
Process I/O observation
iostat only provides the overall I/O performance data of the disk
For a process, use pidstat and iotop.
pidstat
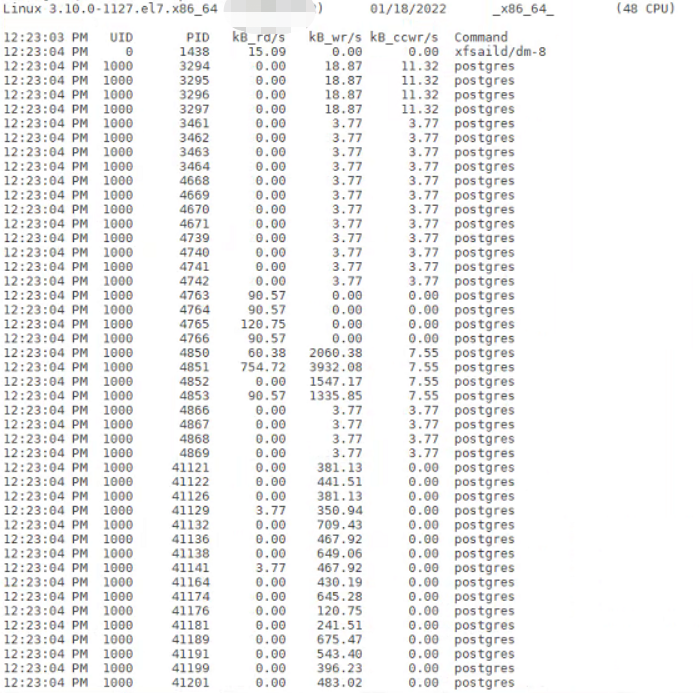
You can see the output of pidstat. It can view the I/O status of each process in real time, including the following contents.
- User ID (UID) and process ID (PID).
- The size of data read per second (kB_rd/s), in KB.
- The data size of write requests issued per second (kB_wr/s), in KB.
- The size of write request data cancelled per second (kb#ccwr / s), in KB.
iotop
It is a tool similar to top. You can sort the processes according to the I/O size, and then find the processes with large I/O.
The first two lines represent the total disk read-write size of the process and the total actual disk read-write size. They may not be equal because of factors such as cache, buffer, I/O merge, etc.
The remaining parts represent the I/O status of the process from various angles, including thread ID, I/O priority, the size of read disk per second, the size of write disk per second, and the clock percentage of switching in and waiting for I/O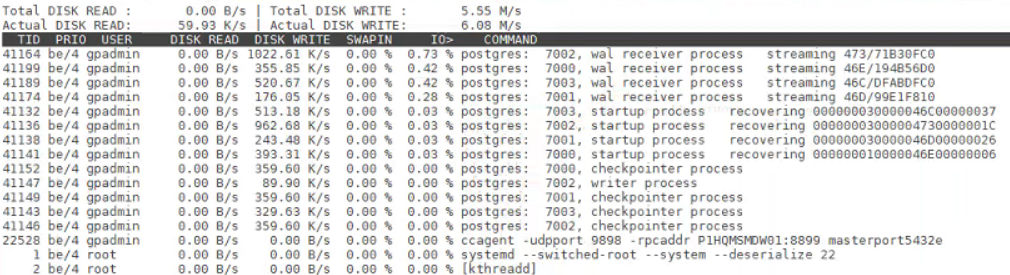
Question
How to determine whether it is random io or sequential io?
The system call of the tracking process or the I/O of the disk can be judged according to the relative position of reading and writing
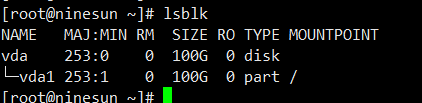
What is the difference between mounting / dev/sda directly to a directory and mounting / dev/sda1 to a directory after only one partition of the disk?
The difference is how you create a file system, partition or whole disk