In the process of data job recruitment, we often examine the SQL ability of job seekers. Here are three frequently tested SQL data analysis questions, which are sorted from simple to complex. Let's test whether you have mastered them?
Mysql.qps code 0 and above.
Title 1: find out the employees with the second highest salary in each department
There is an employee information table of the company, which contains the following four fields.
- employee_id (employee ID): VARCHAR.
- employee_name: VARCHAR.
- employee_salary: INT.
- department ID: VARCHAR.
The data of the employee table is shown in the following table.

There is also a department information table, Department, which contains the following two fields.
- department_id (Department ID): VARCHAR.
- department_name (Department name): VARCHAR.
The data of department table is shown in the following table.

The code of data import is as follows:
DROP TABLE IF EXISTS employee;
CREATE TABLE employee(
employee_id VARCHAR(8),
employee_name VARCHAR(8),
employee_salary INT(8),
department VARCHAR(8)
)
ENGINE = InnoDB
DEFAULT CHARSET = utf8;
INSERT INTO
employee (employee_id,employee_name,employee_salary,department)
VALUE ('a001','Bob',7000,'b1')
     ,('a002','Jack',9000,'b1')
     ,('a003','Alice',8000,'b2')
     ,('a004','Ben',5000,'b2')
     ,('a005','Candy',4000,'b2')
     ,('a006','Allen',5000,'b2')
     ,('a007','Linda',10000,'b3');


DROP TABLE IF EXISTS department;
CREATE TABLE department(
department_id VARCHAR(8),
department_name VARCHAR(8)
)
ENGINE = InnoDB
DEFAULT CHARSET = utf8;
INSERT INTO
department (department_id,department_name)
VALUE ('b1','Sales')
     ,('b2','IT')
     ,('b3','Product');
Question: query the employee information with the second highest salary in each department.
The output includes:
- employee_id (employee ID)
- employee_name (employee name)
- employee_salary (employee salary)
- department_id (Department name of the employee)
The result example is shown in the figure below.

Solution idea for reference: use the window function to group according to the Department ID, arrange in descending order according to the employee salary in the group and record it as ranking, and then connect the processed table with the Department information table to associate the Department name. Finally, use ranking=2 as the second highest salary condition on the connected table to filter WHERE and select the required column, The results can be obtained.
Knowledge points involved: window function, sub query and multi table connection.
The SQL code of this question is as follows for readers' reference:
SELECT  a.employee_id
       ,a.employee_name
       ,a.employee_salary
       ,b.department_id
FROM
(
    SELECT  *
           ,RANK() OVER (PARTITION BY department ORDER BY employee_salary DESC) AS ranking
    FROM employee
) AS a
INNER JOIN department AS b
ON a.department = b.department_id
WHERE a.ranking = 2;
Topic 2: Statistics of website login interval
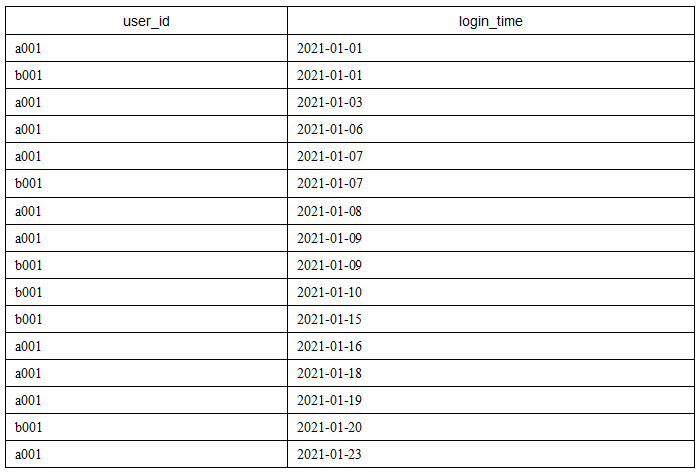
There is a website login form_ Info, which records the website login information of all users, including the following two fields.
- user_id (user ID): VARCHAR.
- login_time (user login DATE): DATE.
login_ The data of info table is shown in the following table.

The code of data import is as follows:
DROP TABLE IF EXISTS login_info;
CREATE TABLE login_info(
user_id VARCHAR(8),
login_time DATE
)
ENGINE = InnoDB
DEFAULT CHARSET = utf8;
INSERT INTO
login_info (user_id,login_time)
VALUE ('a001','2021-01-01')
,('b001','2021-01-01')
,('a001','2021-01-03')
,('a001','2021-01-06')
,('a001','2021-01-07')
,('b001','2021-01-07')
,('a001','2021-01-08')
,('a001','2021-01-09')
,('b001','2021-01-09')
,('b001','2021-01-10')
,('b001','2021-01-15')
,('a001','2021-01-16')
,('a001','2021-01-18')
,('a001','2021-01-19')
,('b001','2021-01-20')
,('a001','2021-01-23');
Problem: calculate the number of times each user's login date interval is less than 5 days.
The output includes:
- user_id (user ID)
- num (the number of times the interval between user login dates is less than 5 days)
The result example is shown in the figure below.

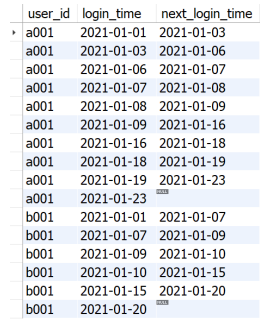
Solution ideas for reference: this question examines the use of the LEAD() function in dealing with the problem of time interval, observes the query part of the inner layer, and uses the LEAD() function in the original login_ Create a new time field based on the time field (i.e. the next login date of the user). The inner query code is as follows:
SELECT  user_id
       ,login_time
       ,LEAD(login_time,1) OVER (PARTITION BY user_id ORDER BY login_time) AS next_login_time
FROM login_info;
The query results are shown in the figure below.

It can be seen from the above figure that after being processed by the LEAD() function, the data will be processed according to the user_ The ID field is grouped according to login_ Sort the time field. After the treatment of the inner layer, you only need to filter out the next in the outer layer_ login_ Time and login_ The date difference of the time field is less than 5 days, that is, the target data of the final statistics. Here, timestamp diff (day, login_time, next_login_time) is used to calculate the date difference. Finally, different users are grouped and aggregated for statistics_ The number of records of ID, that is, the number of times each user's login date interval is less than 5 days.
Knowledge points involved: window function, sub query, grouping aggregation and time function.
The SQL code of this question is as follows for readers' reference:
SELECT  a.user_id
       ,COUNT(*) AS num
FROM
(
    SELECT  user_id
           ,login_time
           ,LEAD(login_time,1) OVER (PARTITION BY user_id ORDER BY login_time) AS next_login_time
    FROM login_info
) AS a
WHERE TIMESTAMPDIFF(DAY, login_time, next_login_time) < 5
GROUP BY user_id;
Topic 3: analysis of user purchase channels
There is a user purchase information table_ Channel, which records the shopping information of users on a shopping platform. The shopping platform has two access modes: web and app. The table contains the following four fields.
- user_id (user ID): VARCHAR.
- channel: VARCHAR.
- purchase_date: DATE.
- purchase_amount: INT.
purchase_ The data of channel table is shown in the following table.

The data import code is as follows:
DROP TABLE IF EXISTS purchase_channel;
CREATE TABLE purchase_channel(
user_id VARCHAR(8),
channel VARCHAR(8),
purchase_date DATE,
purchase_amount INT(8)
)
ENGINE = InnoDB
DEFAULT CHARSET = utf8;
INSERT INTO
purchase_channel (user_id,channel,purchase_date,purchase_amount)
VALUE ('a001','app','2021-03-14',200)
     ,('a001','web','2021-03-14',100)
     ,('a002','app','2021-03-14',400)
     ,('a001','web','2021-03-15',3000)
     ,('a002','app','2021-03-15',900)
     ,('a003','app','2021-03-15',1000);
Question: query the number and total shopping amount of users who only use the mobile terminal, users who only use the Web terminal and users who use both the Web terminal and the mobile terminal every day. Even if there is no user's purchase information in a certain channel one day, it needs to be displayed.
The output includes:
purchase_date
Channel (purchase channel)
sum_ Total purchase amount
total_users (number of users)
The result example is shown in the figure below.

Problem solving ideas for reference: group according to user ID and date, and judge the access mode (web, app and both) used by a user when shopping on a certain date by counting the number of records of users shopping in each purchase channel. Among them, web and app can be queried through one SELECT statement, while both can be queried through another SELECT statement. Connect the two parts together using UNION, and take the above parts as the internal part of the sub query, and count the total purchase amount and total purchase users of different purchase dates and purchase channels outside the sub query.
The SQL code of this part is as follows:
SELECT  purchase_date
       ,channel
       ,SUM(sum_amount) sum_amount
       ,SUM(total_users) total_users
FROM
(
    SELECT  purchase_date
           ,MIN(channel) channel
           ,SUM(purchase_amount) sum_amount
           ,COUNT(DISTINCT user_id) total_users
    FROM purchase_channel
    GROUP BY  purchase_date
             ,user_id
    HAVING COUNT(DISTINCT channel) = 1 UNION
    SELECT  purchase_date
           ,'both' channel
           ,SUM(purchase_amount) sum_amount
           ,COUNT(DISTINCT user_id) total_users
    FROM purchase_channel
    GROUP BY  purchase_date
             ,user_id
    HAVING COUNT(DISTINCT channel) > 1
) c
GROUP BY  purchase_date
         ,channel;
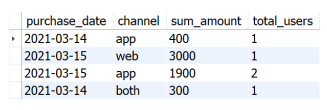
The output results of this part are shown in the figure below.

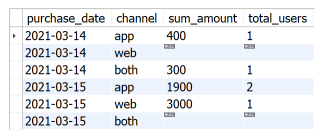
The above parts seem to have completed the requirements of this topic, but careful observation will find that the topic requires that even if there is no user's purchase information in a certain channel one day, it needs to be displayed. If you want to display more complete information, consider using the most complete information (Cartesian product of all dates and three channels) to connect LEFT JOIN with the just queried result data table, and you can get the results of connecting the two tables according to dates and channels.
Knowledge points involved: UNION, grouping aggregation and data De duplication.
The SQL code of this question is as follows for readers' reference:
SELECT  t1.purchase_date
       ,t1.channel
       ,t2.sum_amount
       ,t2.total_users
FROM
(
    SELECT  DISTINCT a.purchase_date
           ,b.channel
    FROM purchase_channel a,
    (
        SELECT  "app" AS channel
        UNION
        SELECT  "web" AS channel
        UNION
        SELECT  "both" AS channel
    ) b
) t1
LEFT JOIN
(
SELECT
purchase_date,
channel,
SUM(sum_amount) sum_amount,
SUM(total_users) total_users
FROM (
SELECT  purchase_date
           ,MIN(channel) channel
           ,SUM(purchase_amount) sum_amount
           ,COUNT(DISTINCT user_id) total_users
    FROM purchase_channel
    GROUP BY  purchase_date,user_id
    HAVING COUNT(DISTINCT channel) = 1
    UNION
    SELECT  purchase_date
           ,'both' channel
           ,SUM(purchase_amount) sum_amount
           ,COUNT(DISTINCT user_id) total_users
    FROM purchase_channel
    GROUP BY  purchase_date,user_id
    HAVING COUNT(DISTINCT channel) > 1
)c GROUP BY purchase_date, channel
) t2
ON t1.purchase_date = t2.purchase_date AND t1.channel = t2.channel;
Have you worked out these questions?
The title of this article is extracted from the newly published SQL data analysis: from basic ice breaking to interview problem solving