Network performance index
In fact, bandwidth, throughput, delay, PPS (Packet Per Second) and other indicators are usually used to measure the performance of the network
- Bandwidth, indicating the maximum transmission rate of the link, usually in b/s (bits / second)
- Throughput refers to the amount of data successfully transmitted in a unit time. The unit is usually B / S (bit / s) or B / S (byte / s)
Throughput is limited by bandwidth, and throughput / bandwidth is the utilization of the network - Delay refers to the time delay required from the time when the network request is sent to the time when the remote response is received
This indicator may have different meanings in different scenarios
For example, it can represent the time required to establish a connection (such as TCP handshake delay), or the time required for a packet to and from (such as RTT) - PPS, the abbreviation of Packet Per Second, represents the transmission rate in network packets
PPS is usually used to evaluate the forwarding capability of the network
For example, hardware switches can usually achieve linear forwarding (that is, PPS can reach or close to the theoretical maximum)
The forwarding based on Linux server is easily affected by the network packet size
In addition to these indicators, the availability of the network (whether the network can communicate normally) and the number of concurrent connections (the number of TCP connections)
Packet loss rate (percentage of packet loss) and retransmission rate (proportion of retransmitted network packets) are also commonly used performance indicators
Network benchmark
Linux network is based on TCP/IP protocol stack, and the behavior of different protocol layers is obviously different
Before testing, we should find out which layer of the protocol stack the network performance to be evaluated belongs to?
In other words, which layer of the protocol stack is the application based on?
According to the principle of TCP/IP protocol stack learned earlier
- Web applications based on HTTP or HTTPS obviously belong to the application layer and need to test the performance of HTTP/HTTPS
- For most game servers, in order to support a larger number of people online at the same time
We usually interact with clients based on TCP or UDP, so we need to test the performance of TCP/UDP - Linux is used as a softswitch or router
In this case, focus on the processing capacity of network packets (i.e. PPS), and focus on the forwarding performance of network layer
Performance test of each protocol layer
Forwarding performance
Network interface layer and network layer, which are mainly responsible for the encapsulation, addressing, routing, sending and receiving of network packets
In these two network protocol layers, the number of network packets that can be processed per second PPS is the most important performance index
In particular, the processing capacity of 64B packets deserves special attention
So how to test the processing power of network packets?
pktgen, a high performance network testing tool built into Linux kernel
pktgen supports a wealth of custom options to facilitate the construction of required network packages according to actual needs, so as to more accurately test the performance of the target server
However, in Linux systems, the pktgen command cannot be found directly
Because pktgen runs as a kernel thread, you need to load the pktgen kernel module and then interact through the / proc file system
The following are the interactive files between the two kernel threads started by pktgen and the / proc file system
# System version
root@alnk:~# lsb_release -a
....
Description:Ubuntu 18.04.5 LTS
Release:18.04

root@alnk:~# uname -a
Linux alnk 4.15.0-136-generic #140-Ubuntu SMP Thu Jan 28 05:20:47 UTC 2021 x86_64 x86_64 x86_64 GNU/Linux

root@alnk:~# cat /proc/version
Linux version 4.15.0-136-generic (buildd@lcy01-amd64-029) (gcc version 7.5.0 (Ubuntu 7.5.0-3ubuntu1~18.04)) #140-Ubuntu SMP Thu Jan 28 05:20:47 UTC 2021

##
root@alnk:~# modprobe pktgen
root@alnk:~# ps -ef|grep pktgen|grep -=vv grep
root      3524     2  0 09:58 ?        00:00:00 [kpktgend_0]
root      3526     2  0 09:58 ?        00:00:00 [kpktgend_1]
root@alnk:~# ls /proc/net/pkgttgen/
kpktgend_0  kpktgend_1  pgctrl
Pktgen starts a kernel thread on each CPU and can interact with these threads through the file with the same name under / proc/net/pktgen
pgctrl is mainly used to control the start and stop of this test
If the modprobe command fails, the kernel is not configured with CONFIG_NET_PKTGEN options
This requires configuring the pktgen kernel module (i.e. CONFIG_NET_PKTGEN=m) and recompiling the kernel before it can be used
When using pktgen to test network performance, you need to give each kernel thread kpktend first_ X and test network card, configure pktgen options
Then start the test through pgctrl
Take the contracting test as an example. Suppose that the network card used by the contracting machine is eth0
The IP address of the target machine is 192.168 0.55, MAC address is 11:11:11:11:11
Next is an example of contract testing
root@alnk:~# cat psget.sh
# Define a tool function to configure various test options later
function pgset() {
    local result
    echo $1 > $PGDEV

    result=`cat $PGDEV | fgrep "Result: OK:"`
    if [ "$result" = "" ]; then
         cat $PGDEV | fgrep Result:
    fi
}

# Bind eth0 network card for thread 0
PGDEV=/proc/net/pktgen/kpktgend_0
pgset "rem_device_all"   # Clear network card binding
pgset "add_device eth0"  # Add eth0 network card

# Configure test options for eth0 network card
PGDEV=/proc/net/pktgen/eth0
pgset "count 1000000"    # Total contract quantity
pgset "delay 5000"       # Transmission delay between different packets (in nanoseconds)
pgset "clone_skb 0"      # SKB package replication
pgset "pkt_size 64"      # Network packet size
pgset "dst 192.168.0.55" # Destination IP
pgset "dst_mac 11:11:11:11:11:11"  # Destination MAC

# Start test
PGDEV=/proc/net/pktgen/pgctrl
pgset "start"

##### Start execution
root@alnk:~# chmod +x psget.sh
root@alnk:~# ./psget.sh
After the test is completed, the results can be obtained from the / proc file system
You can view the test report just now through the content in the following code segment
root@alnk:~# cat /proc/net/pktgen/eth0
Params: count 1000000  min_pkt_size: 64  max_pkt_size: 64
     frags: 0  delay: 5000  clone_skb: 0  ifname: eth0
     flows: 0 flowlen: 0
     queue_map_min: 0  queue_map_max: 0
     dst_min: 192.168.0.55  dst_max:
     src_min:   src_max:
     src_mac: fa:16:3e:26:00:b6 dst_mac: 11:11:11:11:11:11
     udp_src_min: 9  udp_src_max: 9  udp_dst_min: 9  udp_dst_max: 9
     src_mac_count: 0  dst_mac_count: 0
     Flags:
Current:
     pkts-sofar: 1000000  errors: 0
     started: 15520168046us  stopped: 15529403173us idle: 7838854us
     seq_num: 1000001  cur_dst_mac_offset: 0  cur_src_mac_offset: 0
     cur_saddr: 192.168.0.53  cur_daddr: 192.168.0.55
     cur_udp_dst: 9  cur_udp_src: 9
     cur_queue_map: 0
     flows: 0
Result: OK: 9235127(c1396272+d7838854) usec, 1000000 (64byte,0frags)
  108282pps 55Mb/sec (55440384bps) errors: 0
##
1. Part I Params Is a test option
2. Part II Current Test progress
   among packts so far(pkts-sofar)Indicates that 1 million packets have been sent, which indicates that the test has been completed
3. Part III Result Is the test result, including the test time, the number of network packets and fragmentation PPS,Throughput and number of errors
According to the above results, it is found that the PPS is 100000, the throughput is 55Mb/s, and no errors occur
How about 100000 PPS?
For comparison, you can calculate the PPS of Gigabit switches
The switch can reach line speed (error free forwarding at full load), and its PPS is 1000Mbit divided by the size of Ethernet frame
That is, 1000Mbps/((64+20)*8bit)=1.5Mpps (where 20B is the header size of Ethernet frame)
Even the PPS of Gigabit switches can reach 1.5 million PPS, much more than the 100000 PPS obtained in the test
So don't worry when you see this value. Now multi-core servers and 10 Gigabit network cards are very common, and millions of PPS can be achieved with a little optimization
Moreover, if the DPDK or XDP mentioned in the last lesson is used, it can reach the order of ten million
TCP/UDP performance
TCP and UDP performance test methods, using iperf or netperf tools
Especially in the cloud computing era, when I just got a batch of virtual machines
The first thing to do is to use iperf to test whether the network performance meets the expectations
-
iperf and netperf are the most commonly used network performance testing tools to test the throughput of TCP and UDP
They all test the average throughput over a period of time by communicating between the client and the server# Ubuntu root@alnk:~# apt-get install iperf3 # CentOS yum install iperf3
-
Start the iperf server on the target machine
# -s means start the server
# -i means reporting interval
# -p indicates the listening port
root@alnk:~# iperf3 -s -i 1 -p 10000
-
Run the iperf client run test on another machine
# -c means start the client 192.168 0.30 is the IP address of the target server
# -b represents the target bandwidth (in bits/s)
# -t is the test time
# -P indicates the number of concurrent
# -p indicates the listening port of the target server
[root@local_deploy_192-168-1-5 ~]# iperf3 -c 124.71.83.217 -b 1G -t 15 -P 2 -p 10000
-
After the test, go back to the target server and check the iperf report
# Public network test
[ ID] Interval           Transfer     Bandwidth
[  5]   0.00-15.03  sec  0.00 Bytes  0.00 bits/sec                  sender
[  5]   0.00-15.03  sec  13.0 MBytes  7.28 Mbits/sec                  receiver
[  7]   0.00-15.03  sec  0.00 Bytes  0.00 bits/sec                  sender
[  7]   0.00-15.03  sec  12.3 MBytes  6.88 Mbits/sec                  receiver
[SUM]   0.00-15.03  sec  0.00 Bytes  0.00 bits/sec                  sender
[SUM]   0.00-15.03  sec  25.4 MBytes  14.2 Mbits/sec                  receiver
-----------------------------------------------------------
Server listening on 10000
##
final SUM Line is the summary result of the test, including test time, data transmission volume and bandwidth
 According to sending and receiving, this part is divided into sender and receiver Two lines
 As can be seen from the test results, this machine TCP The received bandwidth (throughput) is 14.2Mb/s
 1 with target Gb/s There are still some gaps


## Intranet test
[ ID] Interval           Transfer     Bandwidth
[  5]   0.00-15.04  sec  0.00 Bytes  0.00 bits/sec                  sender
[  5]   0.00-15.04  sec  1.71 GBytes   974 Mbits/sec                  receiver
[  7]   0.00-15.04  sec  0.00 Bytes  0.00 bits/sec                  sender
[  7]   0.00-15.04  sec  1.71 GBytes   974 Mbits/sec                  receiver
[SUM]   0.00-15.04  sec  0.00 Bytes  0.00 bits/sec                  sender
[SUM]   0.00-15.04  sec  3.41 GBytes  1.95 Gbits/sec                  receiver
HTTP performance
From the transport layer up to the application layer
Some applications will build services directly based on TCP or UDP
Of course, there are a large number of applications. Services are built based on application layer protocols. HTTP is the most commonly used application layer protocol
For example, various commonly used Web services such as Apache and Nginx are based on HTTP
There are also a number of tools available to test the performance of HTTP
For example, ab and webch are commonly used HTTP stress testing tools
Among them, ab is Apache's own HTTP pressure measurement tool
It mainly tests the number of requests per second, request delay, throughput and distribution of request delay of HTTP service
-
Installation ab tool
# Ubuntu
$ apt-get install -y apache2-utils
# CentOS
$ yum install -y httpd-tools
-
Start an Nginx service on the target machine using Docker, and then use ab to test its performance
First, run the following command on the target machineroot@alnk:~# docker run -p 80:80 -itd nginx
-
On another machine, run the ab command to test the performance of Nginx
# Public network test
# -c indicates that the number of concurrent requests is 100
# -n indicates that the total number of requests is 1000
[root@local_deploy_192-168-1-5 ~]# ab -c 100 -n 1000 http://124.71.83.217/
......
Server Software:        nginx/1.21.4
Server Hostname:        124.71.83.217
Server Port:            80
......
Requests per second:    470.58 [#/sec] (mean)
Time per request:       212.506 [ms] (mean)
Time per request:       2.125 [ms] (mean, across all concurrent requests)
Transfer rate:          391.96 [Kbytes/sec] received

Connection Times (ms)
              min  mean[+/-sd] median   max
Connect:        6   67 231.6     13    2018
Processing:     6   66 130.4     12    1534
Waiting:        6   38  72.3     12     667
Total:         13  133 281.7     26    2027

Percentage of the requests served within a certain time (ms)
  50%     26
  66%     28
  75%     29
  80%    227
  90%    240
  95%   1015
  98%   1226
  99%   1233
 100%   2027 (longest request)
##
ab The test results are divided into three parts: request summary, connection time summary and request delay summary
1. Requests per second 470
2. Delay per request( Time per request)Divided into two lines
   212 in the first line ms Represents the average delay, including the scheduling time of thread operation and the response time of network request
   2 on the next line.125ms ,Represents the response time of the actual request
3. Transfer rate Represents throughput( BPS)391 KB/s
##
The connection time summary section shows the time for establishing connection, requesting, waiting and summarizing
 Including minimum, maximum, average and median processing time
##
## Intranet test
root@alnk:~# ab -c 100 -n 1000 http://192.168.0.53/
......
Server Software:        nginx/1.21.4
Server Hostname:        192.168.0.53
Server Port:            80
......
Requests per second:    12895.41 [#/sec] (mean)
Time per request:       7.755 [ms] (mean)
Time per request:       0.078 [ms] (mean, across all concurrent requests)
Transfer rate:          10729.38 [Kbytes/sec] received

Connection Times (ms)
              min  mean[+/-sd] median   max
Connect:        0    1   1.1      1       4
Processing:     0    6   3.5      6      14
Waiting:        0    6   3.4      5      13
Total:          1    7   3.3      8      14
Application load performance
When using iperf or ab test tools to obtain performance data of TCP and HTTP, can these data represent the actual performance of the application?
The answer should be No
For example, an application provides a Web service to end users based on the HTTP protocol
At this time, using ab tool, you can get the access performance of a page, but the result is likely to be inconsistent with the user's actual request
Because user requests are often accompanied by various payload s
These loads affect the processing logic within the Web application, which affects the final performance
Then, in order to get the actual performance of the application, the performance tool itself is required to simulate the user's request load
Tools such as iperf and ab are powerless
You can use wrk, TCPCopy, Jmeter or LoadRunner to achieve this goal
Take wrk as an example. It is an HTTP performance testing tool with built-in LuaJIT
It is convenient to generate the required request load or customize the response processing method according to the actual requirements
The wrk tool itself does not provide the installation method of yum or apt. it needs to be installed through source code compilation
For example, you can run the following command to compile and install wrk
# Download the zip package, https://github.com/wg/wrk
root@alnk:~# unzip wrk-master.zip
root@alnk:~# cd wrk-master/
root@alnk:~# apt-get install build-essential -y
root@alnk:~# make
root@alnk:~# cp wrk /usr/local/bin/
The command line parameters of wrk are relatively simple
For example, you can use wrk to retest the performance of the previously started Nginx
## Public network test
# -c represents the number of concurrent connections 1000
# -t indicates that the number of threads is 2
[root@local_deploy_192-168-1-5 ~]# wrk -c 1000 -t 2 http://124.71.83.217/
Running 10s test @ http://124.71.83.217/
  2 threads and 1000 connections
  Thread Stats   Avg      Stdev     Max   +/- Stdev
    Latency   127.16ms  276.45ms   2.00s    89.95%
    Req/Sec   592.16      1.77k   11.69k    95.29%
  11283 requests in 10.02s, 9.42MB read
  Socket errors: connect 0, read 0, write 209, timeout 592
Requests/sec:   1125.98
Transfer/sec:      0.94MB
##

## Intranet test
root@alnk:~# wrk -c 1000 -t 2 http://192.168.0.53/
Running 10s test @ http://192.168.0.53/
  2 threads and 1000 connections
  Thread Stats   Avg      Stdev     Max   +/- Stdev
    Latency    30.99ms   18.12ms 305.08ms   78.50%
    Req/Sec    15.57k     2.97k   21.65k    74.75%
  310194 requests in 10.09s, 253.52MB read
Requests/sec:  30729.55
Transfer/sec:     25.12MB
##
Here, 2 threads and 1000 concurrent connections are used to retest Nginx Performance of
 You can see that the number of requests per second is 30729 and the throughput is 25.12MB,The average delay is 30.99ms,Than before ab The test results are much better
This also shows the performance of the performance tool itself, which is also very important for performance testing
Inappropriate performance tools do not accurately measure the best performance of the application
Of course, wrk's biggest advantage is its built-in LuaJIT, which can be used to test the performance of complex scenarios
When calling Lua script, wrk can divide the HTTP request into three stages: setup, running and done
As shown in the figure below
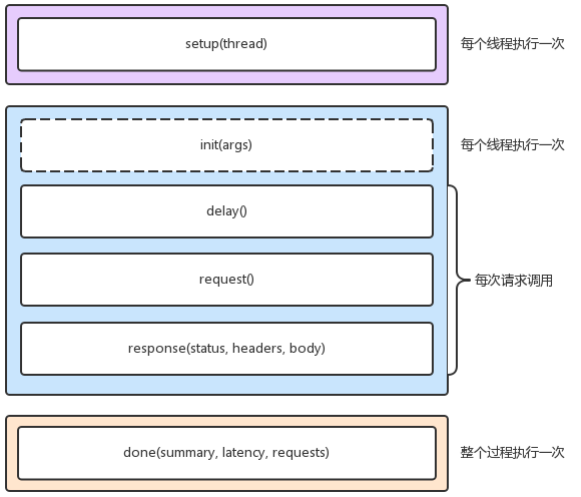
For example, you can set authentication parameters for the request in the setup phase (from the official wrk example)
root@alnk:~# cat auth.lua
-- example script that demonstrates response handling and
-- retrieving an authentication token to set on all future
-- requests

token = nil
path  = "/authenticate"

request = function()
   return wrk.format("GET", path)
end

response = function(status, headers, body)
   if not token and status == 200 then
      token = headers["X-Token"]
      path  = "/resource"
      wrk.headers["X-Token"] = token
   end
end
When executing the test, the path to execute the script through the - s option
root@alnk:~# wrk -c 1000 -t 2 -s auth.lua http://192.168.0.53/
Running 10s test @ http://192.168.0.53/
  2 threads and 1000 connections
  Thread Stats   Avg      Stdev     Max   +/- Stdev
    Latency    38.00ms   45.83ms   1.13s    96.61%
    Req/Sec    14.11k     3.04k   19.90k    61.31%
  280685 requests in 10.06s, 82.45MB read
  Non-2xx or 3xx responses: 280685
Requests/sec:  27898.25
Transfer/sec:      8.19MB
##
wrk To use Lua Script to construct the request payload
 This may be enough for most scenarios
 However, its disadvantage is that everything needs code to construct, and the tool itself does not provide GUI environment
##
image Jmeter perhaps LoadRunner(Commercial products) provide script recording, playback GUI And other richer functions
 It is also more convenient to use
Summary
Performance evaluation is the premise of optimizing network performance. Network performance optimization is needed only when network performance bottlenecks are found
According to the principle of TCP/IP protocol stack, different protocol layers pay different attention to performance, which corresponds to different performance test methods
- In the application layer, you can use wrk, Jmeter, etc. to simulate the load of users and test the number of requests per second, processing delay, errors, etc. of the application
- In the transport layer, you can use tools such as iperf to test the throughput of TCP
- Further down, you can also use pktgen that comes with the Linux kernel to test the PPS of the server
Because the low-level protocol is the basis of the high-level protocol
Therefore, generally, it is necessary to test the performance of each protocol layer from top to bottom
Then, according to the results of performance test, combined with the principle of Linux network protocol stack, find out the root cause of performance bottleneck, and then optimize network performance