In addition to the increase of network delay caused by DDoS, there are other reasons for network delay, such as
- Network transmission is slow, resulting in delay
- The message processing of Linux kernel protocol stack is slow, resulting in delay
- Application data processing is slow, resulting in delays, etc
Network delay
When it comes to network delay, you may easily think of its meaning - the time taken for network data transmission
Note, however, that this time may be one-way, referring to the one-way time from the source address to the destination address
It may also be bidirectional, that is, it takes time to send a response from the source address to the destination address, and then send a response back from the destination address
Generally, two-way round-trip communication delay is more commonly used. For example, the result of ping test is round-trip delay RTT (round trip time)
In addition to network latency
Another commonly used indicator is application latency, which refers to the time taken from the application to receive the request and then to send back the response
Generally, application delay also refers to round-trip delay, which is the sum of network data transmission time and data processing time
In the Linux network basics, you can use ping to test network latency
ping is based on ICMP Protocol. It obtains the round-trip delay by calculating the time difference between ICMP echo response message and ICMP echo request message
This process does not require special authentication and is often used by many network attacks, such as port scanning tool nmap, packet forming tool hping3 and so on
Therefore, in order to avoid these problems, many network services will prohibit ICMP
This makes it impossible for us to use ping to test the availability and round trip delay of network services
At this time, the TCP and UDP modes of traceroute or hping3 can be used to obtain the network delay
For example, Baidu Com as an example, you can execute the following hping3 command to test the network delay from the current machine to Baidu search server
# -c means sending 3 requests
# -S indicates setting TCP SYN
# -p means the port number is 80
root@alnk:~# hping3 -c 3 -S -p 80 baidu.com
HPING baidu.com (eth0 220.181.38.251): S set, 40 headers + 0 data bytes
len=46 ip=220.181.38.251 ttl=48 id=60840 sport=80 flags=SA seq=0 win=8192 rtt=47.9 ms
len=46 ip=220.181.38.251 ttl=49 id=62209 sport=80 flags=SA seq=1 win=8192 rtt=47.8 ms
len=46 ip=220.181.38.251 ttl=49 id=27368 sport=80 flags=SA seq=2 win=8192 rtt=47.8 ms

--- baidu.com hping statistic ---
3 packets transmitted, 3 packets received, 0% packet loss
round-trip min/avg/max = 47.8/47.8/47.9 ms
##
from hping3 As can be seen from the results, the round trip delay RTT For 47 ms
Of course, similar results can be obtained with traceroute
# --TCP means using the TCP protocol
# -p indicates the port number
# -n means that reverse domain name resolution is not performed on the IP address in the result
root@alnk:~# traceroute --tcp -p 80 -n baidu.com
traceroute to baidu.com (220.181.38.148), 30 hops max, 60 byte packets
 1  * * *
 2  * * *
 3  * * *
 4  * * *
 5  * * *
 6  * * *
 7  * * *
 8  * * *
 9  * * *
10  * * *
11  * * *
12  183.60.190.109  5.303 ms * *
13  * * *
14  * * *
15  * * *
16  * * *
17  * * *
18  * * *
19  * * *
20  * * *
21  10.166.96.36  46.231 ms 220.181.38.148  42.693 ms *
##
traceroute Three packets will be sent in each hop of the route, and the round-trip delay will be output after receiving the response
 If there is no response or the response times out (default 5) s),An asterisk will be output
Analysis ideas and cases when network delay increases
-
Case preparation
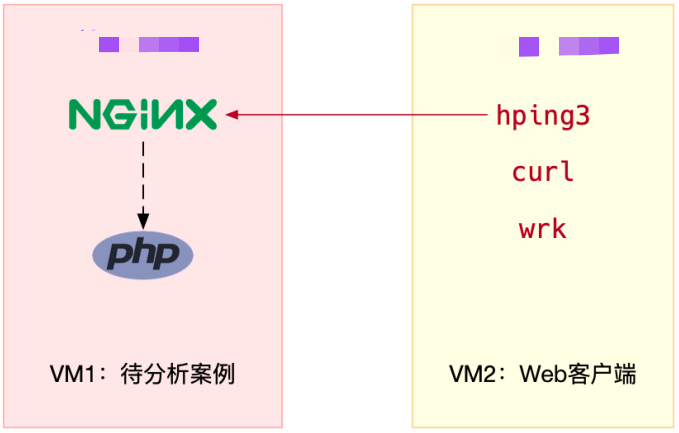
Ubuntu 18.04
 Machine configuration: 2 CPU,4GB Memory
 Pre installation docker,hping3,tcpdump,curl,wrk,Wireshark Other tools
-
In terminal 1, execute the following command to run the official Nginx, which will listen on port 80
root@alnk:~# docker run --network=host --name=good -itd nginx
-
Continue to execute the following command in terminal 1 to run the case application, which will listen to port 8080
root@alnk:~# docker run --name nginx --network=host -itd feisky/nginx:latency
-
Execute curl command in terminal 2 to verify that the two containers have been started normally
# 80 normal [root@local_deploy_192-168-1-5 ~]# curl http://124.71.83.217 <!DOCTYPE html> <html> <head> <title>Welcome to nginx!</title> <style> html { color-scheme: light dark; } body { width: 35em; margin: 0 auto; font-family: Tahoma, Verdana, Arial, sans-serif; } </style> </head> <body> <h1>Welcome to nginx!</h1> <p>If you see this page, the nginx web server is successfully installed and working. Further configuration is required.</p> <p>For online documentation and support please refer to <a href="http://nginx.org/">nginx.org</a>.<br/> Commercial support is available at <a href="http://nginx.com/">nginx.com</a>.</p> <p><em>Thank you for using nginx.</em></p> </body> </html> # 8080 normal [root@local_deploy_192-168-1-5 ~]# curl http://124.71.83.217:8080 <!DOCTYPE html> <html> <head> <title>Welcome to nginx!</title> <style> body { width: 35em; margin: 0 auto; font-family: Tahoma, Verdana, Arial, sans-serif; } </style> </head> <body> <h1>Welcome to nginx!</h1> <p>If you see this page, the nginx web server is successfully installed and working. Further configuration is required.</p> <p>For online documentation and support please refer to <a href="http://nginx.org/">nginx.org</a>.<br/> Commercial support is available at <a href="http://nginx.com/">nginx.com</a>.</p> <p><em>Thank you for using nginx.</em></p> </body> </html> -
In terminal 2, execute the following command to test the delay of port 80 and port 8080 of the case machine respectively
# Test 80 port delay
[root@local_deploy_192-168-1-5 ~]# hping3 -c 3 -S -p 80 124.71.83.217
HPING 124.71.83.217 (eth0 124.71.83.217): S set, 40 headers + 0 data bytes
len=46 ip=124.71.83.217 ttl=48 DF id=0 sport=80 flags=SA seq=0 win=64240 rtt=9.8 ms
len=46 ip=124.71.83.217 ttl=48 DF id=0 sport=80 flags=SA seq=1 win=64240 rtt=8.5 ms
len=46 ip=124.71.83.217 ttl=48 DF id=0 sport=80 flags=SA seq=2 win=64240 rtt=7.4 ms

--- 124.71.83.217 hping statistic ---
3 packets transmitted, 3 packets received, 0% packet loss
round-trip min/avg/max = 7.4/8.6/9.8 ms

# Test 8080 port delay
[root@local_deploy_192-168-1-5 ~]# hping3 -c 3 -S -p 8080 124.71.83.217
HPING 124.71.83.217 (eth0 124.71.83.217): S set, 40 headers + 0 data bytes
len=46 ip=124.71.83.217 ttl=48 DF id=0 sport=8080 flags=SA seq=0 win=64240 rtt=8.5 ms
len=46 ip=124.71.83.217 ttl=48 DF id=0 sport=8080 flags=SA seq=1 win=64240 rtt=7.7 ms
len=46 ip=124.71.83.217 ttl=48 DF id=0 sport=8080 flags=SA seq=2 win=64240 rtt=7.6 ms

--- 124.71.83.217 hping statistic ---
3 packets transmitted, 3 packets received, 0% packet loss
round-trip min/avg/max = 7.6/7.9/8.5 ms
##
# From this output, you can see that the delay of the two ports is almost 8ms
# However, this is only the case for a single request. What happens if you change to concurrent requests?
-
In terminal 2, execute the following new command to test the performance of port 80 and port 8080 when the case machine is concurrent for 100
# Test 80 port performance [root@local_deploy_192-168-1-5 ~]# wrk --latency -c 100 -t 2 --timeout 2 http://124.71.83.217/ Running 10s test @ http://124.71.83.217/ 2 threads and 100 connections Thread Stats Avg Stdev Max +/- Stdev Latency 193.99ms 346.67ms 1.86s 87.16% Req/Sec 331.23 1.05k 6.59k 94.97% Latency Distribution 50% 8.35ms 75% 279.98ms 90% 654.18ms 99% 1.61s 6564 requests in 10.01s, 5.34MB read Socket errors: connect 0, read 0, write 0, timeout 83 Requests/sec: 655.87 Transfer/sec: 546.72KB # Test 8080 port performance [root@local_deploy_192-168-1-5 ~]# wrk --latency -c 100 -t 2 --timeout 2 http://124.71.83.217:8080/ Running 10s test @ http://124.71.83.217:8080/ 2 threads and 100 connections Thread Stats Avg Stdev Max +/- Stdev Latency 311.29ms 398.66ms 1.94s 83.58% Req/Sec 179.02 147.02 1.00k 93.50% Latency Distribution 50% 57.17ms 75% 463.84ms 90% 827.38ms 99% 1.69s 3569 requests in 10.01s, 2.91MB read Socket errors: connect 0, read 0, write 0, timeout 31 Requests/sec: 356.63 Transfer/sec: 297.52KB ## # As can be seen from the above two outputs, the average delay of the official Nginx (listening on port 80) is 193.99ms| # The average delay of Nginx (listening on port 8080) is 311.29ms ## Combine above hping3 The output is easy to find, case Nginx The latency increases a lot under concurrent requests. What's going on? -
Use tcpdump to capture the received and sent network packets, and analyze whether there are problems in the network receiving and sending process
In terminal 1, execute the following tcpdump command to grab the network packets sent and received on port 8080 and save them to nginx Pcap fileroot@alnk:~# tcpdump -nn tcp port 8080 -w nginx.pcap
-
In terminal 2, re execute the wrk command
[root@local_deploy_192-168-1-5 ~]# wrk --latency -c 100 -t 2 --timeout 2 http://124.71.83.217:8080/
-
When the wrk command ends, switch back to terminal 1 again and press Ctrl+C to end the tcpdump command
Then, grab the nginx Pcap, copy it to the machine equipped with Wireshark, and open it with Wireshark
Due to the large number of network packets, you can filter them first
For example, after selecting a package, you can right-click and select "Follow" - > "TCP Stream", as shown in the following figure
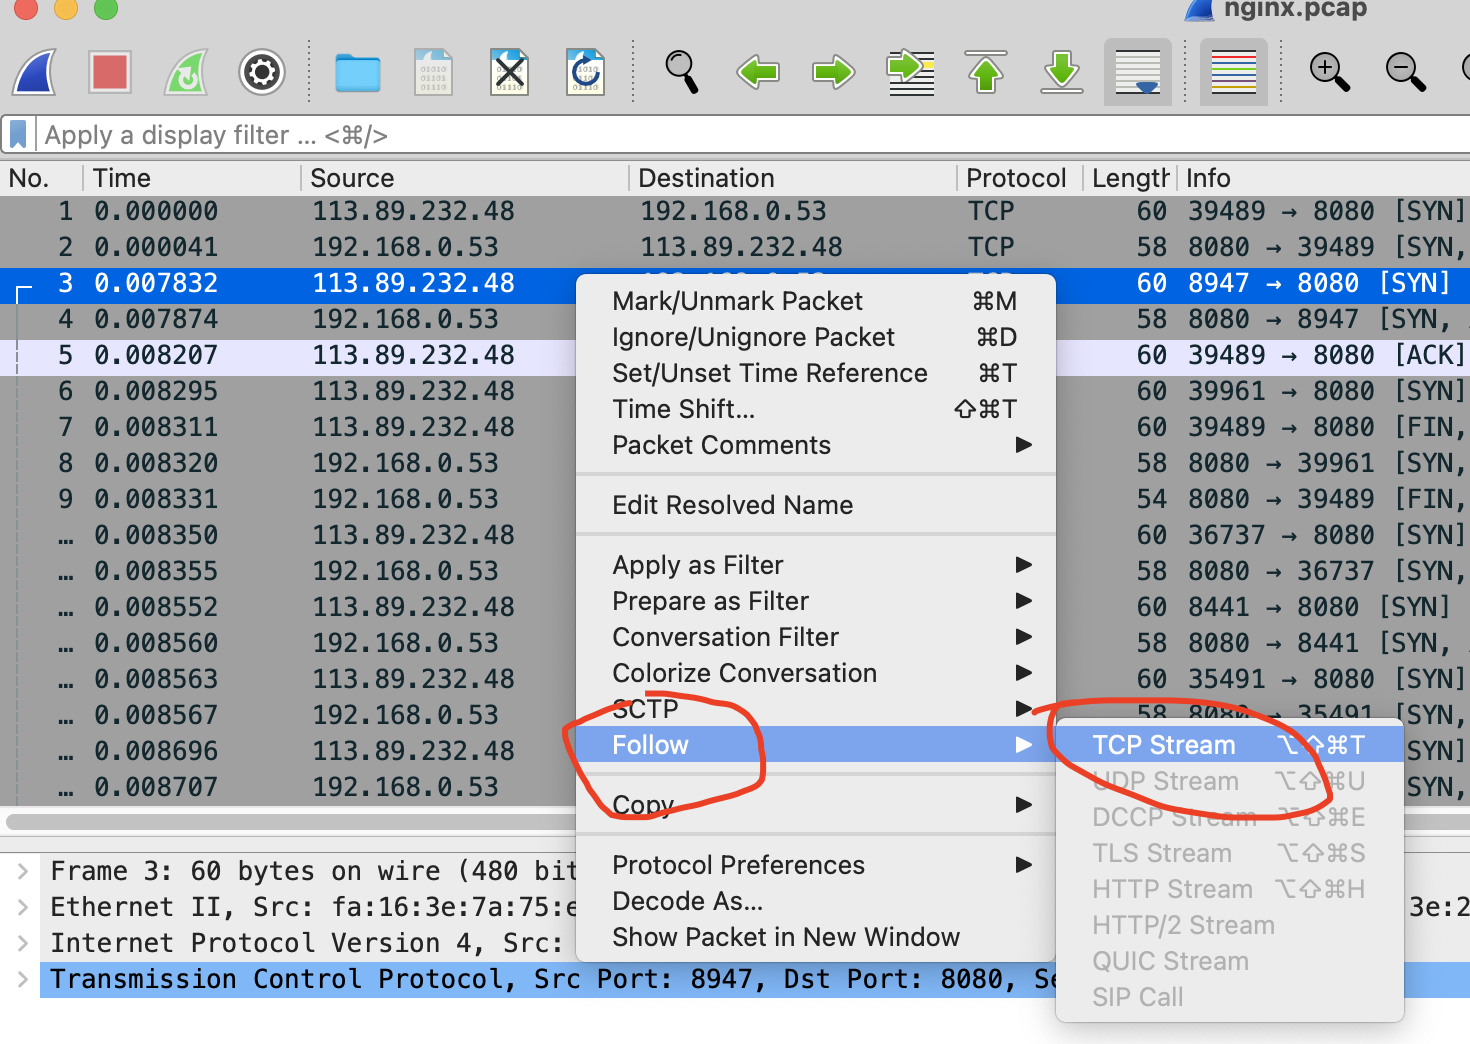
Then, close the pop-up dialog box and return to the Wireshark main window,
At this time, you will find that Wireshark has automatically set a filter expression TCP stream eq 24
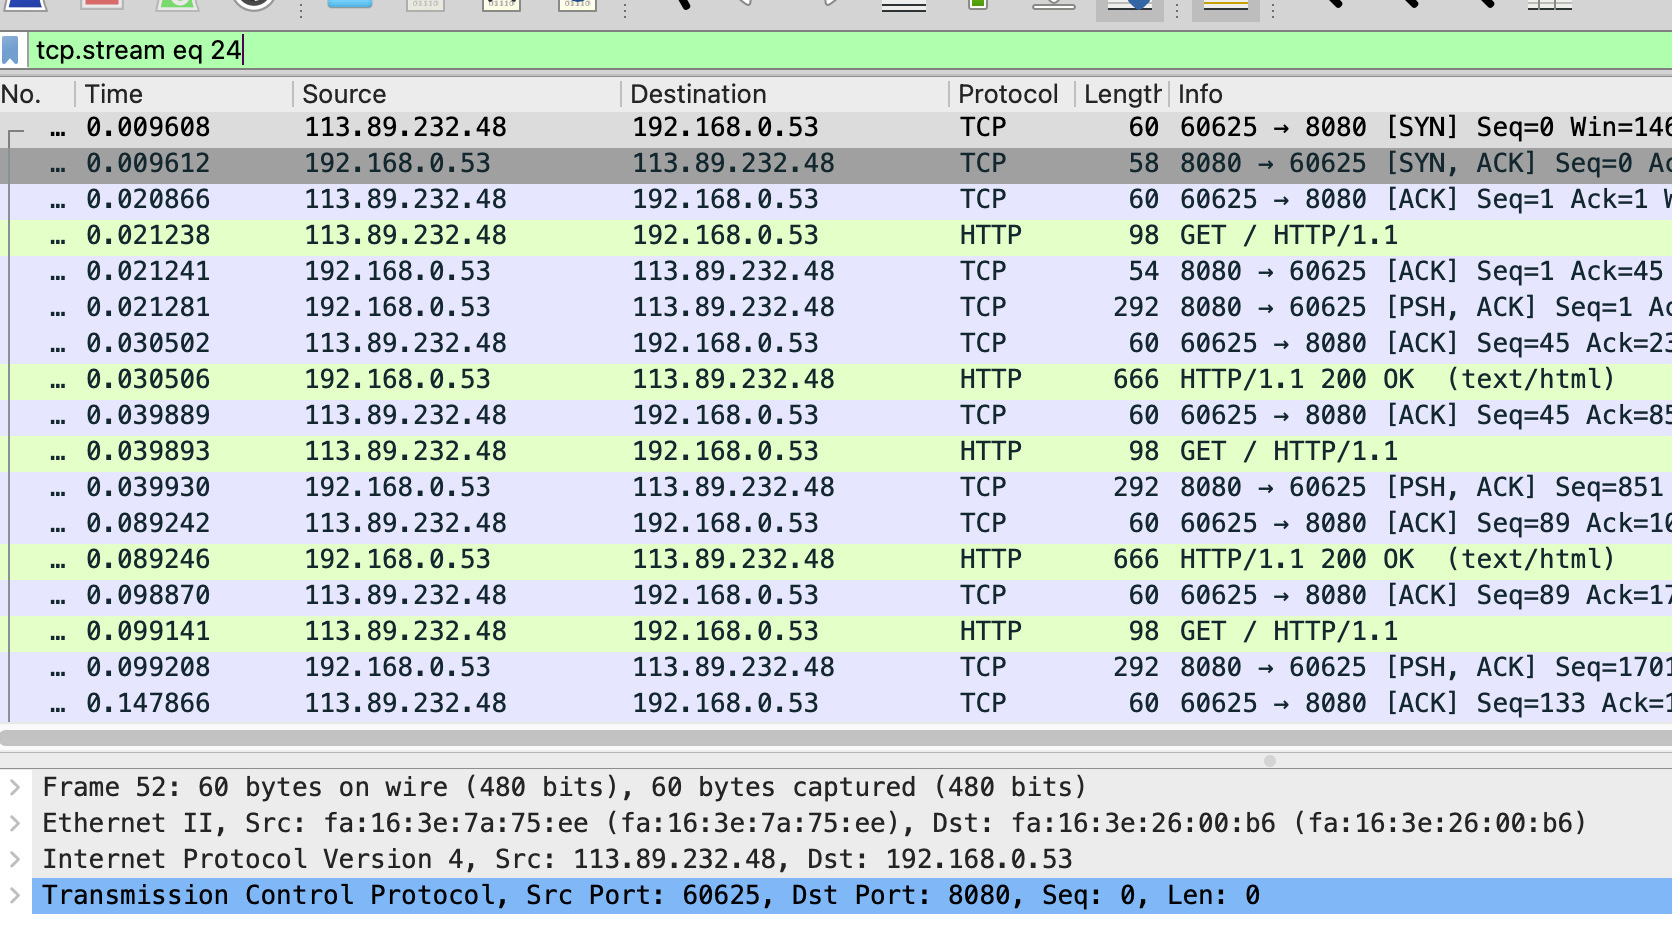
You can see each request and response of the TCP connection from three handshakes. Of course, this may not be intuitive enough
You can continue to click Statistics - > flow graph in the menu bar
Select "Limit to display filter" and set the Flow type to "TCP Flows"
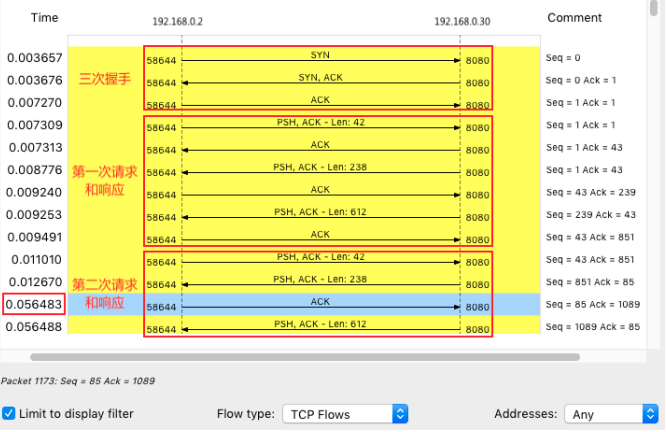
Note that the client is on the left and the Nginx server is on the right
As can be seen from this figure, the first three handshakes and the first HTTP request and response are still very fast
However, the second HTTP request is slow. In particular, the client sends an ACK response 40 ms after receiving the first packet from the server
Do you think of anything when you see the value of 40ms? In fact, this is the minimum timeout for TCP delayed ackThis is an optimization mechanism for TCP ACK, that is, you don't have to send an ACK every request
Instead, wait for a while (e.g. 40ms) to see if there is a "free ride"
If there are other packets to be sent during this period, send them with ACK
Of course, if you can't wait for other packets, send an ACK separately after timeout
Because 40ms occurred on the client in this case, it is reasonable to suspect that the client started the delayed confirmation mechanism
The client here is actually the wrk running earlierQuery the TCP document (execute man tcp) and find that the quick confirmation mode is enabled only when TCP_QUICKACK is specially set for the TCP socket
Otherwise, by default, the delayed confirmation mechanism is adoptedTo verify the conjecture and confirm the behavior of wrk, you can use strace to observe which TCP options wrk sets for sockets
-
In terminal 2, execute the following command
[root@local_deploy_192-168-1-5 ~]# strace -f wrk --latency -c 100 -t 2 --timeout 2 http://124.71.83.217:8080/
[pid 32138] setsockopt(5, SOL_TCP, TCP_NODELAY, [1], 4) = 0
As you can see, wrk only sets TCP_NODELAY option without setting TCP_QUICKACK
This shows that wrk adopts delayed acknowledgement, which explains the above 40ms problemBut don't forget that this is just the behavior of the client. Normally, the Nginx server should not be affected by this behavior
Did you miss any clues when analyzing network packets? Go back to Wireshark and look again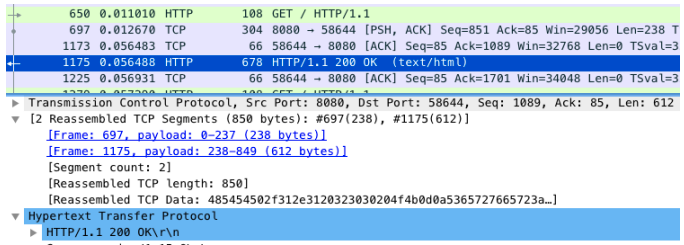
Carefully observe the Wireshark interface. Packet 1173 is the delayed ACK packet just mentioned
1175 in the next line is the second packet sent by Nginx
It is combined with package 697 to form a complete HTTP response (the ACK number is 85)The second packet is not sent together with the previous packet No. 697, but is not sent until No. 1173 after the client's ACK to the first packet
This looks a bit like delayed acknowledgement, but instead of ACK, it sends dataI think of something here -- Nagle algorithm
Before further analyzing the case, briefly introduce the algorithmNagle algorithm is an optimization algorithm used to reduce the number of small packets sent in TCP protocol in order to improve the utilization of actual bandwidth
For example, when the payload is only 1 byte, plus 20 bytes occupied by TCP header and IP header respectively, the whole network packet is 41 bytes
In this way, the actual bandwidth utilization is only 2.4% (1 / 41)
Generally speaking, if the whole network bandwidth is occupied by such small packets, the effective utilization rate of the whole network is too low
Nagle algorithm is to solve this problem
It improves the utilization of network bandwidth by merging TCP packets
Nagle algorithm stipulates that there can be at most one unconfirmed incomplete packet on a TCP connection
No other packets will be sent until the ACK of this packet is received
These small packets will be combined and sent out with the same packet after receiving the ACKObviously, the idea of Nagle algorithm itself is very good, but after knowing the default delay confirmation mechanism of Linux
I don't think so, because when they are used together, the network delay will be obvious. As shown in the figure below
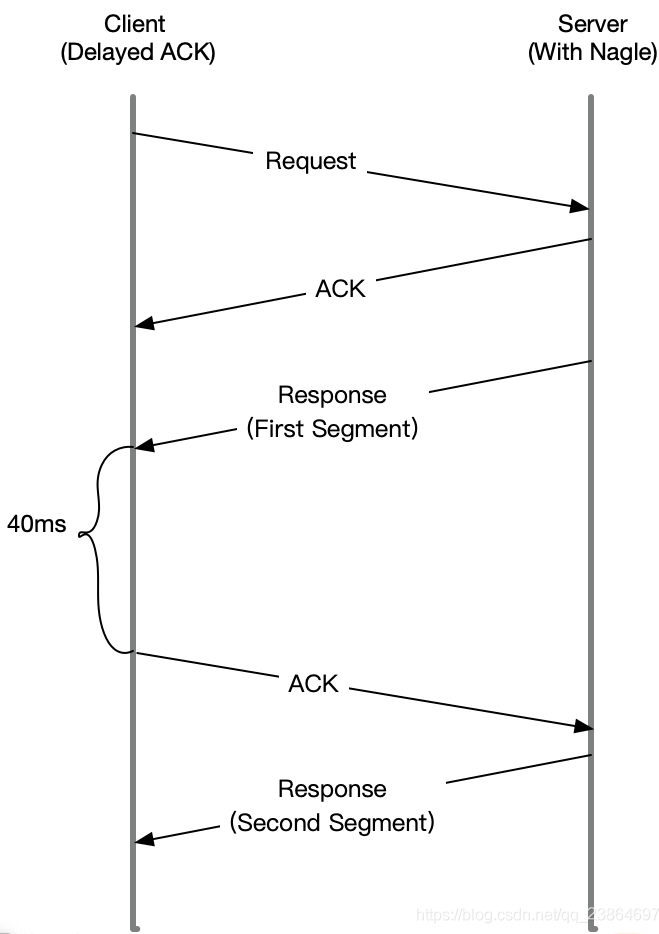
After Sever sends the first packet, because the Client turns on delayed confirmation, it needs to wait 40ms before replying to ACK
At the same time, since Nagle is enabled on the Server side, and the ACK of the first packet has not been received at this time, the Server will be waiting here all the time
The Client will not reply to the ACK until 40ms timeout, and then the Server will continue to send the second packetSince it may be Nagle's problem, how do you know if the case Nginx has opened Nagle?
Query the tcp document and you will know that only tcp is set_ The Nagle algorithm is disabled only after nodelay
So just check the TCP of Nginx_ The nodelay option is OK
-
In terminal 1, execute the following command to view the configuration of the case Nginx
root@alnk:~# docker exec nginx cat /etc/nginx/nginx.conf | grep tcp_nodelay tcp_nodelay off; ## # Sure enough, I saw the TCP of the case Nginx_ Nodelay is off. Setting it to on should solve the problem ## # Is the problem solved after the change? Naturally, it needs to be verified # The modified application has been packaged into the Docker image. Execute the following command in terminal 1 to start it # Delete case application root@alnk:~# docker rm -f nginx # Start optimized application root@alnk:~# docker run --name nginx --network=host -itd feisky/nginx:nodelay -
Terminal 2, re execute wrk test delay
root@alnk:~# wrk --latency -c 100 -t 2 --timeout 2 http://124.71.83.217:8080/
Running 10s test @ http://192.168.0.30:8080/
 2 threads and 100 connections
 Thread Stats Avg Stdev Max +/- Stdev
 Latency 9.58ms 14.98ms 350.08ms 97.91%
 Req/Sec 6.22k 282.13 6.93k 68.50%
 Latency Distribution
 50% 7.78ms
 75% 8.20ms
 90% 9.02ms
 99% 73.14ms
 123990 requests in 10.01s, 100.50MB read
Requests/sec: 12384.04
Transfer/sec: 10.04MB
##
# Sure enough, the delay has been reduced to 9ms, which is the same as the official Nginx image tested
# Nginx turns on TCP by default_ Nodelay
-
Terminal I, stop case
root@alnk:~# docker rm -f nginx good
Summary
Today, I learned the analysis method after the network delay increases
Network delay is the core network performance index
Due to the influence of network transmission, network packet processing and other factors, network delay is inevitable
However, excessive network delay will directly affect the user experience
Therefore, after finding that the network delay increases, you can use traceroute, hping3, tcpdump, Wireshark, strace and other tools
To locate potential problems in the network
- Use hping3, wrk and other tools to confirm whether the network delay of single request and concurrent request is normal
- Use traceroute to confirm whether the route is correct and check the delay of each hop gateway in the route
- Use tcpdump and Wireshark to confirm whether the network packet is sent and received normally
- Use strace, etc. to observe whether the application calls the network socket normally
In this way, you can check layer by layer from routing, sending and receiving network packets, and then to applications, until you locate the root cause of the problem