The source of this paper is: http://www.cnblogs.com/wy123/p/6835939.html
What is waiting
Briefly explain what waiting is:
When an application initiates a Session request to SQL Server, the Session request requests the required resources during execution in the database.
For example, you may apply for memory resources, locks on tables, physical IO resources, network resources, etc.
If some resources that need to be applied for in the current Session run process cannot be satisfied immediately, there will be waiting.
SQL Server will present this waiting information in an unused way, such as the waiting information of the active Session, the waiting information at the instance level, and so on.
In SQL Server, waiting event is one of the important reference information for DBA to Trouble Shooting. In SQL Server, waiting information can be acquired in many ways.
However, for versions before SQL Server 2016, there is limited reference value for active Session-level and instance-level waiting.
More often than not, waiting that is more detailed and can be analyzed afterwards requires the collection of waiting information generated by previously executed Sessions, i.e. the historical record of specific Sessions waiting information.
This article focuses on the use of extended events to capture waiting information, but not on the use of extended events themselves, focusing on how to use extended events to obtain the desired waiting event information.
You need to have some knowledge of extended events.
Waiting for access to information
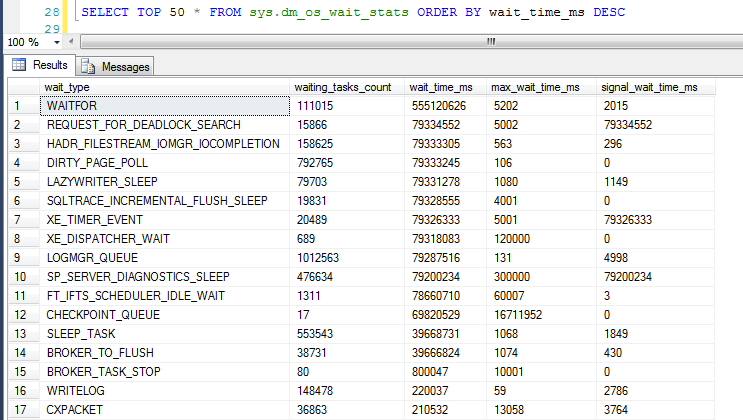
In SQL Server, there is a system view sys.dm_os_wait_stats that records the waiting information accumulated since the start of the database service.
As shown below, this result is at the instance level, which is the accumulation of all waiting events recorded throughout the database server.
Most of the time, the reference is not very meaningful. For example, the network delay on a certain day is very high. A large number of ASYNC_NETWORK_IO waiting information is recorded in sys.dm_os_wait_stats.
But by the next day or when, the network will be better, but the ASYNC_NETWORK_IO waiting information recorded in sys.dm_os_wait_stats will remain unchanged.
That is to say, sys.dm_os_wait_stats cannot reflect the real-time waiting situation.
Of course, it is also simple to obtain real-time waiting information. Recording the difference of waiting time between sys.dm_os_wait_stats can indirectly reflect the waiting information of data in a certain period of time.
However, this information is still relatively rough, still at the instance level, and sometimes it is still insufficient for reference.
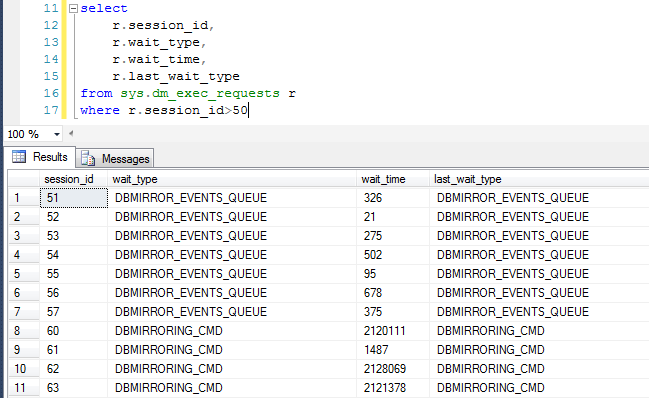
The other is to obtain waiting information of active Session through wait_type, wait_time, etc. of sys.dm_exec_requests, which is the system view.
For example, the screenshot, but this is the information of the active Session. When the Session is completed, the waiting information can not see how long the waiting has been generated.
That is to say, you can't trace back to what kind of waiting happened in the execution of a Session or a stored procedure in history, and how long it took.
To be honest, whether sys.dm_os_wait_stats or sys.dm_exec_requests, under normal circumstances, the practical value of the waiting information obtained is not high or the applicable scenarios are limited.
More often than not, we want a more detailed level of waiting, such as waiting information generated during the execution of a certain Login, a certain part of Session, or even some specific SQL (stored procedure).
For example, 10 logins in the database are accessed by 10 different applications. Only one of them has feedback that accessing the database is slow or has performance problems, and all other logins have normal feedback.
It's very likely that this Login requests its own problem, and then it needs to be targeted at the case of this Login, rather than at the instance level for analysis and diagnosis.
If we can get the waiting information of the Session of the Login execution, or the waiting information in the execution process of some specific database objects of the Login, the positioning problem will be more pertinent.
This article takes this as a starting point, and explains and demonstrates how to obtain the waiting information at Session level.
Getting Session Level Waiting Information in SQL Server 2016
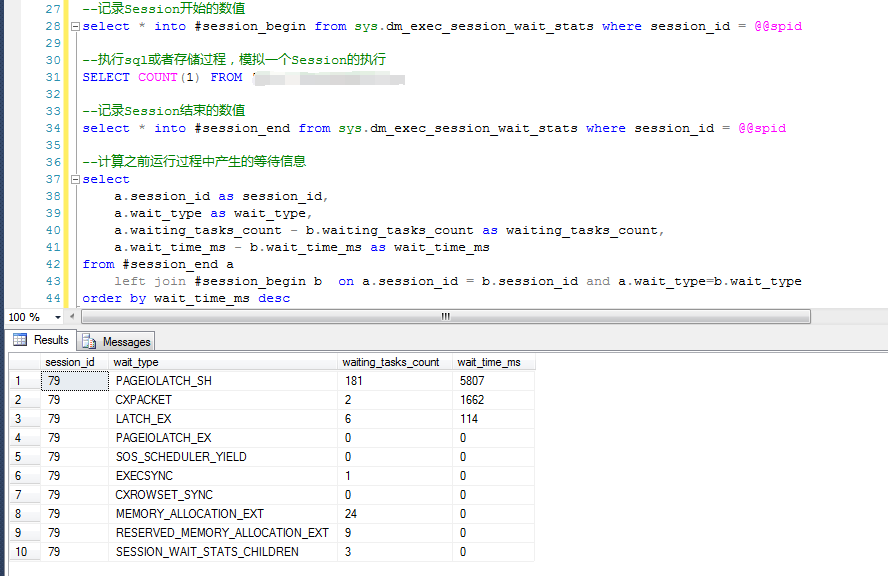
In SQL Server 2016, it is convenient to obtain waiting information at Session level, which can be used with a direct system view sys.dm_exec_session_wait_stats.
In the current situation, it's easy to know the waiting information for a Session.
Record the waiting information for the current Session at the beginning of the sql statement
Record the current Session's waiting information again at the end of the sql statement
By calculating the difference between the two waiting messages, we can know which and how many waiting times are there in the current Session running process.
The SQL Server development team may also realize that waiting for information, more often than not, requires more specific waiting than a general instance-level waiting
Therefore, in SQL Server 2016, sys.dm_exec_session_wait_stats, a view supporting statistical Session level wait, has been added.
Unfortunately, in previous versions of SQL Server before 2016, there was no system view that could easily record Session-level waiting.
But similar functions can be achieved by extending events.
Use extended events to capture wait information at Session level
Because this is achieved by extending events, readers are required to have a basic understanding of the extended events, and the extended events themselves are not much to say.
Up to the code, start an extended event to record the execution time of more than three seconds of SQL statements, the execution process of waiting time is greater than 0 waiting event information.
Of course, this information can be captured with various filtering conditions. Specific reference code notes.
IF EXISTS(SELECT * FROM sys.server_event_sessions WHERE name='CollectionSessionWaitStats')
  DROP EVENT session CollectionSessionWaitStats ON SERVER;
GO

--  Create event sessions
CREATE EVENT SESSION CollectionSessionWaitStats ON SERVER
ADD EVENT sqlserver.rpc_completed
(
    ACTION
    (
        sqlos.task_time,
        sqlserver.database_name,
        sqlserver.nt_username,
        sqlserver.username,
        sqlserver.sql_text,
        sqlserver.session_id,
        sqlserver.transaction_id
    )  WHERE [duration]>=3000000
),
ADD EVENT sqlserver.sql_batch_completed
(
    ACTION
    (
        sqlos.task_time,
        sqlserver.database_name,
        sqlserver.nt_username,
        sqlserver.username,
        sqlserver.sql_text,
        sqlserver.session_id,
        sqlserver.transaction_id
    ) WHERE [duration]>=3000000
),
ADD EVENT sqlos.wait_info
(
    ACTION
    (
        sqlos.task_time,
        sqlserver.database_name,
        sqlserver.nt_username,
        sqlserver.sql_text,
        sqlserver.username,
        sqlserver.session_id,
        sqlserver.transaction_id
    ) WHERE  session_id>50
            and opcode=1
            and duration>0
            and sql_text not like '%sp_MScdc_capture_job%' --Exclude certain information
            --and username = '' --Restrict recording only certain information
),
ADD EVENT sqlos.wait_info_external
(
    ACTION
    (
        sqlos.task_time,
        sqlserver.database_name,
        sqlserver.nt_username,
        sqlserver.username,
        sqlserver.sql_text,
        sqlserver.session_id,
        sqlserver.transaction_id
    ) WHERE   session_id>50
            and opcode=1
            and duration>0
            and sql_text not like '%sp_MScdc_capture_job%'
            --and username = ''
)
ADD TARGET package0.event_file
(
    SET filename=N'D:\XEventFiles\CollectionSessionWaitStats',
    max_file_size=(1024),
    max_rollover_files=(10)
)
WITH (
        MAX_MEMORY=4096 KB,
        EVENT_RETENTION_MODE=ALLOW_SINGLE_EVENT_LOSS,
        MAX_DISPATCH_LATENCY=30 SECONDS,
        MAX_EVENT_SIZE=0 KB,
        MEMORY_PARTITION_MODE=NONE,
        TRACK_CAUSALITY=OFF,
        STARTUP_STATE=ON
    )
GO

--  Enable (Stop) Event Session( START / STOP)
ALTER EVENT SESSION CollectionSessionWaitStats ON SERVER STATE=START
GO
Waiting information at the Session level collected with extended events has the following characteristics
1. SessionId is repeatable
For example, a SessionId = 80 Session can execute an SQLA for the first time and an SQLB for the second time.
At the same time, both the execution of these two SQL s and the waiting information generated during their execution can be captured.
2. It is impossible to execute the same SessionId at the same time.
For example, between 16:46:36 and 16:46:46 seconds, SessionId = 80 Session is executing, and the extended event captures the waiting information it generates.
But in the period from 16:46:36 seconds to 16:46:46 seconds, it is impossible for another SessionId = 80 to be executed, which is not difficult to understand.
Why should we specifically explain this problem?
Because there is no direct correspondence between the SQL statement completion event (rpc_completed or sql_batch_completed) and the generated waiting in the event information collected by the extended event.
How to understand? Start to find the problem, I was this tangle for most of the day, screenshots illustration.
In the following screenshot, the SessionId of the two target events captured by the extended event is 58, but the execution of the SQL is different.
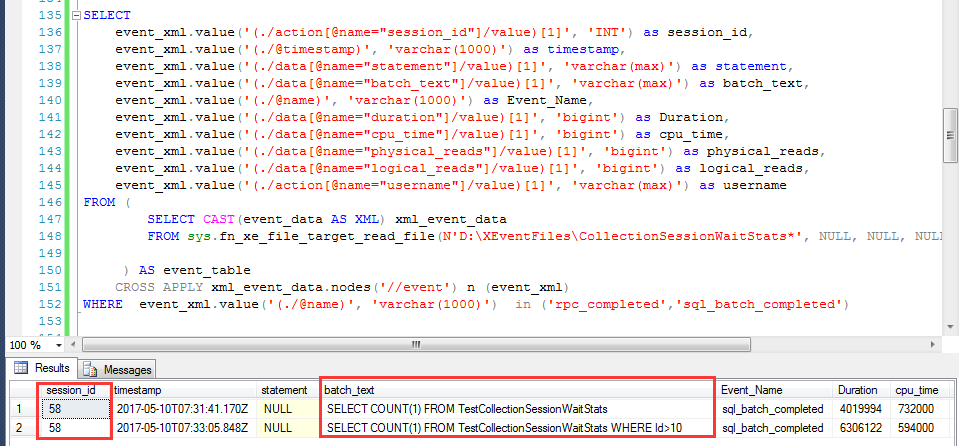
The following screenshot shows all the event information captured without distinguishing between event types.
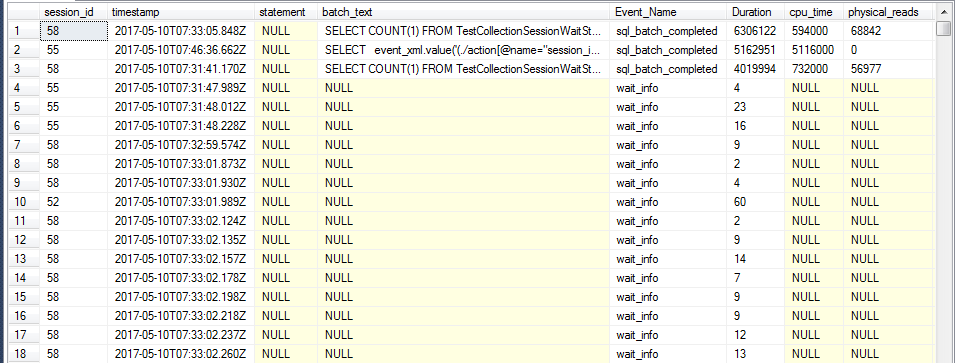
That is to say, for Session 58:
First run SELECT COUNT (1) FROM Test Collection Session WaitStats
The second run of SELECT COUNT (1) FROM Test Collection Session WaitStats WHERE Id > 10
The problem of consistency or inconsistency between two runs of SQL is not too big. The key is that the confidence of waiting event is 58. How to distinguish which runs the generated event belongs to?
For example, Session 58 runs sql twice and produces 10 waiting messages. How to distinguish which of these 10 waiting messages belongs to the first run and which belongs to the second run?
This depends on the second point mentioned above: "In the same time period, the same SessionId can not be executed at the same time."
For the same SessionId, in the sql_batch_completed event, from the time dimension
Less than the completion time of the first sql_batch_completed event is necessarily generated by the first execution of Session 58
If the completion event is greater than the first sql_batch_completed event and smaller than the second sql_batch_completed event, it must be generated by the second execution of Session 58.
With this theoretical basis, it is easier for us to count the waiting of Session level, and we believe that the realization of this logic is not difficult.
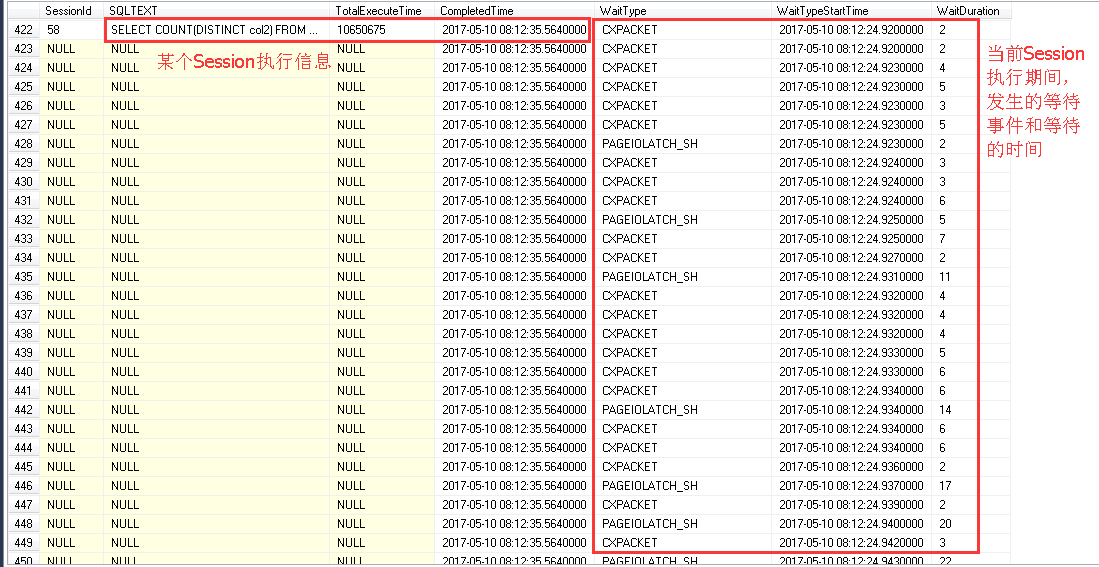
The following figure shows the waiting details generated by Session 58 executing an SQL statement. You can see that CXPACKET and PAGEIOLATCH_SH wait were generated many times.
Given the screenshot problem, here's another waiting information captured by another SQL execution of Session 58
This statistic is mentioned above. In two sql_batch_completed events, although the SessionId waiting for the event is the same,
But it happens before the sql_batch_completed of the current event and after the last sql_batch_completed,
This perfectly matches the sql_batch_completed event with its corresponding wait_info event.
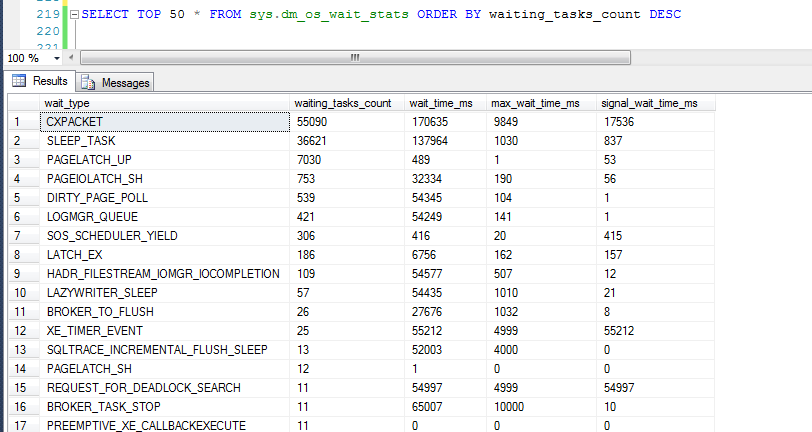
In this case, it is not difficult to get results similar to sys.dm_os_wait_stats in SQL Server 2016.
Compared with the result of sys.dm_os_wait_stats waiting for information, is the waiting information obtained by extended events more detailed and specific?
For example, for CXPACKET wait time,
It is not difficult to find that if you calculate the number of times it is generated (count), it is similar to waiting_tasks_count in sys.dm_os_wait_stats, and calculating the total time it produces (sum) is similar to waiting_time_ms.
However, the above time information has been refined to the Session level, which is more valuable than the waiting information in sys.dm_os_wait_stats.
Diagnosis and analysis of problems will also be more effective.
SQL statements for the above statistics
-- Parse the XML to show rpc_completed,sql_batch_completed details
if object_id('tempdb..#t1') is not null
    drop table #t1
SELECT
    event_xml.value('(./action[@name="session_id"]/value)[1]', 'INT') as session_id,
    event_xml.value('(./@timestamp)', 'varchar(1000)') as timestamp,
    event_xml.value('(./data[@name="statement"]/value)[1]', 'varchar(max)') as statement,
    event_xml.value('(./data[@name="batch_text"]/value)[1]', 'varchar(max)') as batch_text,
    event_xml.value('(./@name)', 'varchar(1000)') as Event_Name,
    event_xml.value('(./data[@name="duration"]/value)[1]', 'bigint') as Duration,
    event_xml.value('(./data[@name="cpu_time"]/value)[1]', 'bigint') as cpu_time,
    event_xml.value('(./data[@name="physical_reads"]/value)[1]', 'bigint') as physical_reads,
    event_xml.value('(./data[@name="logical_reads"]/value)[1]', 'bigint') as logical_reads,
    event_xml.value('(./action[@name="username"]/value)[1]', 'varchar(max)') as username
INTO #t1
FROM (
        SELECT CAST(event_data AS XML) xml_event_data
        FROM sys.fn_xe_file_target_read_file(N'D:\XEventFiles\CollectionSessionWaitStats*', NULL, NULL, NULL)

     ) AS event_table
CROSS APPLY xml_event_data.nodes('//event') n (event_xml)
WHERE event_xml.value('(./@name)', 'varchar(1000)')  in ('rpc_completed','sql_batch_completed')
order by Event_Name


-- Parse the XML to show wait_info,wait_info_external details
if object_id('tempdb..#t2') is not null
    drop table #t2
SELECT
    cast(event_xml.value('(./@timestamp)', 'varchar(1000)') as DATETIME2) as timestamp,
    event_xml.value('(./data[@name="duration"]/value)[1]', 'bigint') as duration,
    event_xml.value('(./action[@name="session_id"]/value)[1]', 'INT') as session_id,
    event_xml.value('(./data[@name="wait_type"]/text)[1]', 'VARCHAR(200)') as wait_type
INTO #t2
FROM (
        SELECT CAST(event_data AS XML) xml_event_data
        FROM sys.fn_xe_file_target_read_file(N'D:\XEventFiles\CollectionSessionWaitStats*', NULL, NULL, NULL)
     ) AS event_table
     CROSS APPLY xml_event_data.nodes('//event') n (event_xml)
WHERE event_xml.value('(./@name)', 'varchar(1000)')  in ('wait_info','wait_info_external')


if object_id('tempdb..#t3') is not null
    drop table #t3

SELECT
    a.session_id                    AS SessionId,
    isnull(statement,batch_text)    AS SQLTEXT,
    a.Duration                        AS TotalExecuteTime,
    CAST(a.timestamp AS DATETIME2)    AS CompletedTime,
    CAST(b.timestamp AS DATETIME2)    AS WaitTypeStartTime,
    b.wait_type                        AS WaitType,
    b.duration                        AS WaitDuration
INTO #t3
FROM #t1 a INNER JOIN #t2 b on a.session_id = b.session_id
    and b.timestamp < a.timestamp
    and b.timestamp>(
                         select top 1 timestamp from #t1 c
                         where a.session_id = a.session_id and a.timestamp > b.timestamp
                         order by a.timestamp
                    )

select
    case when rn = 1 then SessionId else NULL end as SessionId,
    case when rn = 1 then SQLTEXT else NULL end as SQLTEXT,
    case when rn = 1 then TotalExecuteTime else NULL end as TotalExecuteTime,
    CompletedTime as CompletedTime,
    WaitType,
    WaitTypeStartTime as WaitTypeStartTime,
    WaitDuration
from
(
    select ROW_NUMBER()over(partition by SessionId,SQLTEXT,TotalExecuteTime,CompletedTime order by CompletedTime,WaitTypeStartTime) as rn,
    * FROM #t3
)t
Of course, this statement is only for reference, the purpose is to collect statistical information at the Session level. When the statistical information at the Session level is collected, the specific statistical method is not difficult.
summary
Waiting events can help us to diagnose some resource bottlenecks on SQL Server, which has important reference significance for problem handling and solving. If we can collect waiting events in detail, it will be more significant for problem solving.
Through a simple example, this paper uses extended events to collect waiting information in some specific scenarios in SQL Server, so as to diagnose and identify the problem more pertinently, and make the analysis of the problem more efficient and pertinent.