Using elk Stack to collect k8s platform logs for kubernetes operations and maintenance
Catalog:
- Which logs to collect
- elk Stack Logging Scheme
- How to collect logs in containers
- Application Log Collection in k8S Platform
I. What logs are collected?
* Component logs for k8s systems such as those under kubectl get cs
controller-manager,scheduler,apiserver on master node
kubelet,kube-proxy on node
* Application logs deployed in k8s Cluster
- standard output
- log file
elk Stack log scheme, how to collect these logs?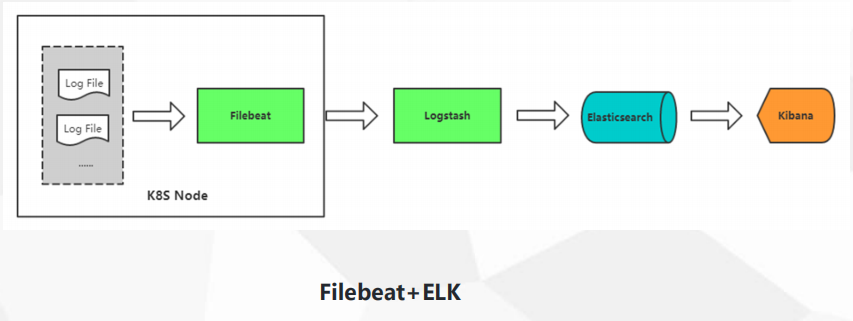
Elastic search is a JSON-based distributed search and analysis engine, which can search quickly.
kibban is mainly used to display ES data.
Beats is a platform for lightweight collectors, that is to say, there are many components in it to collect data in different application scenarios.
Logstach is a pipeline for dynamic data collection. It mainly filters and analyses data and formats it into ES.
Here a data stream is formed, the preferred is Beats, followed by Logstach, followed by ES, followed by kibana, so the technology stack is very perfect. There are many components in beats series, such as collecting network data, collecting log files, collecting windos events, collecting running time. elk stack can not only collect data logs, but also collect performance resource indicators, such as CPU, memory and network. Filebeat is mainly used here. Collect log files. Monitoring is done professionally, such as prometheus.
In other words, how do I collect the logs of containers?
Solution 1: Deploy a log collector on Node
Deploy the log collector in DaemonSet mode
For this node / var/log and / var/lib/docker/containers/
Log collection in two directories
Container log directories in Pod are mounted on the host unified directory
That is my-pod is the container, and then the standard input and output is to the console. In time, this is taken over by docker, and it falls into a specific file. docker will take over the standard output and standard error output, and then write to a log, where a log collection agent will be set up to collect the log, and this is the case. A diagram, which roughly means that you deploy a log collector on each node, and then collect pod logs. The directory of standard input and output, by default, is under / var/lib/docker/containers / This is the read and write layer running the current container, which contains a log, usually mounted to the distribution. It's not very convenient to mount to the host's directory, and it's necessary to distinguish all the containers. If you use distributed storage, such as a pod, to store the volume of the log directly,
It's better to mount it in the startup container in the container, and hang the volume on each one, and eventually fall on it.

Solution 2: Containers for additional dedicated log collection in Pod
Add a log to each Pod running the application
Collecting containers, using emtyDir to share log directories
Log collector reads.
The second is a sidecar model, which is to add a container to your sidecar model to handle the things you want. This is called a bypass. That is to say, next to your current business, you add a container to handle your business logs. That is to say, you use emtyDir to make container A write the log directory. To share in this directory, that is, in the shared directory, that is, in the host directory, and then container B reads and mounts the volume, it can also naturally read the contents of the current volume, so in this case, add a Pod to get the log.

Solution 3: Application push logs directly
Beyond Kubernetes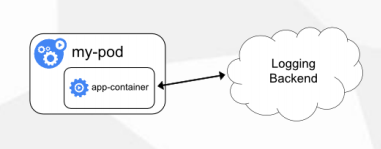
This small company will have some, but not many, that is, the application program in the code to modify, directly pushed to your remote storage, no longer output to the console, local files, directly pushed, this will no longer be within the scope of k8s, this scheme is not used much, the most used is the first two.
What are the advantages and disadvantages of these two schemes?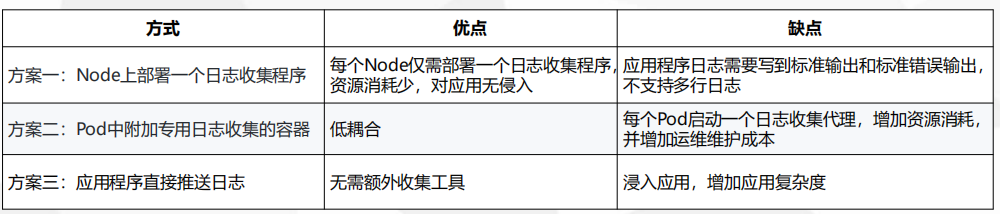
For example, the first scheme is to deploy a log collection agent on each node, which consumes less resources and generally does not require the intervention of the application, but it needs to write to standard output and standard error output through the application, such as tomcat. There are many rows in the log, which need to be merged into one line to collect. Set, need to be converted into json format, json in the docker has many lines separated, so can not use multi-line matching, so it is embarrassing.
For example, the second scheme is to attach a container for special log collection to each application, and add a mirror to each pod. This method is low coupling and has shortcomings. Obviously, you deploy an application, add a collector, deploy another collector, that is, you need to start up. A set of projects, need to add a container, that is, the consumption of resources, and increase the maintenance costs of operation and maintenance, but the cost of operation and maintenance is also good, mainly increase the consumption of resources is larger.
The third option is to let development change.
We use the second option, and add one. This is still a better way to achieve.
At present, we use fileBeat to collect logs. In the early days, logstach is used to collect logs. Logstach takes up a lot of resources. It's written in java. Filebeat is written in Go. It takes up less resources. It takes up a large amount of data in java, and then it consumes a lot of bars. So later, the official will collect logstach. The functionality is stripped out and a filebeat is rewritten using GO, all of which are now recommended to use fileBeat.
This fek is filebeat, that is to deploy filebeat, which starts with support for k8s. At present, this is suitable for smaller data volume, yaml written by oneself. If your data volume reaches 20-30g or more, the es of this stand-alone machine is certainly very difficult to satisfy. If your log volume is large, it is not recommended that you deploy elk to k8s. It is recommended that you deploy your logstack, es, storage outside of k8s, especially es. It is suggested that you deploy outside of cluster, physical machine to component cluster, kibana can be deployed in k8s, but es is a stateful deployment.
[root@k8s-master elk]# ls
fek  k8s-logs.yaml  nginx-deployment.yaml  tomcat-deployment.yaml
[root@k8s-master elk]# ls
fek  k8s-logs.yaml  nginx-deployment.yaml  tomcat-deployment.yaml
[root@k8s-master elk]# cd fek/
[root@k8s-master fek]# ls
elasticsearch.yaml  filebeat-kubernetes.yaml  kibana.yaml
[root@k8s-master fek]# cat filebeat-kubernetes.yaml
---
apiVersion: v1
kind: ConfigMap
metadata:
  name: filebeat-config
  namespace: kube-system
  labels:
    k8s-app: filebeat
data:
  filebeat.yml: |-
    filebeat.config:
      inputs:

        path: ${path.config}/inputs.d/*.yml

       reload.enabled: false
      modules:
        path: ${path.config}/modules.d/*.yml
        reload.enabled: false
    output.elasticsearch:
      hosts: ['${ELASTICSEARCH_HOST:elasticsearch}:${ELASTICSEARCH_PORT:9200}']
---
apiVersion: v1
kind: ConfigMap
metadata:
  name: filebeat-inputs
  namespace: kube-system
  labels:
    k8s-app: filebeat
data:
  kubernetes.yml: |-
    - type: docker
      containers.ids:
      - "*"
      processors:
        - add_kubernetes_metadata:
            in_cluster: true
---
apiVersion: extensions/v1beta1
kind: DaemonSet
metadata:
  name: filebeat
  namespace: kube-system
  labels:
    k8s-app: filebeat
spec:
  template:
    metadata:
      labels:
        k8s-app: filebeat
    spec:
      serviceAccountName: filebeat
      terminationGracePeriodSeconds: 30
      containers:
      - name: filebeat
        image: elastic/filebeat:7.3.1
        args: [
          "-c", "/etc/filebeat.yml",
          "-e",
        ]
        env:
        - name: ELASTICSEARCH_HOST
          value: elasticsearch
        - name: ELASTICSEARCH_PORT
          value: "9200"
        securityContext:
          runAsUser: 0
        resources:
          limits:
            memory: 200Mi
          requests:
            cpu: 100m
            memory: 100Mi
        volumeMounts:
        - name: config
          mountPath: /etc/filebeat.yml
          readOnly: true
          subPath: filebeat.yml
        - name: inputs
          mountPath: /usr/share/filebeat/inputs.d
          readOnly: true
        - name: data
          mountPath: /usr/share/filebeat/data
        - name: varlibdockercontainers
          mountPath: /var/lib/docker/containers
          readOnly: true
      volumes:
      - name: config
        configMap:
          defaultMode: 0600
          name: filebeat-config
      - name: varlibdockercontainers
        hostPath:
          path: /var/lib/docker/containers
      - name: inputs
        configMap:
          defaultMode: 0600
          name: filebeat-inputs
      - name: data
        hostPath:
          path: /var/lib/filebeat-data
          type: DirectoryOrCreate
---
apiVersion: rbac.authorization.k8s.io/v1beta1
kind: ClusterRoleBinding
metadata:
  name: filebeat
subjects:
- kind: ServiceAccount
  name: filebeat
  namespace: kube-system
roleRef:
  kind: ClusterRole
  name: filebeat
  apiGroup: rbac.authorization.k8s.io
---
apiVersion: rbac.authorization.k8s.io/v1beta1
kind: ClusterRole
metadata:
  name: filebeat
  labels:
    k8s-app: filebeat
rules:
- apiGroups: [""] # "" indicates the core API group
  resources:
  - namespaces
  - pods
  verbs:
  - get
  - watch
  - list
---
apiVersion: v1
kind: ServiceAccount
metadata:
  name: filebeat
  namespace: kube-system
  labels:
    k8s-app: filebeat
---
[root@k8s-master fek]# cat elasticsearch.yaml
apiVersion: apps/v1
kind: StatefulSet
metadata:
name: elasticsearch
namespace: kube-system
labels:
k8s-app: elasticsearch
spec:
serviceName: elasticsearch
selector:
matchLabels:
k8s-app: elasticsearch
template:
metadata:
labels:
k8s-app: elasticsearch
spec:
containers:
- image: elasticsearch:7.3.1
name: elasticsearch
resources:
limits:
cpu: 1
memory: 2Gi
requests:
cpu: 0.5
memory: 500Mi
env:
- name: "discovery.type"
value: "single-node"
- name: ES_JAVA_OPTS
value: "-Xms512m -Xmx2g"
ports:
- containerPort: 9200
name: db
protocol: TCP
volumeMounts:
- name: elasticsearch-data
mountPath: /usr/share/elasticsearch/data
volumeClaimTemplates:
- metadata:
name: elasticsearch-data
spec:
storageClassName: "managed-nfs-storage"
accessModes: [ "ReadWriteOnce" ]
resources:
requests:
storage: 20Gi
---
apiVersion: v1
kind: Service
metadata:
name: elasticsearch
namespace: kube-system
spec:
clusterIP: None
ports:
- port: 9200
protocol: TCP
targetPort: db
selector:
k8s-app: elasticsearch
[root@k8s-master fek]# cat kibana.yaml
apiVersion: apps/v1
kind: Deployment
metadata:
  name: kibana
  namespace: kube-system
  labels:
    k8s-app: kibana
spec:
  replicas: 1
  selector:
    matchLabels:
      k8s-app: kibana
  template:
    metadata:
      labels:
        k8s-app: kibana
    spec:
      containers:
      - name: kibana
        image: kibana:7.3.1
        resources:
          limits:
            cpu: 1
            memory: 500Mi
          requests:
            cpu: 0.5
            memory: 200Mi
        env:
          - name: ELASTICSEARCH_HOSTS
            value: http://elasticsearch:9200
        ports:
        - containerPort: 5601
          name: ui
          protocol: TCP

---
apiVersion: v1
kind: Service
metadata:
  name: kibana
  namespace: kube-system
spec:
  ports:
  - port: 5601
    protocol: TCP
    targetPort: ui
  selector:
    k8s-app: kibana

---
apiVersion: extensions/v1beta1
kind: Ingress
metadata:
  name: kibana
  namespace: kube-system
spec:
  rules:
  - host: kibana.ctnrs.com
    http:
      paths:
      - path: /
        backend:
          serviceName: kibana
          servicePort: 5601
[root@k8s-master fek]# kubectl create -f . [root@k8s-master fek]# kubectl get pod -n kube-system NAME READY STATUS RESTARTS AGE alertmanager-5d75d5688f-xw2qg 2/2 Running 0 6h32m coredns-bccdc95cf-kqxwv 1/1 Running 2 6d6h coredns-bccdc95cf-nwkbp 1/1 Running 2 6d6h elasticsearch-0 1/1 Running 0 7m15s etcd-k8s-master 1/1 Running 1 6d6h filebeat-8s9cx 1/1 Running 0 7m14s filebeat-xgdj7 1/1 Running 0 7m14s grafana-0 1/1 Running 0 21h kibana-b7d98644-cmg9k 1/1 Running 0 7m15s kube-apiserver-k8s-master 1/1 Running 1 6d6h kube-controller-manager-k8s-master 1/1 Running 2 6d6h kube-flannel-ds-amd64-dc5z9 1/1 Running 1 6d6h kube-flannel-ds-amd64-jm2jz 1/1 Running 1 6d6h kube-flannel-ds-amd64-z6tt2 1/1 Running 1 6d6h kube-proxy-9ltx7 1/1 Running 2 6d6h kube-proxy-lnzrj 1/1 Running 1 6d6h kube-proxy-v7dqm 1/1 Running 1 6d6h kube-scheduler-k8s-master 1/1 Running 2 6d6h kube-state-metrics-6474469878-lkphv 2/2 Running 0 8h prometheus-0 2/2 Running 0 5h6m NAME TYPE CLUSTER-IP EXTERNAL-IP PORT(S) AGE service/elasticsearch ClusterIP None <none> 9200/TCP 46m service/kibana ClusterIP 10.1.185.95 <none> 5601/TCP 46m service/kube-dns ClusterIP 10.1.0.10 <none> 53/UDP,53/TCP,9153/TCP 6d7h NAME HOSTS ADDRESS PORTS AGE ingress.extensions/kibana kibana.ctnrs.com 80 46m
Then let's go and visit it. Here's the test I did, so I wrote its domain name to the local hosts file for parsing.
Here select Explore to import your own data
Now that the data has been collected, see if its index has been successfully written.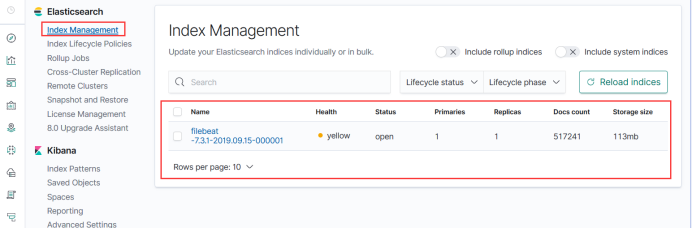
That is to say, after creating three yaml files, the default filebeat index is created, which is like a database. Indexes are queried to the database in ES. Index matching is to let kibana match this index to see the data inside.
Create a matching filebeat index, here will help you to match so there is a filebeat start, because it is stored every day, that is, every day has a name, so a star can match all, you can access the pattern to see the data at the beginning of this point here also click save.
Here we add a field for filtering time, which is generally used as a timestamp.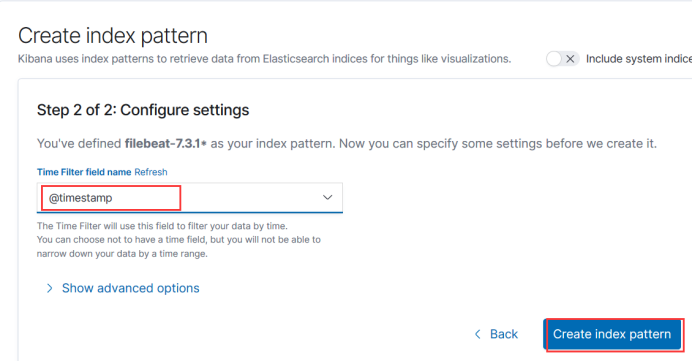

Then click the top button to see the data. The default here is to use this filebeat. If there are more than one, there will be a selection box. The following output is from all consoles.
Here you can see some related logs, such as namespaces, many
For example, look at the logs of containers under the storage path of containers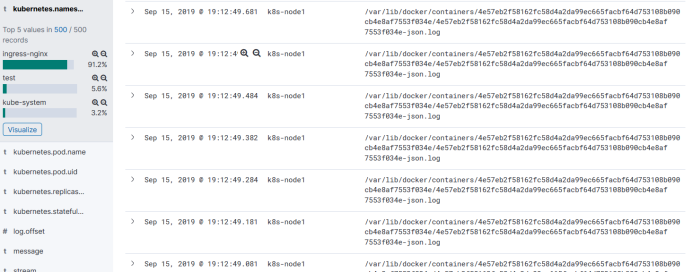
There are also messages that output the overall log content to see which namespace it uses, the name of the pod, the name of the node, and the collected log.
For example, look at some of the logs you want individually and filter them by filtering conditions.
Now we're going to collect k8s logs, which is your ELK platform deployed. It's a stand-alone system deployed. If we use set car to collect this logs.
If you collect k8s logs, you need to collect them
[root@k8s-master elk]# tail /var/log/messages
This file, collect this, we first write a filebeat, which specifies that you want to collect those files, this filebeat pod, can not access the host, so we need to mount this file through the data volume, the index of ES is equivalent to the db of mysql, so we need to create different indexes according to es, that is. Is a daily record of a log, the log generated on that day into this index, the index should be custom name, according to your current deployment of business to write a name, so as to query aspects later, do a certain classification, do not come to a few projects, k8s project, php project, Tomcat project Well, it's all in one index, and it's difficult to query, so divide them into different indexes. To specify these, you need to add these three parameters.
setup.ilm.enabled: false
    setup.template.name: "k8s-module"
    setup.template.pattern: "k8s-module-*"
Following is the file set deployed by deemonset to each node, and / var/log/messages / on the host machine is mounted to / var/log/messages in the container through the hostpath, so that the log file can be read in the container, which is the collection of k8s logs.
[root@k8s-master elk]# cat k8s-logs.yaml
apiVersion: v1
kind: ConfigMap
metadata:
  name: k8s-logs-filebeat-config
  namespace: kube-system

data:
  filebeat.yml: |
    filebeat.inputs:
      - type: log
        paths:
          - /var/log/messages
        fields:
          app: k8s
          type: module
        fields_under_root: true

    setup.ilm.enabled: false
    setup.template.name: "k8s-module"
    setup.template.pattern: "k8s-module-*"

    output.elasticsearch:
      hosts: ['elasticsearch.kube-system:9200']
      index: "k8s-module-%{+yyyy.MM.dd}"

---

apiVersion: apps/v1
kind: DaemonSet
metadata:
  name: k8s-logs
  namespace: kube-system
spec:
  selector:
    matchLabels:
      project: k8s
      app: filebeat
  template:
    metadata:
      labels:
        project: k8s
        app: filebeat
    spec:
      containers:
      - name: filebeat
        image: elastic/filebeat:7.3.1
        args: [
          "-c", "/etc/filebeat.yml",
          "-e",
        ]
        resources:
          requests:
            cpu: 100m
            memory: 100Mi
          limits:
            cpu: 500m
            memory: 500Mi
        securityContext:
          runAsUser: 0
        volumeMounts:
        - name: filebeat-config
          mountPath: /etc/filebeat.yml
          subPath: filebeat.yml
        - name: k8s-logs
          mountPath: /var/log/messages
      volumes:
      - name: k8s-logs
        hostPath:
          path: /var/log/messages
      - name: filebeat-config
        configMap:
          name: k8s-logs-filebeat-config
[root@k8s-master elk]# kubectl create -f k8s-logs.yaml [root@k8s-master elk]# kubectl get pod -n kube-system NAME READY STATUS RESTARTS AGE coredns-bccdc95cf-kqxwv 1/1 Running 2 6d8h coredns-bccdc95cf-nwkbp 1/1 Running 2 6d8h elasticsearch-0 1/1 Running 0 94m etcd-k8s-master 1/1 Running 1 6d8h filebeat-8s9cx 1/1 Running 0 94m filebeat-xgdj7 1/1 Running 0 94m k8s-logs-5s9kl 1/1 Running 0 37s k8s-logs-txz4q 1/1 Running 0 37s kibana-b7d98644-cmg9k 1/1 Running 0 94m kube-apiserver-k8s-master 1/1 Running 1 6d8h kube-controller-manager-k8s-master 1/1 Running 2 6d8h kube-flannel-ds-amd64-dc5z9 1/1 Running 1 6d7h kube-flannel-ds-amd64-jm2jz 1/1 Running 1 6d7h kube-flannel-ds-amd64-z6tt2 1/1 Running 1 6d8h kube-proxy-9ltx7 1/1 Running 2 6d8h kube-proxy-lnzrj 1/1 Running 1 6d7h kube-proxy-v7dqm 1/1 Running 1 6d7h kube-scheduler-k8s-master 1/1 Running 2 6d8h
Or the original step, the last button index management here
This is our custom logs.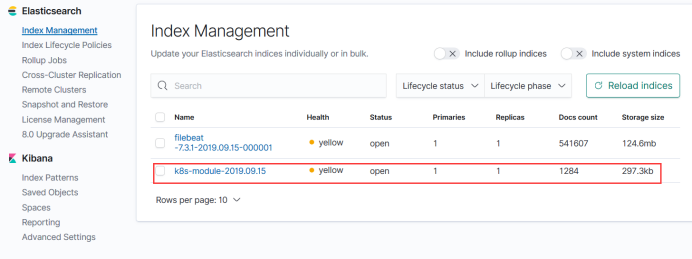
Then create an index
Select this and save it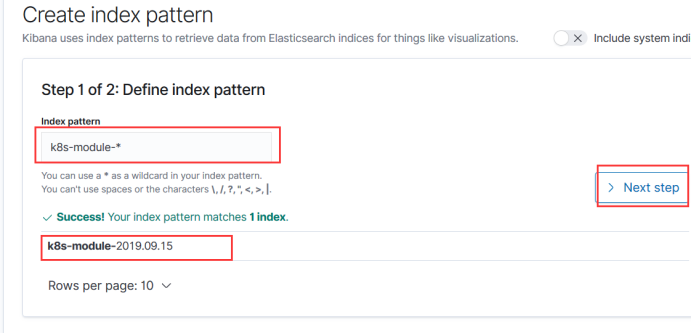
Create index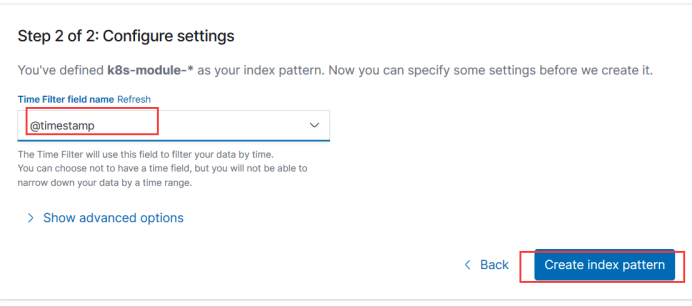
Select module - Here you can see our var/log/messages logs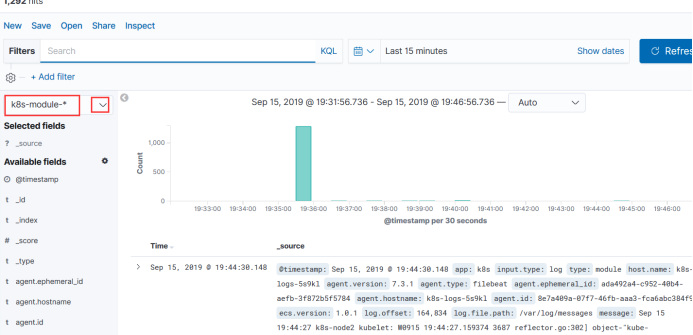
Do a simple test like this
[root@k8s-node1 ~]# echo hello > /var/log/messages
Then receive tomcat's log
In general, the reverse proxy for Tomcat is nginx, while the log for Tomcat is catalina.
jc logs need to be read when debugging.
[root@k8s-master elk]# cat tomcat-deployment.yaml
apiVersion: apps/v1beta1
kind: Deployment
metadata:
  name: tomcat-java-demo
  namespace: test
spec:
  replicas: 3
  selector:
    matchLabels:
      project: www
      app: java-demo
  template:
    metadata:
      labels:
        project: www
        app: java-demo
    spec:
      imagePullSecrets:
      - name: registry-pull-secret
      containers:
      - name: tomcat
        image: 192.168.30.24/test/tomcat-java-demo:latest
        imagePullPolicy: Always
        ports:
        - containerPort: 8080
          name: web
          protocol: TCP
        resources:
          requests:
            cpu: 0.5
            memory: 1Gi
          limits:
            cpu: 1
            memory: 2Gi
        livenessProbe:
          httpGet:
            path: /
            port: 8080
          initialDelaySeconds: 60
          timeoutSeconds: 20
        readinessProbe:
          httpGet:
            path: /
            port: 8080
          initialDelaySeconds: 60
          timeoutSeconds: 20
        volumeMounts:
        - name: tomcat-logs
          mountPath: /usr/local/tomcat/logs

      - name: filebeat
        image: elastic/filebeat:7.3.1
        args: [
          "-c", "/etc/filebeat.yml",
          "-e",
        ]
        resources:
          limits:
            memory: 500Mi
          requests:
            cpu: 100m
            memory: 100Mi
        securityContext:
          runAsUser: 0
        volumeMounts:
        - name: filebeat-config
          mountPath: /etc/filebeat.yml
          subPath: filebeat.yml
        - name: tomcat-logs
          mountPath: /usr/local/tomcat/logs
      volumes:
      - name: tomcat-logs
        emptyDir: {}
      - name: filebeat-config
        configMap:
          name: filebeat-config
---
apiVersion: v1
kind: ConfigMap
metadata:
  name: filebeat-config
  namespace: test

data:
  filebeat.yml: |-
    filebeat.inputs:
    - type: log
      paths:
        - /usr/local/tomcat/logs/catalina.*

      fields:
        app: www
        type: tomcat-catalina
      fields_under_root: true
      multiline:
        pattern: '^\['
        negate: true
        match: after

    setup.ilm.enabled: false
    setup.template.name: "tomcat-catalina"
    setup.template.pattern: "tomcat-catalina-*"

    output.elasticsearch:
      hosts: ['elasticsearch.kube-system:9200']
      index: "tomcat-catalina-%{+yyyy.MM.dd}"
Scroll to update, generally if the error log, the log volume will increase, it must be resolved, not access to the log. In addition, scrolling updates take a minute.
[root@k8s-master elk]# kubectl get pod -n test
[root@k8s-master elk]# kubectl get pod -n test
NAME                                READY   STATUS    RESTARTS   AGE
tomcat-java-demo-7ffd4dc7c5-26xjf   2/2     Running   0          5m19s
tomcat-java-demo-7ffd4dc7c5-lwfgr   2/2     Running   0          7m31s
tomcat-java-demo-7ffd4dc7c5-pwj77   2/2     Running   0          8m50s
Our logs were collected.
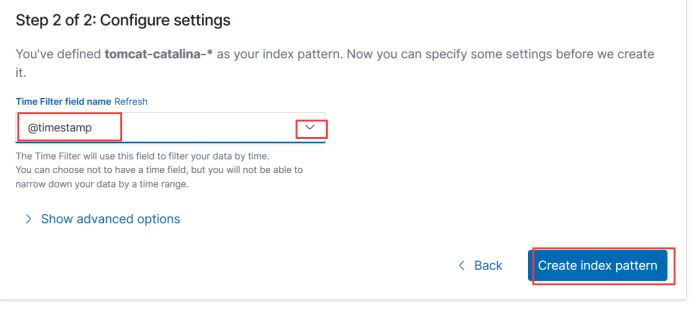
Then create an index
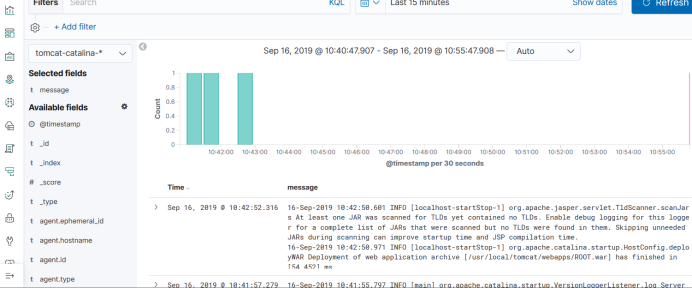
Then you can also test the containers, such as access logs, and so on, just like the previous test.