ASP.NET MVC calls database data in JSON way to generate statistical graphs
ASP.NET MVC Profile:
As the name suggests, the features of this technology are: M: Model; V: Views; C: Controller.
Model: A set of classes that describe the data to be processed and the business rules for modifying and manipulating the data.
View: Defines how the user interface of the application is displayed.
Controller: A set of classes for handling communications from users, the entire application flow, and specific application logic.
So far, we only know the use of View and Controller, which is not very useful for Model, but recently the leader asked to write a database content into statistics, using ECharts to achieve. Take a note when the hard implementation is complete.
Code it, the more you say it, the more messy it is.
First, the Controller section:
using Microsoft.AspNetCore.Mvc;
using RoadFlow.Mapper;
using System;
using System.Collections;
using System.Collections.Generic;
using System.Runtime.Serialization.Json;

namespace RoadFlow.Mvc.Controllers
{
    public class GetEchartsController : Controller
    {
        public ActionResult Charts()
        {
            return View();
        }

        public JsonResult GetCharts()
        {
            ArrayList xAxisData = new ArrayList();
            ArrayList yAxisData = new ArrayList();
            System.Data.DataTable dt = new System.Data.DataTable();
            var db = new DataContext();//The database has been connected
            var table = db.GetDataTable("select count(receivename) num ,receivename name from ****where status = 2 group by receivename ");//Here is the sql statement
            for(int i=0;i<table.Rows.Count;i++)
            {
                xAxisData.Add(table.Rows[i].ItemArray[1]);//Extract the part we want and store it in the array
                yAxisData.Add(table.Rows[i].ItemArray[0]);
            }
            var result = new { name = xAxisData, num = yAxisData };//Design JSON format
            return Json(result);//Return JSON data
        }
    }
}
Next, the data in the View section:
<!DOCTYPE html>
<html>
<head>
    <meta charset="utf-8">
    <title>ECharts</title>
    <!-- Introduce echarts.js -->
    @*<script src="echarts.common.min.js"></script>*@
    <script src="~/RoadFlowResources/scripts/echarts.common.min.js"></script>
    <script src="~/RoadFlowResources/scripts/jquery-1.12.4.js"></script>
</head>
<body>
    <!-- by ECharts Prepare a size (width and height) Dom -->
    <div id="main" style="width: 600px;height:400px;"></div>
    <script type="text/javascript">
        // Initialize echarts based on prepared dom
            // Specify the configuration items and data for the chart
        alert("Start execution");
        $.ajax({
            type: "post",
            async: true,
            url: "GetCharts",//Write out the relative path.
            dataType: "json",
            success: function (result) {
                var objsx = [];
                var objsy = [];
                for (var i = 0; i < result.num.length; i++) {
                    objsy[i] = JSON.parse(result.num[i]);//Receiving numbers in a specific JSON format;
                for (var i = 0; i < result.name.length; i++){
                    objsx[i] = JSON.stringify(result.name[i]);//Receiving strings as JSON
                }
                var myChart = echarts.init(document.getElementById('main'));
                var option = {
                    title: {
                        text: 'Design your own headlines'
                    },
                    tooltip: {},
                    legend: {
                        data: ['Give the meaning of a column']
                    },
                    xAxis: {
                        data: objsx
                    },
                    yAxis: {},
                    series: [{
                        name: 'y Axis name',
                        type: 'bar',
                        data: objsy
                    }]
                };

                // Use the configuration items and data just specified to display the chart.
                myChart.setOption(option);

            },
            error: function (errorMsg) {
                //Execute this function when the request fails
                alert("Failed to request data!");
                myChart.hideLoading();
            }
        });
    </script>
</body>
</html>
That's it!!!
Most importantly:
1. Designing output data, if there is more than one return value (normally more than one set of return values), it must be converted into JSON data return in a receivable way that can be processed.
2. When receiving data, we must distinguish between them. Otherwise, we will report errors, and we will not find out where we made mistakes (I have suffered losses).
3. The path of the URL must be written correctly, which is the relative path of the view, as long as the path of the corresponding view under the controller can be found.
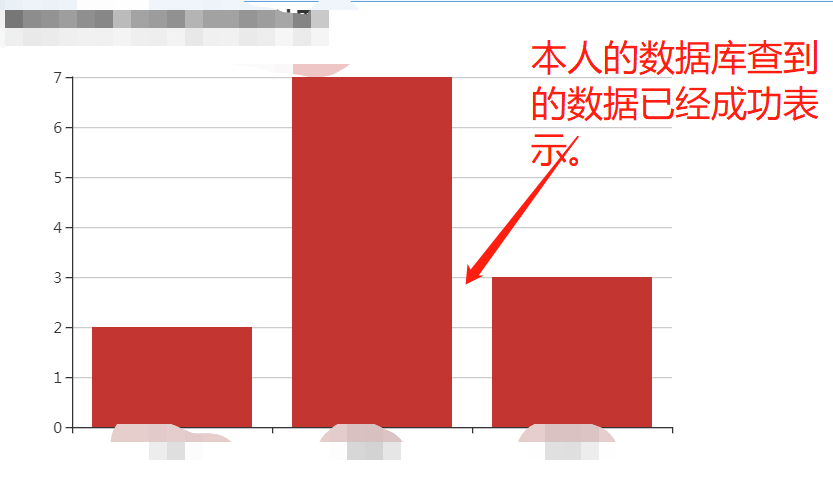
The results are as follows (ugly, but it's a little bit ugly, but it's a little bit of a whitewash to survive):