Preface:
Python for me is also a process of gradually learning and mastering. The content of this tour starts from the beginning. Before entering the text, I attach the most coveted seafood feast on (du).

Data crawling:
In recent days, the circle of friends has been swiped by everyone's travel footprints, marveling at those friends who have basically visited all provinces of the country. At the same time, I also wrote a travel related content. This data comes from a very friendly travel strategy website: Mafeng.
PART1: get city number
All cities, scenic spots and other information in Mafeng have a unique 5-digit number. Our first step is to obtain the number of the city (municipality + prefecture level city) for further analysis.
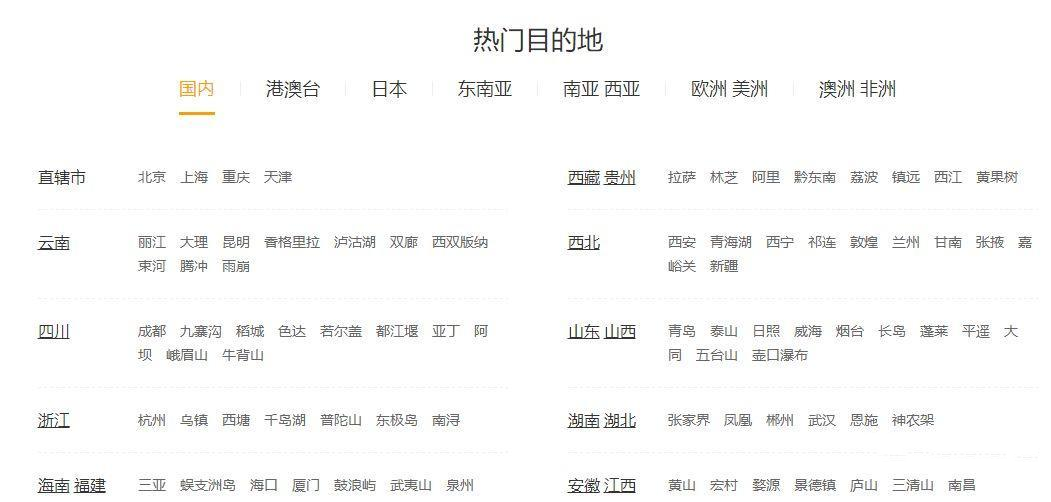
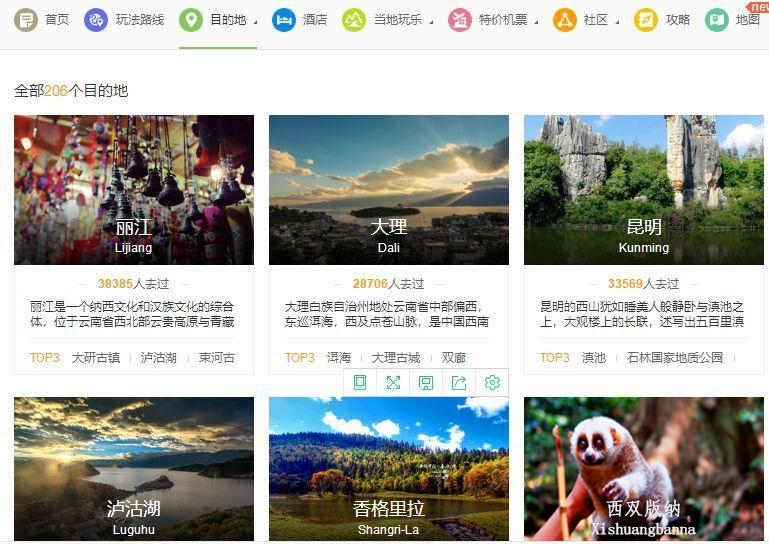
The above two pages are the source of our city code. You need to get the province code from the destination page first, and then enter the province city list to get the code. In the process, Selenium needs to crawl the dynamic data. Some codes are as follows:
def find_cat_url(url):
      headers = {'User-Agent':'Mozilla/5.0 (Windows NT 6.1; WOW64; rv:23.0) Gecko/20100101 Firefox/23.0'}
      req=request.Request(url,headers=headers)
      html=urlopen(req)
      bsObj=BeautifulSoup(html.read(),"html.parser")
      bs = bsObj.find('div',attrs={'class':'hot-list clearfix'}).find_all('dt')
      cat_url = []
      cat_name = []
      for i in range(0,len(bs)):
            for j in range(0,len(bs[i].find_all('a'))):
                  cat_url.append(bs[i].find_all('a')[j].attrs['href'])
                  cat_name.append(bs[i].find_all('a')[j].text)
      cat_url = ['http://www.mafengwo.cn'+cat_url[i] for i in range(0,len(cat_url))]
      return cat_url

def find_city_url(url_list):
      city_name_list = []
      city_url_list = []
      for i in range(0,len(url_list)):
            driver = webdriver.Chrome()
            driver.maximize_window()
            url = url_list[i].replace('travel-scenic-spot/mafengwo','mdd/citylist')
            driver.get(url)
            while True:
                  try:

                       time.sleep(2)
                       bs = BeautifulSoup(driver.page_source,'html.parser')
                       url_set = bs.find_all('a',attrs={'data-type':'Destination'})
                       city_name_list = city_name_list +[url_set[i].text.replace('\n','').split()[0] for i in range(0,len(url_set))]
                       city_url_list = city_url_list+[url_set[i].attrs['data-id'] for i in range(0,len(url_set))]
                       js="var q=document.documentElement.scrollTop=800"
                       driver.execute_script(js)
                       time.sleep(2)
                       driver.find_element_by_class_name('pg-next').click()
                except:
                      break
            driver.close()

return city_name_list,city_url_list
url = 'http://www.mafengwo.cn/mdd/'
url_list = find_cat_url(url)
city_name_list,city_url_list=find_city_url(url_list)
city = pd.DataFrame({'city':city_name_list,'id':city_url_list})
PART2: get city information
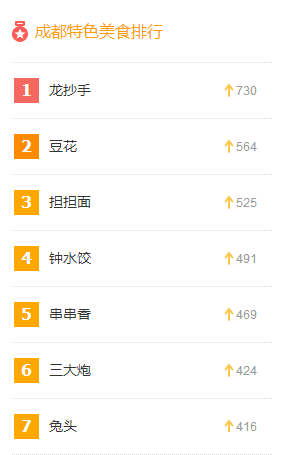
City data are obtained from the following pages:
(a) snack page
(b) attractions page
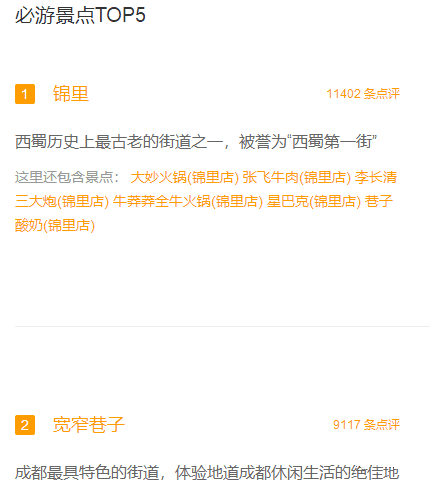
(c) Label Page
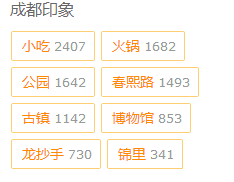
We encapsulate the process of data acquisition for each city into a function. The city code obtained before each input is as follows:
def get_city_info(city_name,city_code):
      this_city_base = get_city_base(city_name,city_code)
      this_city_jd = get_city_jd(city_name,city_code)
      this_city_jd['city_name'] = city_name
      this_city_jd['total_city_yj'] = this_city_base['total_city_yj']
      try:

            this_city_food = get_city_food(city_name,city_code)
            this_city_food['city_name'] = city_name
            this_city_food['total_city_yj'] = this_city_base['total_city_yj']
      except:
            this_city_food=pd.DataFrame()
      return this_city_base,this_city_food,this_city_jd

def get_city_base(city_name,city_code):
      url = 'http://www.mafengwo.cn/xc/'+str(city_code)+'/'
      bsObj = get_static_url_content(url)
      node = bsObj.find('div',{'class':'m-tags'}).find('div',{'class':'bd'}).find_all('a')
      tag = [node[i].text.split()[0] for i in range(0,len(node))]
      tag_node = bsObj.find('div',{'class':'m-tags'}).find('div',{'class':'bd'}).find_all('em')
      tag_count = [int(k.text) for k in tag_node]
      par = [k.attrs['href'][1:3] for k in node]
      tag_all_count = sum([int(tag_count[i]) for i in range(0,len(tag_count))])
      tag_jd_count = sum([int(tag_count[i]) for i in range(0,len(tag_count)) if par[i]=='jd'])
      tag_cy_count = sum([int(tag_count[i]) for i in range(0,len(tag_count)) if par[i]=='cy'])
      tag_gw_yl_count = sum([int(tag_count[i]) for i in range(0,len(tag_count)) if par[i] in ['gw','yl']])
      url = 'http://www.mafengwo.cn/yj/'+str(city_code)+'/2-0-1.html '
      bsObj = get_static_url_content(url)
      total_city_yj = int(bsObj.find('span',{'class':'count'}).find_all('span')[1].text)
      return {'city_name':city_name,'tag_all_count':tag_all_count,'tag_jd_count':tag_jd_count,
                  'tag_cy_count':tag_cy_count,'tag_gw_yl_count':tag_gw_yl_count,
                  'total_city_yj':total_city_yj}

def get_city_food(city_name,city_code):
      url = 'http://www.mafengwo.cn/cy/'+str(city_code)+'/gonglve.html'
      bsObj = get_static_url_content(url)
      food=[k.text for k in bsObj.find('ol',{'class':'list-rank'}).find_all('h3')]
      food_count=[int(k.text) for k in bsObj.find('ol',{'class':'list-rank'}).find_all('span',{'class':'trend'})]
      return pd.DataFrame({'food':food[0:len(food_count)],'food_count':food_count})

def get_city_jd(city_name,city_code):
      url = 'http://www.mafengwo.cn/jd/'+str(city_code)+'/gonglve.html'
      bsObj = get_static_url_content(url)
      node=bsObj.find('div',{'class':'row-top5'}).find_all('h3')
      jd = [k.text.split('\n')[2] for k in node]
      node=bsObj.find_all('span',{'class':'rev-total'})
      jd_count=[int(k.text.replace(' Comment','')) for k in node]
      return pd.DataFrame({'jd':jd[0:len(jd_count)],'jd_count':jd_count})
Data analysis:
PART1: City data
First, let's look at the top 10 cities with the largest number of travels:
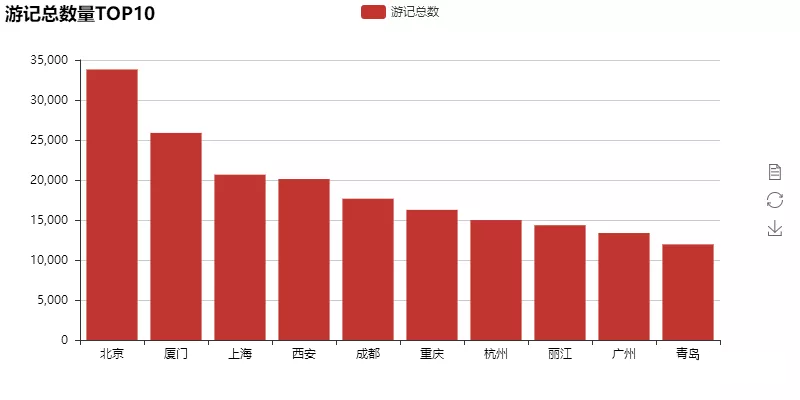
The number of top 10 travel notes is basically consistent with the number of popular cities we know everyday. We further obtain the national travel destination heat map according to the number of travel notes in each city:
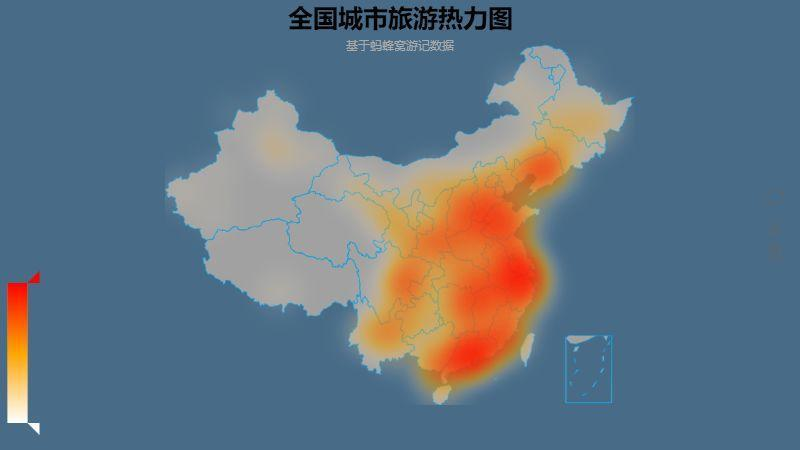
See here, is there a sense of deja vu? If the footprints you are drying in your friend circle are very consistent with this picture, then it shows that the data of Mafeng is consistent with you.
Finally, let's take a look at your impression of each city. The method is to extract the attributes in the tag. We divide the attributes into three groups: leisure, diet and scenic spots. Let's take a look at the most impressive cities under each group of attributes.
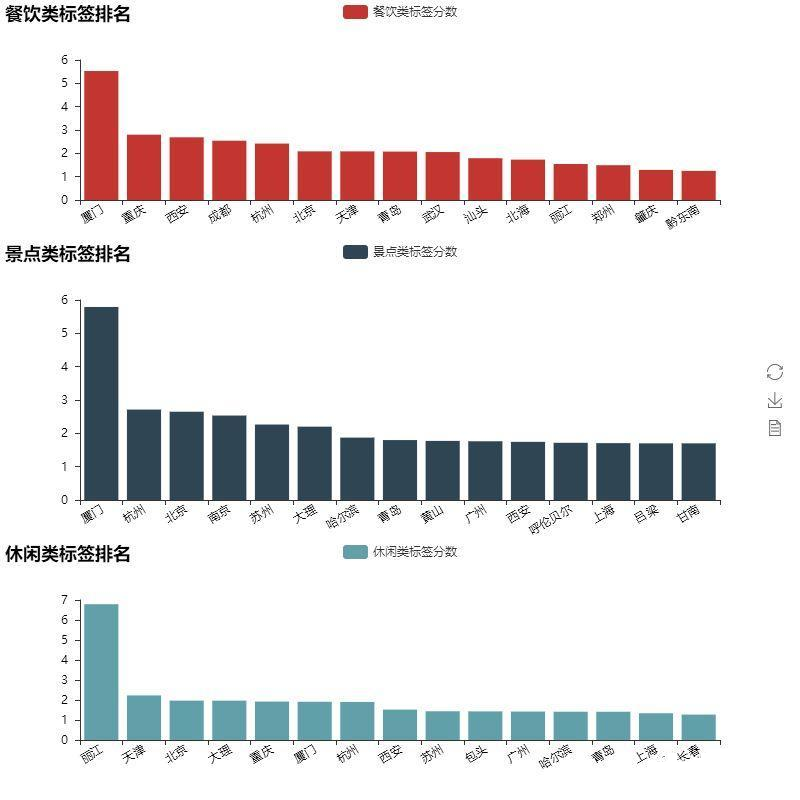
It seems that for Mafeng's users, Xiamen has left a deep impression, not only the number of travel notes is sufficient, but also there are many effective tags that can be extracted from it. Chongqing, Xi'an and Chengdu also left a deep impression on the foodies without any suspense. Some codes are as follows:
bar1= Bar("Food and beverage label ranking")
bar1.add("Food and beverage label score", city_aggregate.sort_values('cy_point',0,False)['city_name'][0:15],
            city_aggregate.sort_values('cy_point',0,False)['cy_point'][0:15],
            is_splitline_show =False,xaxis_rotate=30)

bar2 = Bar("Ranking of scenic spots",title_top="30%")
bar2.add("Scenic spot label score", city_aggregate.sort_values('jd_point',0,False)['city_name'][0:15],
            city_aggregate.sort_values('jd_point',0,False)['jd_point'][0:15],
            legend_top="30%",is_splitline_show =False,xaxis_rotate=30)

bar3 = Bar("Leisure label ranking",title_top="67.5%")
bar3.add("Leisure label score", city_aggregate.sort_values('xx_point',0,False)['city_name'][0:15],
            city_aggregate.sort_values('xx_point',0,False)['xx_point'][0:15],
            legend_top="67.5%",is_splitline_show =False,xaxis_rotate=30)

grid = Grid(height=800)
grid.add(bar1, grid_bottom="75%")
grid.add(bar2, grid_bottom="37.5%",grid_top="37.5%")
grid.add(bar3, grid_top="75%")
grid.render('City classification label.html')
#Python learning group 631441315, there are a large number of PDF books, tutorials free to use! No matter which stage you learn, you can get the tutorial you need!
PART2: scenic spot data
We extract the number of comments on each scenic spot and compare it with the number of city travel notes to get the absolute value and relative value of the comments on each scenic spot, and then calculate the popularity and representativeness scores of the scenic spot. Finally, the top 15 scenic spots are listed as follows:
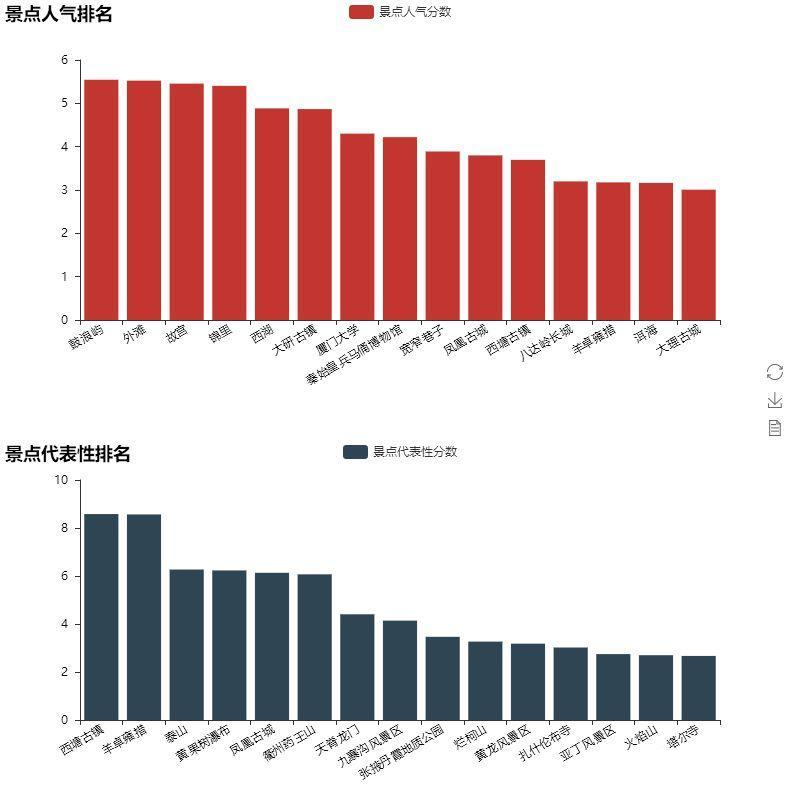
Mafeng netizens really like Xiamen. Gulangyu has also become the most popular scenic spot. Xitang ancient town and yangzhuoyongcuo rank first in terms of urban representativeness. If you are worried that there are too many people in the upper row of scenic spots, you may as well excavate the scenic spots with fewer people in the lower row.
PART3: Snack data
Finally, let's take a look at the most concerned data related to eating. The processing method is similar to that of PART2 scenic spots. Let's take a look at the most popular and representative snacks in the city.
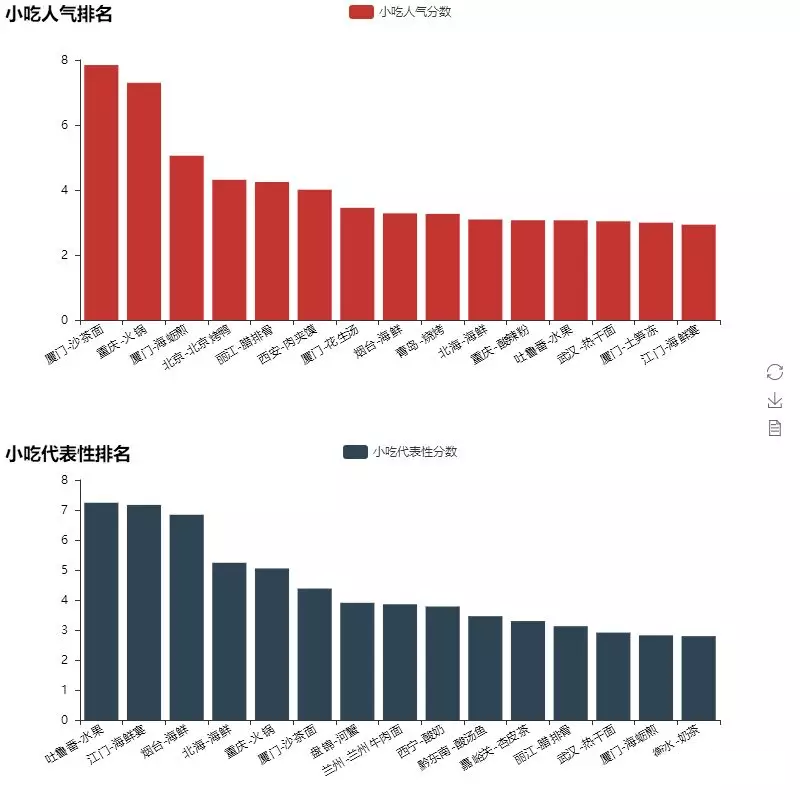
Unexpectedly, Mafeng netizens are deeply in love with Xiamen fruit, which makes Sha Cha noodles rank among the most popular snacks over hotpot, roast duck and rougamo. In terms of urban representativeness, the frequency of seafood appearance is very high, which coincides with the cognition of Big ben family. Part of the codes of PART2 and 3 are as follows:
bar1 = Bar("Popularity ranking of scenic spots")
bar1.add("Attraction popularity score", city_jd_com.sort_values('rq_point',0,False)['jd'][0:15],
            city_jd_com.sort_values('rq_point',0,False)['rq_point'][0:15],
            is_splitline_show =False,xaxis_rotate=30)

bar2 = Bar("Representative ranking of scenic spots",title_top="55%")
bar2.add("Representative scores of scenic spots", city_jd_com.sort_values('db_point',0,False)['jd'][0:15],
            city_jd_com.sort_values('db_point',0,False)['db_point'][0:15],
            is_splitline_show =False,xaxis_rotate=30,legend_top="55%")

grid=Grid(height=800)
grid.add(bar1, grid_bottom="60%")
grid.add(bar2, grid_top="60%",grid_bottom="10%")
grid.render('Scenic spots ranking.html')