Introduction to Statistical Process Control
Statistical Process Control Statistical Process Control is a process control tool based on mathematical statistics.It analyzes and evaluates the production process, discovers timely signs of systemic factors based on feedback information, and takes measures to eliminate their impact so that the process remains in a controlled state affected only by random factors, in order to achieve the purpose of controlling quality.
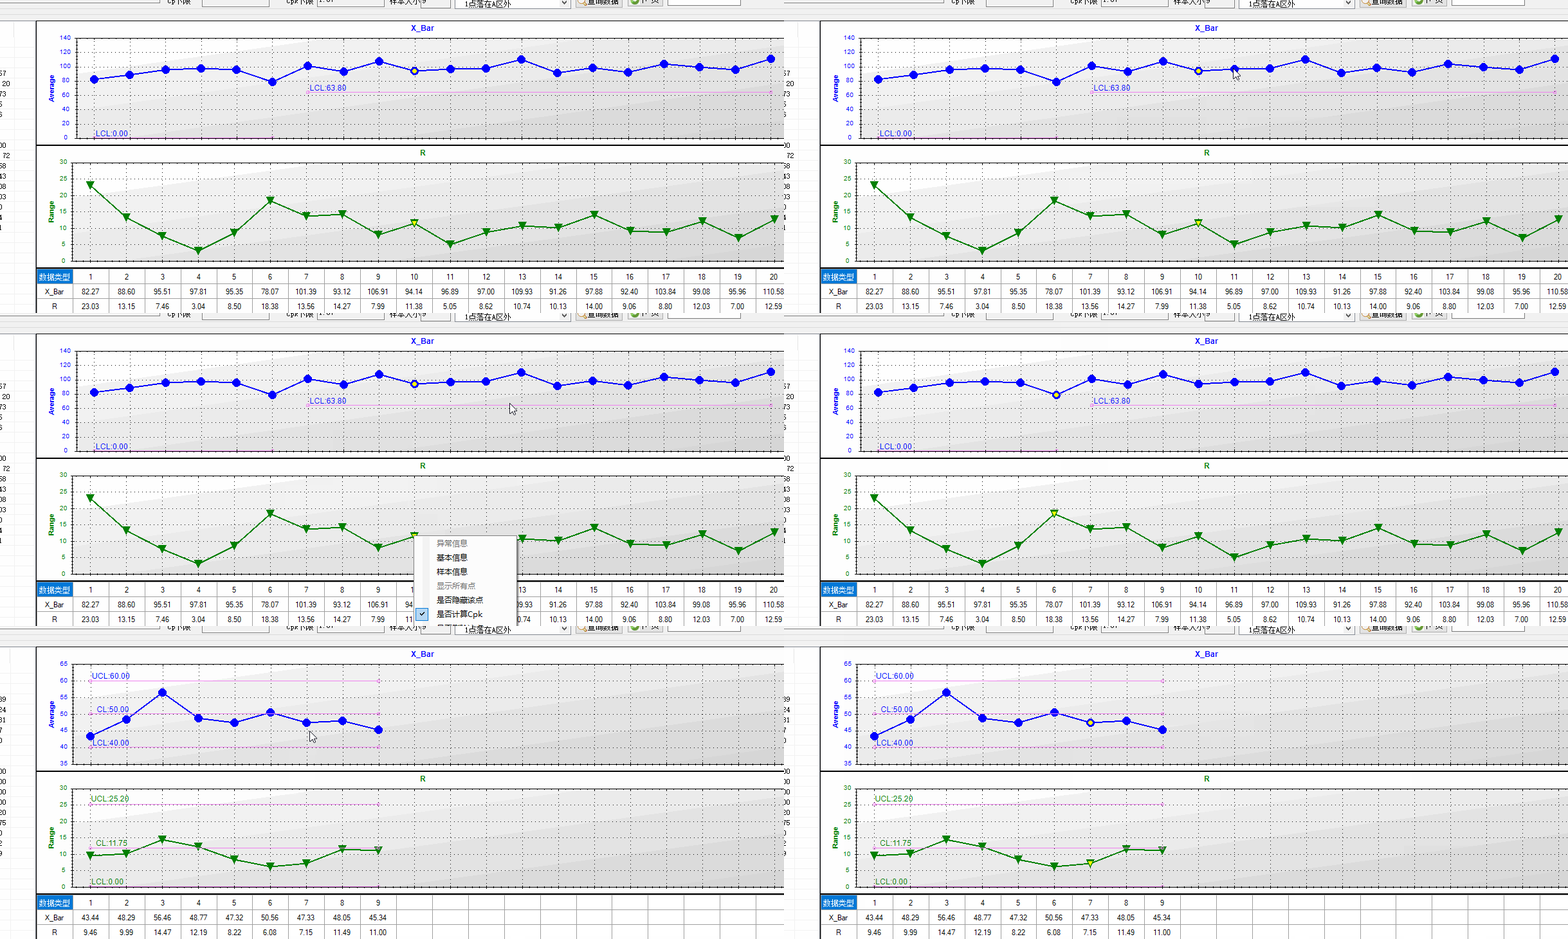
In the production and manufacturing process of enterprises, we often need to collect production data, then process the data, and finally present the processed data, dispatch instructions or decisions in the form of reports and data screen, giving reasonable and scientific decision-making suggestions to the leadership.
This project mainly uses Windows 10 + Visual Studio 2019 + Windows Form Application (.Net Framework) to implement Six Sigma mode data decision-making and Chart report module display, mainly for continued learning and research.
Six Sigma Core Algorithms
Algorithmic Reference Formula Click me to download Chart report can be displayed with Chart module after data is processed by algorithm.
Chart Module Core Code
 1 //Define Chart Area
 2             this.chartMain.ChartAreas.Clear();
 3             ChartArea chartArea1 = new ChartArea("C1");
 4             this.chartMain.ChartAreas.Add(chartArea1);
 5             //Define containers for storing and displaying points
 6             this.chartMain.Series.Clear();
 7             Series series1 = new Series("S1");
 8             series1.ChartArea = "C1";
 9             this.chartMain.Series.Add(series1);
10             //Set Chart Display Style
11             this.chartMain.ChartAreas[0].AxisY.Minimum = 0;
12             this.chartMain.ChartAreas[0].AxisY.Maximum = 100;
13             this.chartMain.ChartAreas[0].AxisX.Interval = 5;
14             this.chartMain.ChartAreas[0].AxisX.MajorGrid.LineColor = System.Drawing.Color.Silver;
15             this.chartMain.ChartAreas[0].AxisY.MajorGrid.LineColor = System.Drawing.Color.Silver;
16             //Set Title
17             this.chartMain.Titles.Clear();
18             this.chartMain.Titles.Add("S01");
19             this.chartMain.Titles[0].Text = "XXX display";
20             this.chartMain.Titles[0].ForeColor = Color.Green;
21             this.chartMain.Titles[0].Font = new System.Drawing.Font("Microsoft Sans Serif", 12F);
22             //Set Chart Display Style
23             this.chartMain.Series[0].Color = Color.Red;
24             if (this.cmbChartType.Text.ToString() == "Line chart")
25             {
26                 this.chartMain.Titles[0].Text = string.Format("SPC Modular-[{0}]functional testing", "Line chart");
27                 this.chartMain.Series[0].ChartType = SeriesChartType.Line;
28             }
29             else if (this.cmbChartType.Text.ToString() == "Waveform")
30             {
31                 this.chartMain.Titles[0].Text = string.Format("SPC Modular-[{0}]functional testing", "Waveform");
32                 this.chartMain.Series[0].ChartType = SeriesChartType.Spline;
33             }
34             this.chartMain.Series[0].Points.Clear();
Achieving results


==============================================================================================
Author: Jeremy.Wu
Source: https://www.cnblogs.com/jeremywucnblog/
The copyright of this article belongs to both the author and the blog park. Welcome to reprint [Zan Zan]. Please keep this statement for reprinting and give a link to the original text in an obvious place on the article page. Thank you.