This viral outbreak is believed to have seen this picture: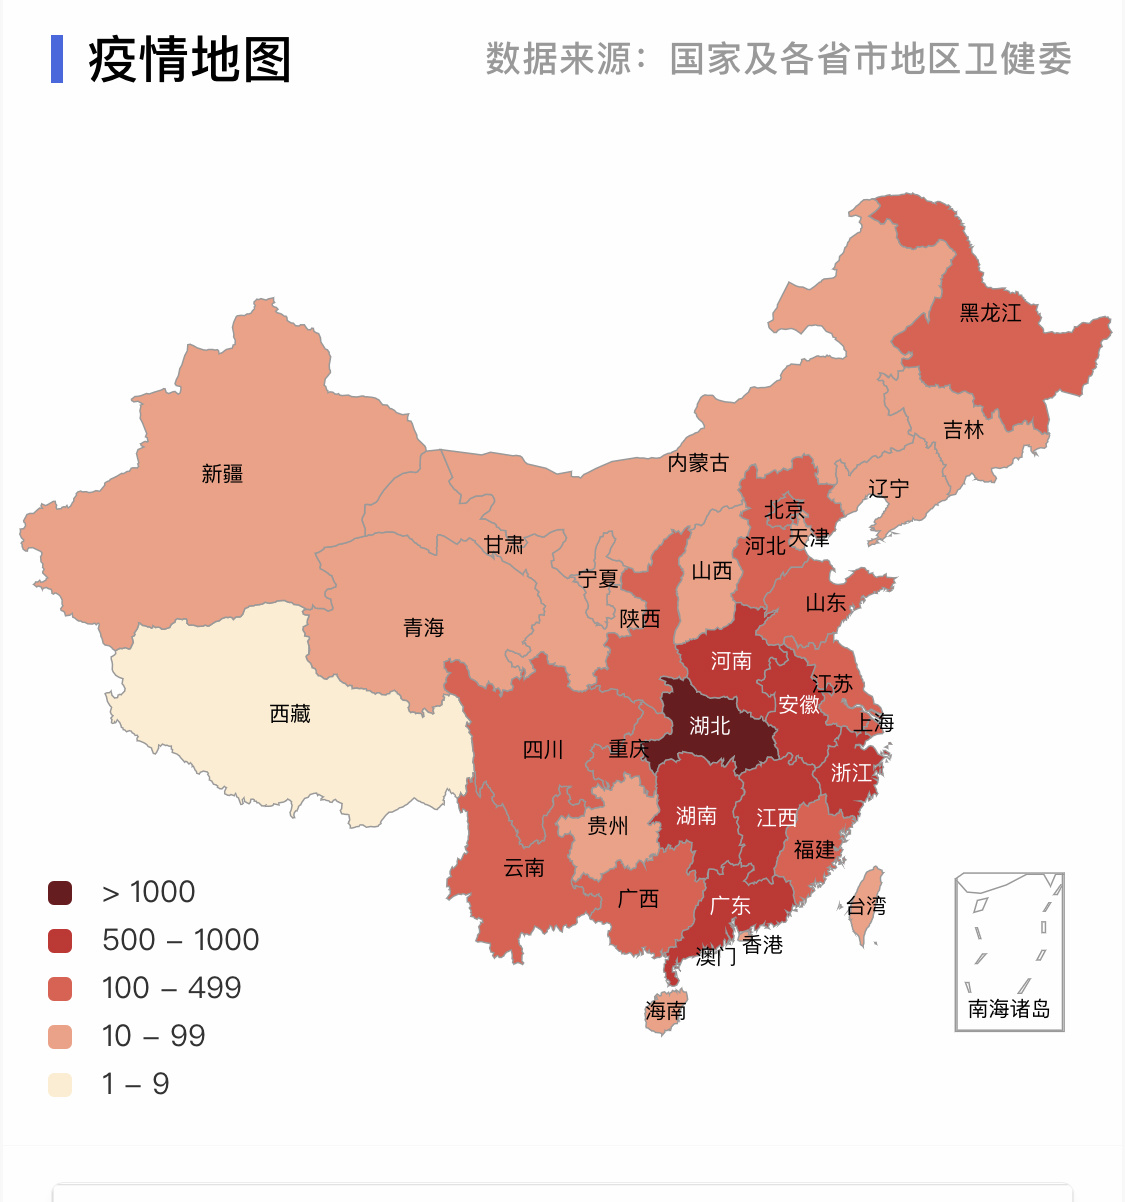
The advantage of this map is intuitive, but the disadvantage is that it is "too intuitive" and too rough to see the details of each city, so I came up with the idea of making a more "detailed" thematic map!Okay, now go straight to the topic: Learn + Operate!
1. Install Pyecharts
In short, Pyecharts is a powerful data visualization tool that combines python with echarts.
1. Installation
Open the terminal and use the pip command:
pip install Pyecharts
Links to foreign networks, if too slow, can mirror the path of Tsinghua, the specific commands are as follows:
pip install -i https://pypi.tuna.tsinghua.edu.cn/simple Pyecharts
You can use this command to install anything else, just replace "Pyecharts".
Note that the version installed in this way is 1.6.2, which is quite different from the previous version. What you can get now is the code from the previous version. If you refer to the previous learning, there will be a lot of problems.It's unfriendly to feel that python's package versions have changed a lot and feel casual.
2. Install the corresponding map expansion pack
pip install echarts-countries-pypkg  #Countries
pip install echarts-china-provinces-pypkg #China's Provinces
pip install echarts-china-cities-pypkg #Cities in China
pip install echarts-china-counties-pypkg#map of China
pip install echarts-china-misc-pypkg#Map of China
Installation of this fool, pip is recommended, preferably with Tsinghua mirror, will be much faster.
2. Data preparation
Painting requires data, which cannot be written manually, so to crawl, some gods have done well before the crawl, and can be used for reference.Python crawlers are awesome. They can crawl anything, not to mention that.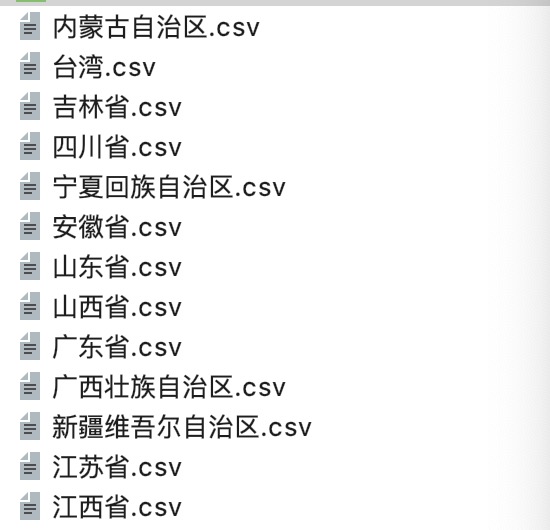
The key is to crawl to the data format needed for drawing. Pyecharts needs a list of meta-ancestors in this format:
data=[('Suzhou', 55), ('Nanjing', 47), ('Xuzhou', 45), ('Wuxi', 26), ('Taizhou', 26), ('Huai'an', 26), ('Nantong', 25), ('Changzhou', 24), ('Lianyungang', 20), ('Yangzhou', 15), ('ynz', 15), ('Suite', 11), ('Zhenjiang', 6), ('Qingdao', 35), ('Linyi', 30)....]
If you have less data, you can write it yourself, simple violence!This is more, so traversal is required, code as follows:
import pandas as pd
Result=pd.DataFrame()#Define two pandas data frames to store data
Result1=pd.DataFrame()
for f_name in lst:
    if f_name[-3:]=="csv":
        data = pd.read_csv(f_name)
        data_City=data["City"]#Find the corresponding column
        data_Numbers=data["Number of confirmed cases"]
        Result1=pd.concat([data_City,data_Numbers], axis=1)#Store data
        Result = pd.concat([Result, Result1])#Collect the data together again
That's not enough. To make up the list of ancestors, do the following:
data=[]#Define a dataset
for i in range(len(Result)):
    turple=(Result.iat[i,0],int(Result.iat[i,1]))
    data.append(turple)
print(data)#Print it out and check it out. This is the most important step
2. Calling Geo and Map classes
This step, stepped on a lot of pits, mainly due to the version problem of Pyecharts, the initial use of from pyecharts import Geo,Map, how can't import, error!Actually, the reason is that the new version has changed the path of Geo and Map. Now all you can find on the Internet is the original version. Change to from pyecharts.charts import Geo. Map is good!
The following calls Geo and Map classes to create instances, where the official methods are described:
def geo_virus() -> Geo:#Define a new function that inherits Geo!

    c = (
        Geo(init_opts=opts.InitOpts(theme=ThemeType.DARK))#Select Theme
        .add_schema(maptype="china")#Add China
        .add("",data,ChartType.EFFECT_SCATTER,#Select Map Type
        is_selected = True,symbol = None,symbol_size= 6,color="red")
        .set_series_opts(label_opts=opts.LabelOpts(is_show=False))
        .set_global_opts(visualmap_opts=opts.VisualMapOpts(is_piecewise=True,max_=1000,),#set up1000Is Maximum Threshold
        title_opts=opts.TitleOpts(title="Distribution Map of New Coronavirus Infection in Cities of China",   pos_left="300")#Title name and location, with a few more parameters, try it yourself
        )
    )

    return c
In the first line **-> ** a lot of people don't understand, it's just inheriting Geo first and writing less code.
Finally, the function is called to generate.html with the complete code as follows:
import os
import pandas as pd
from pyecharts import options as opts
from pyecharts.charts import Geo,Map
from pyecharts.globals import ChartType, SymbolType
from pyecharts.globals import ThemeType

Result=pd.DataFrame()
Result1=pd.DataFrame()
lst=os.listdir()
for f_name in lst:
    if f_name[-3:]=="csv":
        data = pd.read_csv(f_name)
        data_City=data["City"]
        data_Numbers=data["Number of confirmed cases"]
        Result1=pd.concat([data_City,data_Numbers], axis=1)
        Result = pd.concat([Result, Result1])

data=[]#Define a dataset
for i in range(len(Result)):
    turple=(Result.iat[i,0],int(Result.iat[i,1]))
    data.append(turple)
print(data)
def geo_virus() -> Geo:
    c = (
        Geo(init_opts=opts.InitOpts(theme=ThemeType.DARK))
        .add_schema(maptype="china")
        .add("",data,ChartType.EFFECT_SCATTER,#Select Map Type
        is_selected = True,symbol = None,symbol_size= 6,color="red")
        .set_series_opts(label_opts=opts.LabelOpts(is_show=False))
        .set_global_opts(visualmap_opts=opts.VisualMapOpts(is_piecewise=True,max_=1000,),
                         title_opts=opts.TitleOpts(title="Distribution Map of New Coronavirus Infection in Cities of China",
                                                                                                pos_left="300")
        )
    )
    return c

g=geo_virus()#Call this defined function
g.render('Distribution Map of New Coronavirus Infections in China.html')
The happiest time has come, and the results are as follows: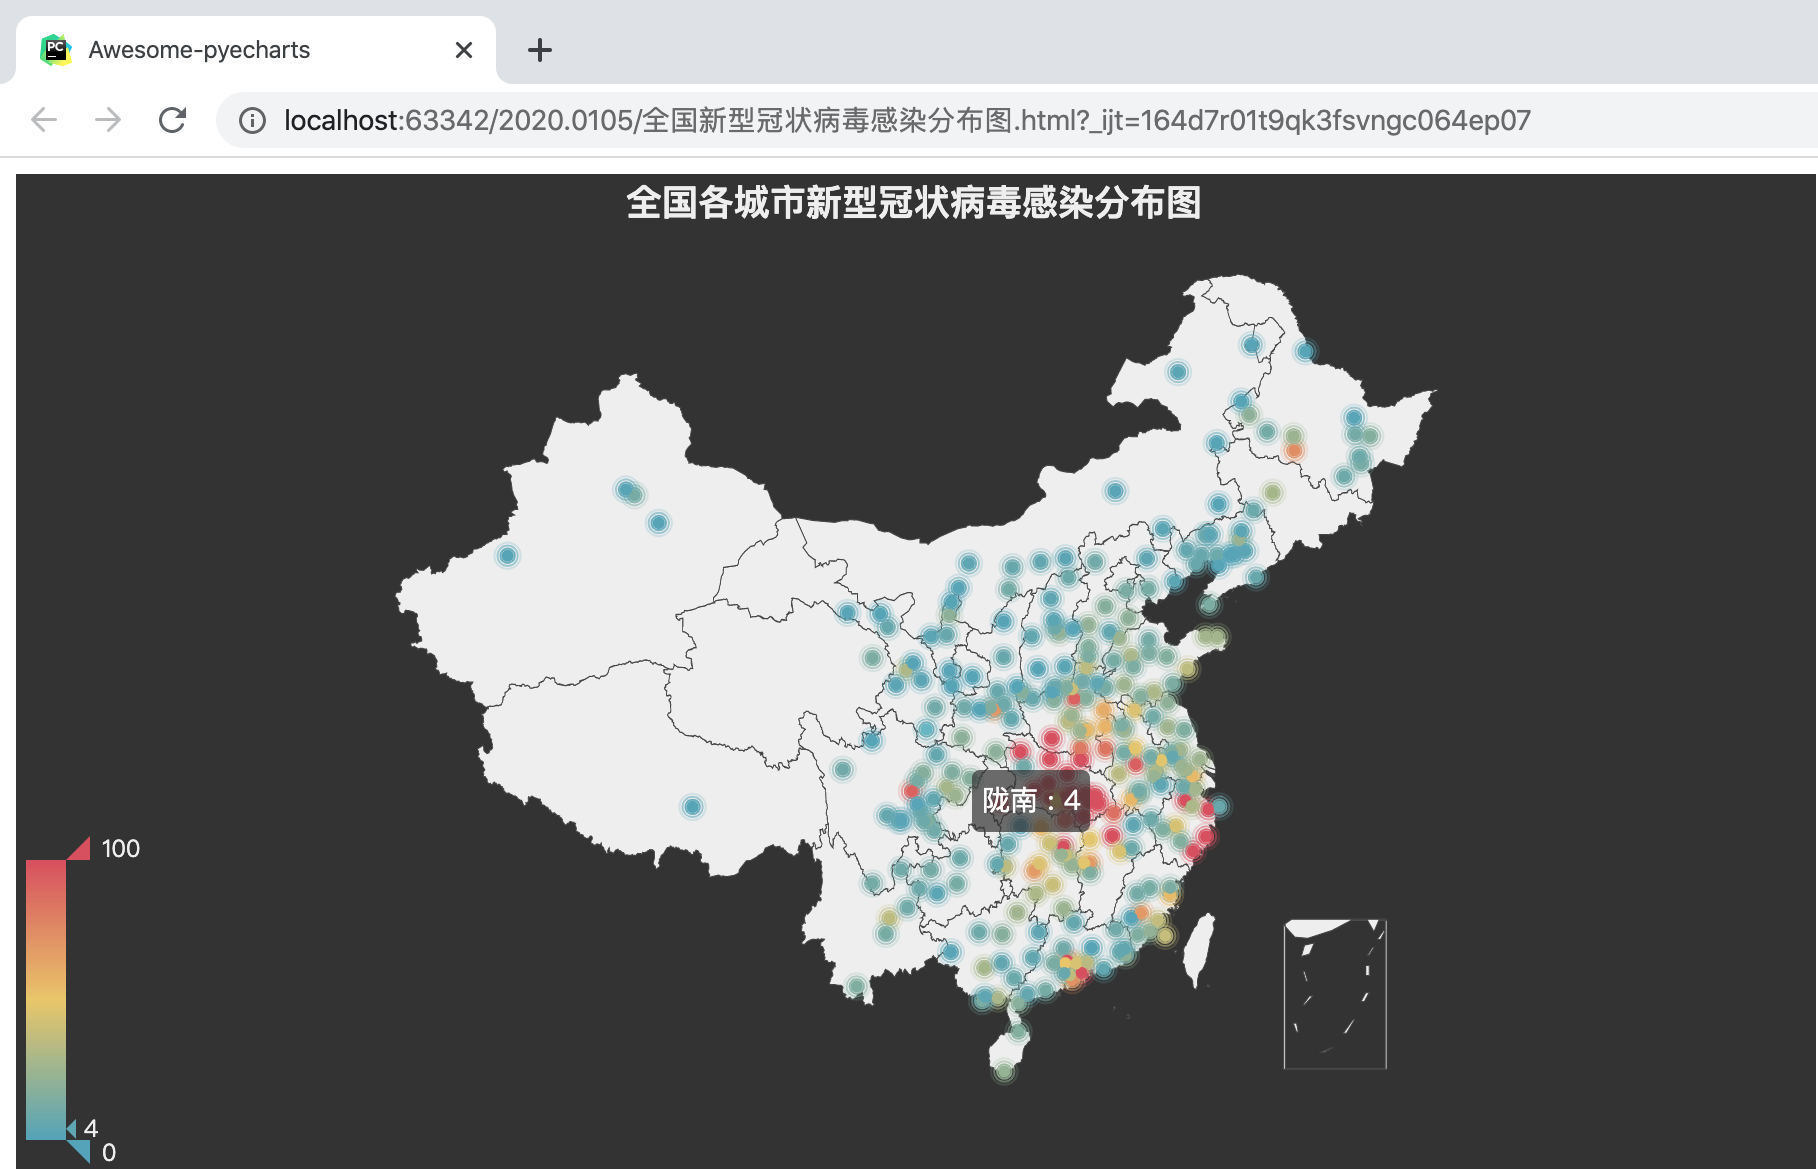
Now let's talk about how the graph we see every day does. Define a function as well:
def map_virus()  -> Map:
 c = (
     Map()
     .add("", [list(z) for z in zip(Faker.provinces, Faker.values())], "china")
     .set_global_opts(
         title_opts=opts.TitleOpts(title="Distribution Map of New Coronavirus Infections in Provinces of China"),
         visualmap_opts=opts.VisualMapOpts(max_=100),
     )
 )
 return c
g=map_virus()
Replace "list(z) for z in zip(Faker.provinces, Faker.values()" with a list of data for each province in the same format as above.Interested in your little friend to try it yourself!

