 This is my first time to write about reptiles. Although I have learned Python, it is only limited to dragonfly skimming the water. It really exceeds my experience and psychological expectation to make such a large amount of work. However, people always have to break through the comfort circle and make something to truly realize the happiness of creation. This writing process, almost from scratch, line by line to find a way, took a week to write 500 lines of code, and finally achieved the effect I want. But in fact, the total amount of code written is three times of this, but because I don't know very well, I've been trying various methods, and only 30% of the final methods can be achieved, so I have taken many detours. Then, I will introduce my specific writing process, the pit I stepped on, and my own solutions.
All the following codes are introduced one by one in order. Because they were not written in the way of encapsulating functions during the writing process, you can connect them together, which is the final appearance of my code. Inexperience, code is a little tedious, please forgive me.
The code is divided into four parts:
- Grab data
- Store data in database
- The standardized format needed to process data into maps
- Drawing
The first part is to grab data.
First, I will introduce all the modules I use.
import requests
import json
import pymysql
import xlwt as ExcelWrite
from xlwt import XFStyle, Pattern
import datetime
import time
from pyecharts import options as opts
from pyecharts.charts import Geo, Bar, Map
from pyecharts.render import make_snapshot
from tkinter import *
from snapshot_phantomjs import snapshot
import tkinter as tk
Note that there is a snapshot in it. Its function is to parse the images generated by PyEcharts into PNG format. You need to install something. You can search "how to generate images by PyEcharts" on this website.
Next, first build the database table. I built it directly in Navicat.
City table, which stores all kinds of data of all cities that Dr. lilac crawled to.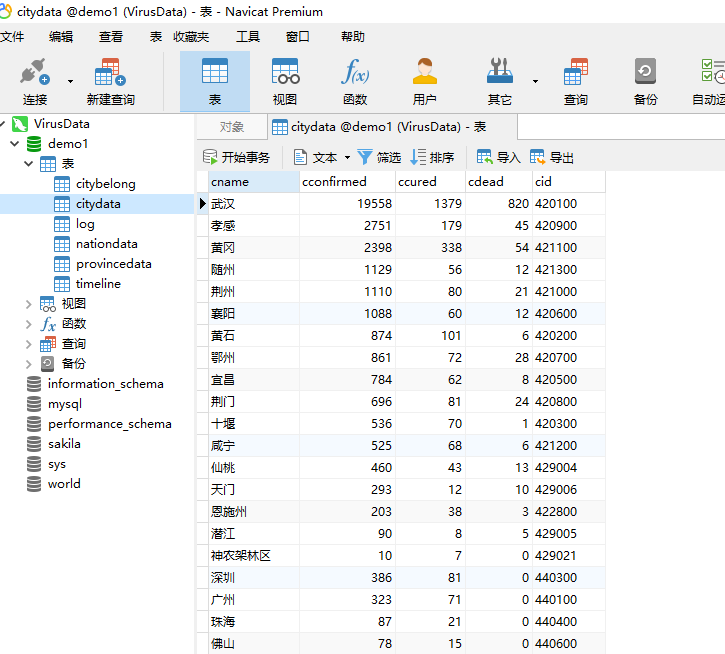
Province table, which stores data of all provinces.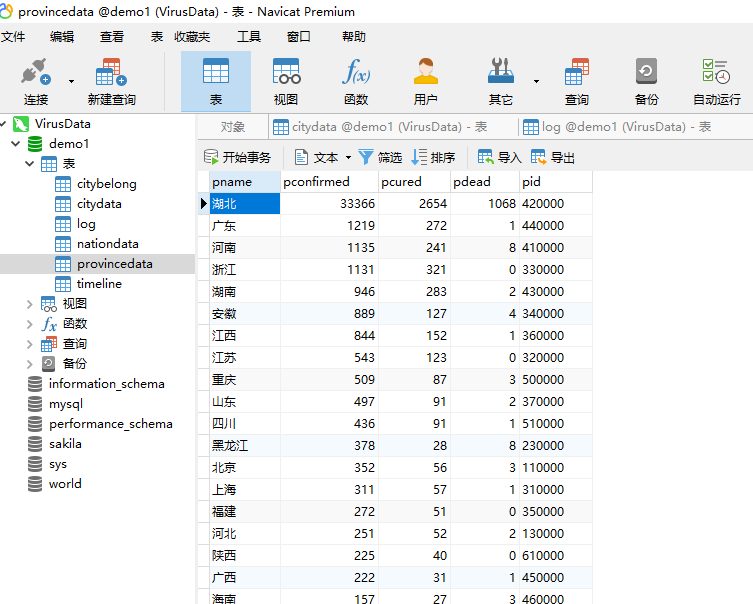
The national table records the total number of confirmed, cured and dead people in the country.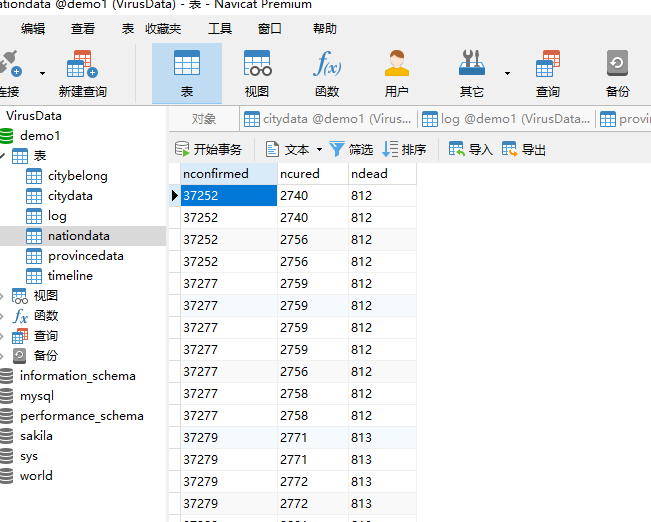
Newsheets, which store crawled real-time news, are created on demand and have no impact on our drawing.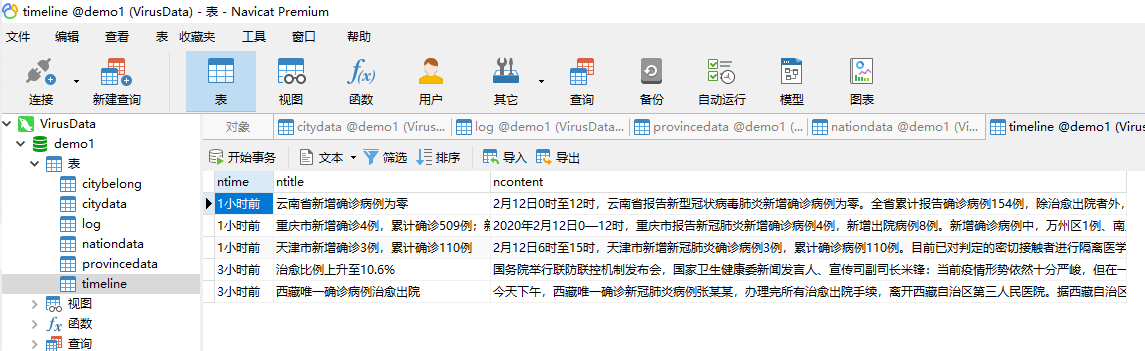
Log table, which records the logs of our crawlers, such as how long they have crawled and how much data they have crawled.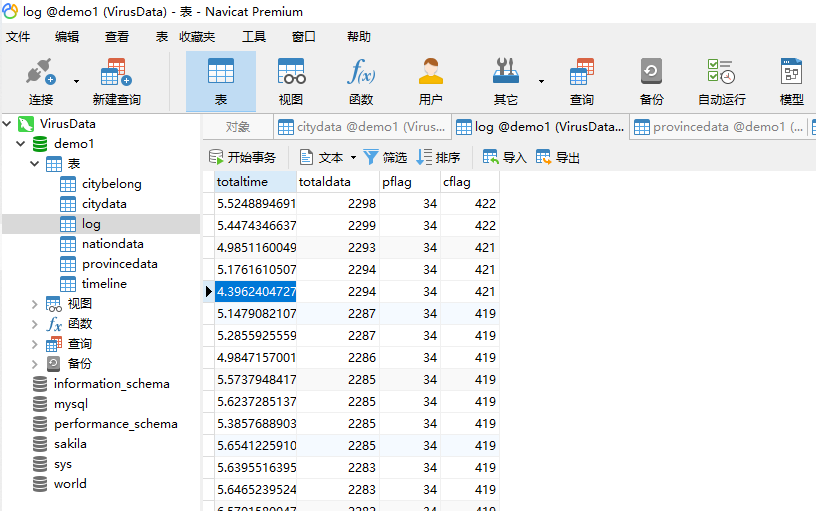
After the table is built, I choose to clear the contents of the table at the beginning. It's strange that there is no data to return. Why do I need to clear it? Because the data of the subsequent crawlers will be stored in the database one by one. In order to avoid crowding, I need to clear it before each climb.
db = pymysql.connect(host="localhost", user="Your user name", passwd="Your password", db="demo1", charset='utf8')
cursor = db.cursor()
sql_clear_citydata = 'truncate citydata'
cursor.execute(sql_clear_citydata)
sql_clear_provincedata = 'truncate provincedata'
cursor.execute(sql_clear_provincedata)
sql_clear_timeline = 'truncate timeline'
cursor.execute(sql_clear_timeline)
After clearing the city list, the province list and the news list, we can go crawling.
start_date = datetime.datetime.now()
start_second = time.time()
The purpose of these two sentences is to record the start time of the reptile.
url = "https://ncov.dxy.cn/ncovh5/view/pneumonia"
r = requests.get(url, timeout=20)
r.raise_for_status()
r.encoding = r.apparent_encoding
html = r.text
string_data = re.findall(r'window.getAreaStat = (.*?)}catch', html)[0]
province_combine = json.loads(string_data, encoding='utf-8')
string_timeline = re.findall(r'window.getTimelineService = (.*?)}catch', html)[0]
all_news_combine = json.loads(string_timeline, encoding='utf-8')
These lines of code are used to grab the data of Dr. Xiang's web page. His initial data is a large string.
Open Firefox, check the source code of Dr. lilac's webpage, and you will see these: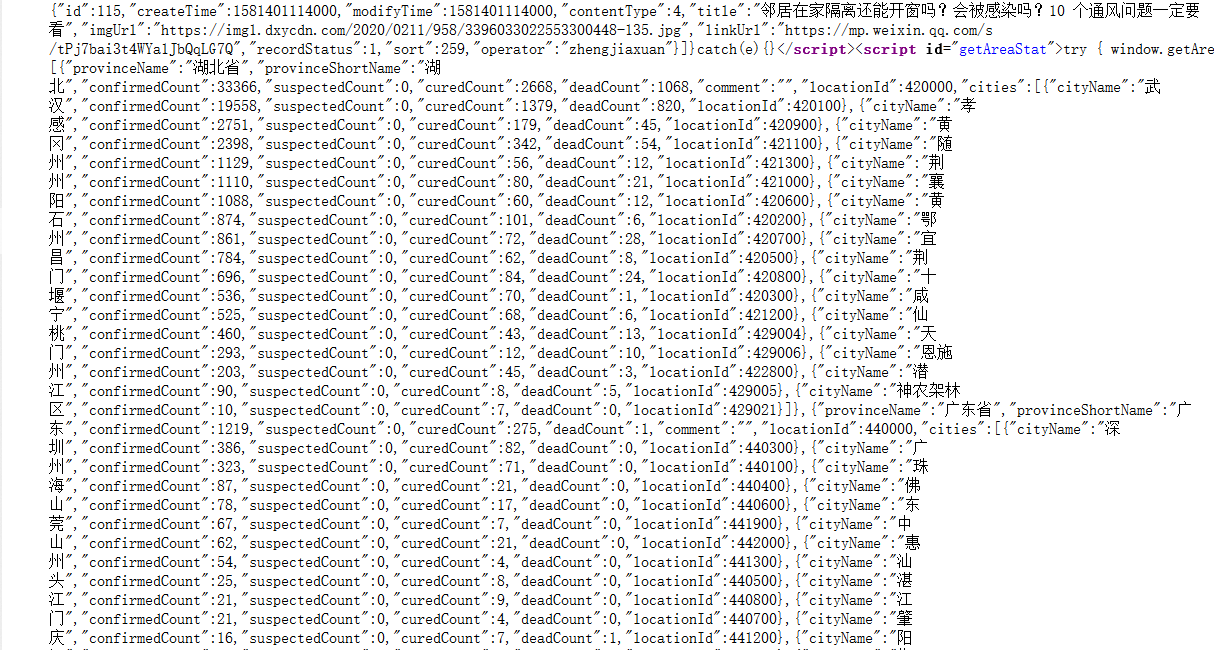
This is the goal of our crawling. Because it's a string, it's very simple. With regular expressions, the above lines of code can be implemented.
end_second = time.time()
end_date = datetime.datetime.now()
time_total = end_second - start_second
These sentences record the end time of the reptile and how long it took.
pdata_flag = 0
cdata_flag = 0
pname_list = []
pconfirmed_list = []
pcured_list = []
pdead_list = []
pid_list = []
cname_list = []
cconfirmed_list = []
ccured_list = []
cdead_list = []
cid_list = []
pconfirmed_geo = []
cconfirmed_geo = []
test_name = input("Please enter Province:")
for i in range(len(province_combine)):
    pdata_flag = pdata_flag+1
    province_single = province_combine[i]
    province_name = province_single['provinceShortName']
    if province_name == test_name:
        heilongjiang = province_combine[i]
    province_confirmed_count = province_single['confirmedCount']
    province_cured_count = province_single['curedCount']
    province_dead_count = province_single['deadCount']
    province_ID = province_single['locationId']
    pname_list.append(province_name)
    pconfirmed_list.append(province_confirmed_count)
    pcured_list.append(province_cured_count)
    pdead_list.append(province_dead_count)
    pid_list.append(province_ID)
    city_combine = province_single['cities']
    sql_add_into_provincedata = 'insert into %s(pname, pconfirmed, pcured, pdead, pid)' % 'provincedata' + 'value(%s,%s,%s,%s,%s)'
    cursor.execute(sql_add_into_provincedata,
                   [province_name, province_confirmed_count, province_cured_count, province_dead_count, province_ID])
    db.commit()
    for j in range(len(city_combine)):
        cdata_flag = cdata_flag + 1
        city_single = city_combine[j]
        city_name = city_single['cityName']
        city_confirmed_count = city_single['confirmedCount']
        city_cured_count = city_single['curedCount']
        city_dead_count = city_single['deadCount']
        city_ID = city_single['locationId']
        cname_list.append(city_name)
        cconfirmed_list.append(city_confirmed_count)
        ccured_list.append(city_cured_count)
        cdead_list.append(city_dead_count)
        cid_list.append(city_ID)
        sql_add_into_citydata = 'insert into %s(cname, cconfirmed, ccured, cdead, cid)' % 'citydata' +'value(%s,%s,%s,%s,%s)'
        cursor.execute(sql_add_into_citydata, [city_name, city_confirmed_count, city_cured_count, city_dead_count, city_ID])
        sql_add_into_citybelong = 'insert into %s(cityname, provincename)' % 'citybelong'+'value(%s,%s)'
        cursor.execute(sql_add_into_citybelong, [city_name, province_name])
        db.commit()
n_confirmed_data = 0
n_cured_data = 0
n_dead_data = 0
for i in range(len(pconfirmed_list)):
    n_confirmed_data = n_confirmed_data+pconfirmed_list[i]
for i in range(len(pcured_list)):
    n_cured_data = n_cured_data+pcured_list[i]
for i in range(len(pdead_list)):
    n_dead_data = n_dead_data+pdead_list[i]
sql_add_into_nationdata = 'insert into %s(nconfirmed, ncured, ndead)' % 'nationdata'+'value(%s,%s,%s)'
cursor.execute(sql_add_into_nationdata, [n_confirmed_data, n_cured_data, n_dead_data])
db.commit()
All kinds of operations look dazzled. In fact, they store the data into the tables of the corresponding database, and then generate a list of all the data. Why do I need a data type to create a list? Because it's necessary to draw a picture. At last, you will know. Of course, there are a lot of things in it that I might write too much.
news_flag = 0
news_time_list = []
news_title_list = []
file = open("news.txt", 'w')
for a in range(len(all_news_combine)):
    news_flag = news_flag+1
    province_news_combine = all_news_combine[a]
    news_time = province_news_combine['pubDateStr']
    news_title = province_news_combine['title']
    news_content = province_news_combine['summary']
    news_time_list.append(news_time)
    news_title_list.append(news_title)
    sql_add_into_timeline = 'insert into %s(ntime , ntitle, ncontent)' % 'timeline' + 'value(%s,%s,%s)'
    cursor.execute(sql_add_into_timeline, [news_time, news_title, news_content])
    db.commit()
    file.write(str(news_time))
    file.write(' ')
    file.write(str(news_title))
    file.write('\n')
file.close()
Write the news to the database and txt.
total_data = (pdata_flag+cdata_flag)*5+news_flag
sql_log = 'insert into %s(totaltime, totaldata, pflag, cflag)' % 'log' + 'value(%s,%s,%s,%s)'
cursor.execute(sql_log, [time_total, total_data, pdata_flag, cdata_flag])
db.commit()
xls = ExcelWrite.Workbook()
sheet1 = xls.add_sheet("Sheet1")
style1 = XFStyle()
pattern = Pattern()
pattern.pattern = Pattern.SOLID_PATTERN
pattern.pattern_fore_colour = 0x16
style1.pattern = pattern
province_data_list = ['Province', 'Diagnosis', 'Cure', 'death', 'ID']
for i in range(len(province_data_list)):
    sheet1.write(0, i, province_data_list[i], style1)
    sheet1.col(i).width = 5240
sheet2 = xls.add_sheet("Sheet2")
style2 = XFStyle()
pattern = Pattern()
pattern.pattern = Pattern.SOLID_PATTERN
pattern.pattern_fore_colour = 0x16
style2.pattern = pattern
city_data_list = ['City', 'Diagnosis', 'Cure', 'death', 'ID']
for i in range(len(city_data_list)):
    sheet2.write(0, i, city_data_list[i], style2)
    sheet2.col(i).width = 5240
sql_select_province_data = 'select * from provincedata'
cursor.execute(sql_select_province_data)
pdatabase_all_data = cursor.fetchall()
db.commit()

row = 0
for i in range(len(pdatabase_all_data)):
    pdata_single_info = pdatabase_all_data[i]
    row = row+1
    for a in range(len(pdata_single_info)):
        sheet1.write(row, a, pdata_single_info[a])
sql_select_city_data = 'select * from citydata'
cursor.execute(sql_select_city_data)
cdatabase_all_data = cursor.fetchall()
db.commit()
row = 0
for i in range(len(cdatabase_all_data)):
    cdata_single_info = cdatabase_all_data[i]
    row = row+1
    for j in range(len(cdata_single_info)):
        sheet2.write(row, j, cdata_single_info[j])
xls.save('Virus infection in China.xls')
It's actually very useful to write data into Excel. When you have a table, it's very convenient to view the data. You don't need to go to the database to see it. It's too cumbersome.
log_txt = open('log.txt', mode='a', encoding='utf-8')
print("******************************Crawler log******************************", file=log_txt)
print(start_date, "Start crawling", file=log_txt)
print("Automatic data capture succeeded. It has been stored in the database. The crawler process takes time", '%.2f' % time_total, 'second', file=log_txt)
print("A total of", pdata_flag, "Provincial administrative regions", cdata_flag, "Total of municipal units", (total_data), "Epidemic data", file=log_txt)
print(end_date, "End crawler", file=log_txt)
log_txt.close()
Write the crawler log to txt.
for i in range(len(cid_list)):
    if -1 in cid_list:
        p = cid_list.index(-1)
        cid_list.pop(p)
        cname_list.pop(p)
        cconfirmed_list.pop(p)
for i in range(len(cid_list)):
    if 0 in cid_list:
        p = cid_list.index(0)
        cid_list.pop(p)
        cname_list.pop(p)
        cconfirmed_list.pop(p)
for i in range(len(cname_list)):
    if 'Dehong' in cname_list:
        p = cname_list.index('Dehong')
        cid_list.pop(p)
        cname_list.pop(p)
        cconfirmed_list.pop(p)
for i in range(len(cname_list)):
    if 'Pu'er Tea' in cname_list:
        p = cname_list.index('Pu'er Tea')
        cid_list.pop(p)
        cname_list.pop(p)
        cconfirmed_list.pop(p)
for i in range(len(cname_list)):
    if 'Lingshui' in cname_list:
        p = cname_list.index('Lingshui')
        cid_list.pop(p)
        cname_list.pop(p)
        cconfirmed_list.pop(p)
for i in range(len(cname_list)):
    if 'Ledong' in cname_list:
        p = cname_list.index('Ledong')
        cid_list.pop(p)
        cname_list.pop(p)
        cconfirmed_list.pop(p)
for i in range(len(cname_list)):
    if 'Qiong Zhong' in cname_list:
        p = cname_list.index('Qiong Zhong')
        cid_list.pop(p)
        cname_list.pop(p)
        cconfirmed_list.pop(p)
for i in range(len(cname_list)):
    if 'Qiannan' in cname_list:
        p = cname_list.index('Qiannan')
        cid_list.pop(p)
        cname_list.pop(p)
        cconfirmed_list.pop(p)
for i in range(len(cname_list)):
    if 'Qiandongnan Prefecture' in cname_list:
        p = cname_list.index('Qiandongnan Prefecture')
        cid_list.pop(p)
        cname_list.pop(p)
        cconfirmed_list.pop(p)
for i in range(len(cname_list)):
    if 'Qianxi' in cname_list:
        p = cname_list.index('Qianxi')
        cid_list.pop(p)
        cname_list.pop(p)
        cconfirmed_list.pop(p)
for i in range(len(cname_list)):
    if 'Yanbian' in cname_list:
        p = cname_list.index('Yanbian')
        cid_list.pop(p)
        cname_list.pop(p)
        cconfirmed_list.pop(p)
for i in range(len(cname_list)):
    if 'Yili Prefecture' in cname_list:
        p = cname_list.index('Yili Prefecture')
        cid_list.pop(p)
        cname_list.pop(p)
        cconfirmed_list.pop(p)
You may be confused about this operation. What is it, or for drawing. For the map of pyecharts, your city name needs to be standardized. For example, Yanbian, which can't work. Pyecharts doesn't recognize it. You have to write it as Yanbian Korean Autonomous Prefecture. Of course, in order to save time, I will delete the data of this city temporarily. -1 and 0 are the ID of a city. The ID of a normal city is 455644. But there are "areas to be determined" in Dr. Xiang's data. This is not a place at all. Its ID is - 1. The map certainly doesn't recognize it, so it's deleted directly.
pconfirmed_geo = list(zip(pname_list, pconfirmed_list))
cconfirmed_geo = list(zip(cname_list, cconfirmed_list))
hei_city_combine = heilongjiang['cities']
hei_city_name_list = []
hei_city_confirmed_list = []
hei_id_list = []
for i in range(len(hei_city_combine)):
    hei_city_sigle = hei_city_combine[i]
    hei_city_name = hei_city_sigle['cityName']
    hei_city_confirmed = hei_city_sigle['confirmedCount']
    hei_id = hei_city_sigle['locationId']
    hei_id_list.append(hei_id)
    hei_city_name_list.append(hei_city_name)
    hei_city_confirmed_list.append(hei_city_confirmed)
This step is to sort out the data needed to draw the map. Hei city is the name of each city corresponding to the province you entered. However, as you may expect, many of the names in these cities are not standardized, but this can not be deleted. It doesn't matter if you delete one or two in the whole country, because it shows the macro data of the whole province. Here, Dr. Xiang, the provincial data is separate from the data of each city, so it's OK for you to delete the city data. However, we need to draw maps of each province, and then the information of each city will be displayed. It's not right for you to delete the real map of a city. So, we have to normalize these names.
if test_name == 'Beijing':
    hei_end_name_list = hei_city_name_list
if test_name == 'Shanghai':
    hei_end_name_list = hei_city_name_list
if test_name == 'Tianjin':
    hei_end_name_list = hei_city_name_list
if test_name == 'Chongqing':
    hei_end_name_list = ['Liangping County' if i == 'Liangping District' else 'Wulong County' if i == 'Wulong District' else 'pengshui miao and tujia autonomous county ' if i == 'Pengshui County' else 'Xiushan Tujia and Miao Autonomous County ' if i == 'Xiushan County' else 'Youyang Tujia and Miao Autonomous County ' if i == 'Youyang County' else 'Shizhu Tujia Autonomous County ' if i == 'Shizhu County' else str(i)  for i in hei_city_name_list]
if test_name == 'Hainan':
    hei_end_name_list = ['Changjiang Li Autonomous County' if i == 'Changjiang' else 'Ding An county' if i == 'Ding An' else'Changjiang Li Autonomous County' if i == 'Changjiang' else 'Lingao County' if i == 'ascend a height' else'Chengmai County' if i == 'Chengmai' else 'Baoting Li and Miao Autonomous County' if i == 'Baoting' else 'Lingshui Li Autonomous County ' if i == 'Lingshui' else 'Qiongzhong Li and Miao Autonomous County' if i == 'Qiong Zhong' else 'Ledong Li Autonomous County ' if i == 'Ledong'else str(i)+"city" for i in hei_city_name_list]
if test_name == 'Heilongjiang':
    hei_end_name_list = ['Daxinganling area' if i == 'Greater Khingan Range' else str(i)+"city" for i in hei_city_name_list]
if test_name == 'Liaoning':
    hei_end_name_list = [str(i)+"city" for i in hei_city_name_list]
if test_name == 'Hebei':
    hei_end_name_list = [str(i)+"city" for i in hei_city_name_list]
if test_name == 'Henan':
    hei_end_name_list = [str(i)+"city" for i in hei_city_name_list]
if test_name == 'Jilin':
    hei_end_name_list = ['Yanbian Korean Autonomous Prefecture' if i == 'Yanbian' else 'Siping City' if i == 'Siping City' else 'Jilin City' if i== 'Jilin City' else str(i)+"city" for i in hei_city_name_list]
if test_name == 'Inner Mongolia':
    hei_end_name_list = ['Xingan Meng' if i == 'Xingan Meng' else 'Xilingol League' if i == 'Xilingol League' else str(i)+"city" for i in hei_city_name_list]
if test_name == 'Xinjiang':
    hei_end_name_list = ['Wu Jia Qu city' if i == 'Wujiaqu City, the sixth division of the Corps' else 'Shihezi City' if i == 'Shihezi City, the eighth division of the Corps' else 'Changji Hui Autonomous Prefecture' if i == 'changji' else 'Tacheng area' if i == 'Tacheng area' else 'Bayingolin Mongolian Autonomous Prefecture' if i == 'Bazhou' else 'Ili Kazak Autonomous Prefecture' if i == 'Yili Prefecture' else 'Turpan City' if i == 'Turpan City' else 'Aksu Region' if i == 'Aksu Region' else str(i)+"city" for i in hei_city_name_list]
if test_name == 'Tibet':
    hei_end_name_list = [str(i) + "city" for i in hei_city_name_list]
if test_name == 'Qinghai':
    hei_end_name_list = ['Haibei Tibetan Autonomous Prefecture' if i == 'Haibei Prefecture' else str(i) + "city" for i in hei_city_name_list]
if test_name == 'Shandong':
    hei_end_name_list = [str(i) + "city" for i in hei_city_name_list]
if test_name == 'Shanxi':
    hei_end_name_list = [str(i) + "city" for i in hei_city_name_list]
if test_name == 'Shaanxi':
    hei_end_name_list = [str(i) + "city" for i in hei_city_name_list]
if test_name == 'Gansu':
    hei_end_name_list = [str(i) + "city" for i in hei_city_name_list]
if test_name == 'Hubei':
    hei_end_name_list = ['Enshi Tujia and Miao Autonomous Prefecture ' if i == 'enshi' else'Shennongjia Forestry District ' if i == 'Shennongjia Forestry District ' else str(i) + "city" for i in hei_city_name_list]
if test_name == 'Hunan':
    hei_end_name_list = ['Xiangxi Tujia and Miao Autonomous Prefecture' if i == 'Xiangxi Autonomous Prefecture' else str(i) + "city" for i in hei_city_name_list]
if test_name == 'Yunnan':
    hei_end_name_list = [ 'Honghe Hani and Yi Autonomous Prefecture' if i == 'Honghe Prefecture' else 'Xishuangbanna Dai Autonomous Prefecture' if i == 'Xishuangbanna' else 'Dehong Dai Jingpo Autonomous Prefecture' if i == 'Dehong' else 'Dali Bai Autonomous Prefecture' if i == 'Dali Prefecture' else 'Chuxiong Yi Autonomous Prefecture' if i == 'Chuxiong' else 'Wenshan Zhuang and Miao Autonomous Prefecture' if i == 'Wenshan Prefecture'  else str(i) + "city" for i in hei_city_name_list]
if test_name == 'Guizhou':
    hei_end_name_list = ['Qiandongnan Miao and Dong Autonomous Prefecture' if i == 'Qiandongnan Prefecture' else 'Qiannan Buyi and Miao Autonomous Prefecture' if i == 'Qiannan' else 'Qianxinan Buyei and Miao Autonomous Prefecture ' if i == 'Qianxi' else str(i) + "city" for i in hei_city_name_list]
if test_name == 'Sichuan':
    hei_end_name_list = ['Ganzi Tibetan Autonomous Prefecture' if i == 'The state of Gansu' else 'Liangshan Yi Autonomous Prefecture' if i == 'Liangshan Prefecture' else 'Aba Tibetan and Qiang Autonomous Prefecture' if i == 'Aba Prefecture' else str(i) + "city" for i in hei_city_name_list]
if test_name == 'Fujian':
    hei_end_name_list = [str(i) + "city" for i in hei_city_name_list]
if test_name == 'Jiangsu':
    hei_end_name_list = [str(i) + "city" for i in hei_city_name_list]
if test_name == 'Jiangxi':
    hei_end_name_list = [str(i) + "city" for i in hei_city_name_list]
if test_name == 'Anhui':
    hei_end_name_list = [str(i) + "city" for i in hei_city_name_list]
if test_name == 'Guangdong':
    hei_end_name_list = [str(i) + "city" for i in hei_city_name_list]
if test_name == 'Guangxi':
    hei_end_name_list = [str(i) + "city" for i in hei_city_name_list]
if test_name == 'Zhejiang':
    hei_end_name_list = [str(i) + "city" for i in hei_city_name_list]
if test_name == 'Ningxia':
    hei_end_name_list = [str(i) + "city" for i in hei_city_name_list]
Normalize the names of every city, so that the map can be understood, and he will accept you. Otherwise, one of the names is wrong, and he will not give you a picture. For example: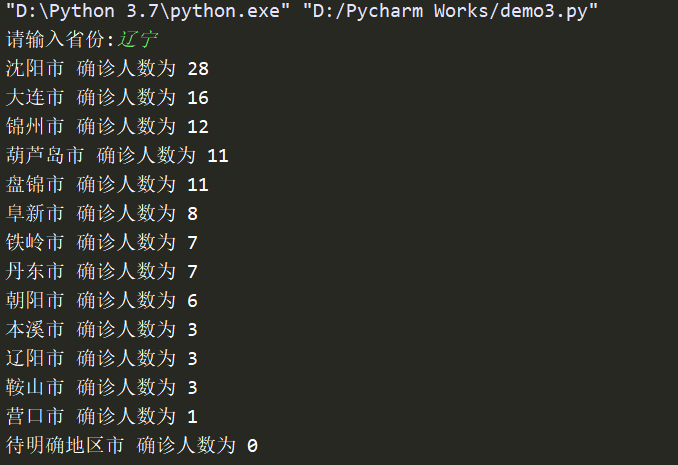
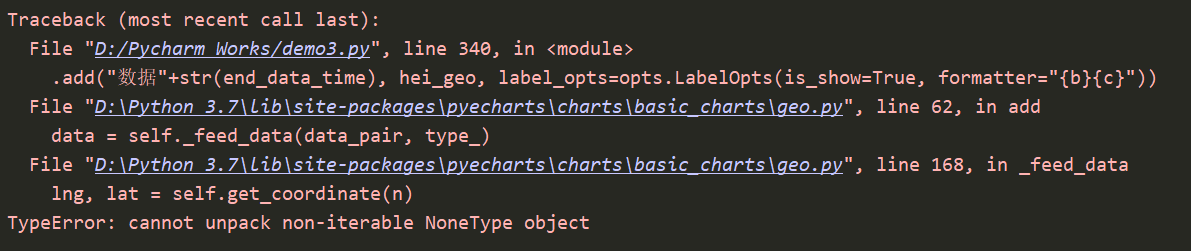
Because there's a "waiting area," he's on strike.
hei_all = 0
for i in range(len(hei_city_confirmed_list)):
    hei_all = hei_all+ hei_city_confirmed_list[i]
    print(hei_end_name_list[i], "The number of confirmed cases is", hei_city_confirmed_list[i])
print("_________________________")
print(str(test_name)+"The total number of confirmed cases in the province is",hei_all)
print("**************************Crawler log**************************")
print(start_date, "Start crawling")
print("Automatic data capture succeeded. It has been stored in the database. The whole process takes time", '%.2f' % time_total, 'second')
print("A total of", pdata_flag, "Provincial administrative regions", cdata_flag, "Total of municipal units", (total_data), "Epidemic data")
print(end_date, "End crawler")
print("********************Pictures are automatically generated into folders******************")
These are the statements used to output data in the background after you input the province you want to find, as well as the crawler log.
for i in range(len(hei_id_list)):
    if -1 in hei_id_list:
        p = hei_id_list.index(-1)
        hei_id_list.pop(p)
        hei_end_name_list.pop(p)
        hei_city_confirmed_list.pop(p)
for i in range(len(hei_id_list)):
    if 0 in hei_id_list:
        p = hei_id_list.index(0)
        hei_id_list.pop(p)
        hei_end_name_list.pop(p)
        hei_city_confirmed_list.pop(p)
hei_geo = [[hei_end_name_list[i], hei_city_confirmed_list[i]] for i in range(len(hei_end_name_list))]
Delete the wrong city ID, and get the list of the last map we want to draw.
now_data_time = time.strftime('%m-%d %H', time.localtime())
end_data_time = str('By ')+now_data_time+str('Time')
These two sentences are to record the current time, so that when you draw a picture, the title can directly use it to say, when is the data of XXX Province map up to.
bar1 = (
    Geo()
    .add_schema(maptype = test_name, itemstyle_opts=opts.ItemStyleOpts(color='#404a59'))
    .add("data"+str(end_data_time), hei_geo, label_opts=opts.LabelOpts(is_show=True, formatter="{b}{c}"))
    .set_series_opts(label_opts=opts.LabelOpts(is_show=True, formatter="{b}{c}"), type='heatmap')
    .set_global_opts(
        visualmap_opts=opts.VisualMapOpts(max_=5, is_piecewise=False),
        title_opts=opts.TitleOpts(title=str(test_name)+"Thermal map of new coronavirus epidemic situation")
)
    )
make_snapshot(snapshot, bar1.render(), str(test_name)+"Thermodynamic chart.png")
bar1.render(str(test_name)+"Thermodynamic chart.html")
Let me show you the effect.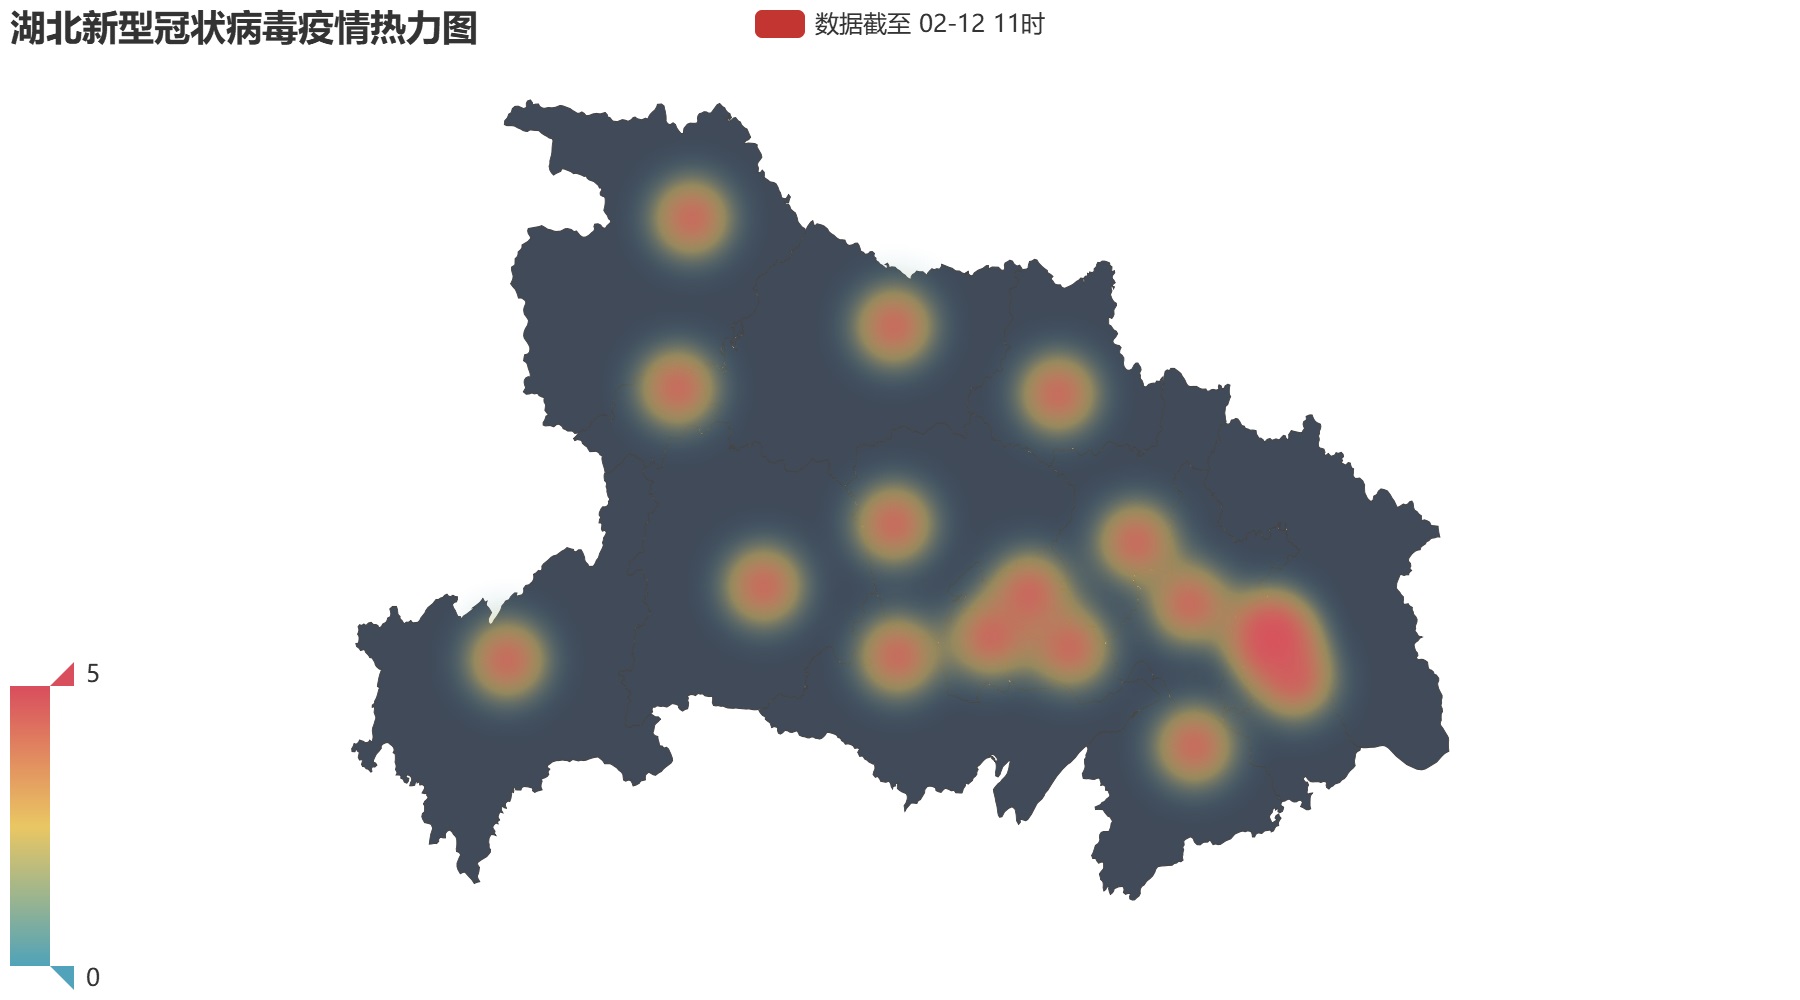
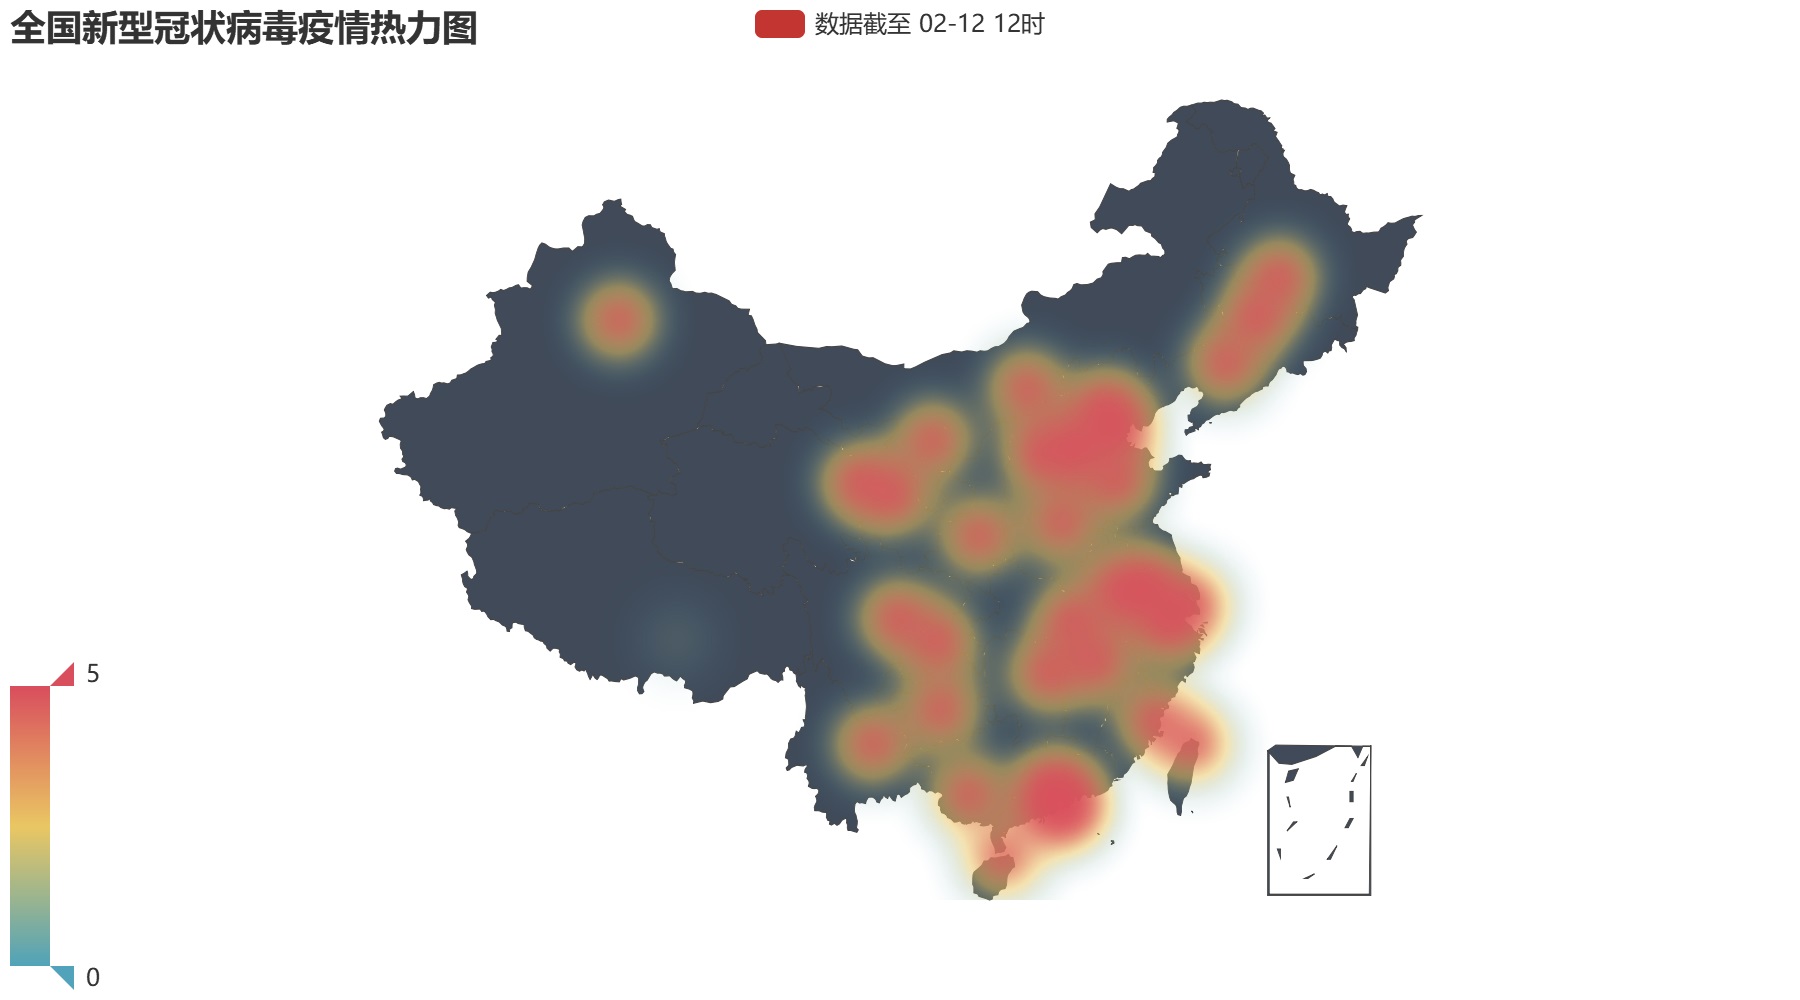
bar13 = (
    Geo()
    .add_schema(maptype='china', itemstyle_opts=opts.ItemStyleOpts(color='#404a59'))
    .add("data"+str(end_data_time), pconfirmed_geo, label_opts=opts.LabelOpts(is_show=True, formatter="{b}{c}"))
    .set_series_opts(label_opts=opts.LabelOpts(is_show=True, formatter="{b}{c}"), type='heatmap')
    .set_global_opts(
        visualmap_opts=opts.VisualMapOpts(max_=5, is_piecewise=False),
        title_opts=opts.TitleOpts(title="National thermal map of new coronavirus epidemic situation")
)
    )
make_snapshot(snapshot, bar13.render(), "National heat map.png")
bar13.render("National heat map.html")
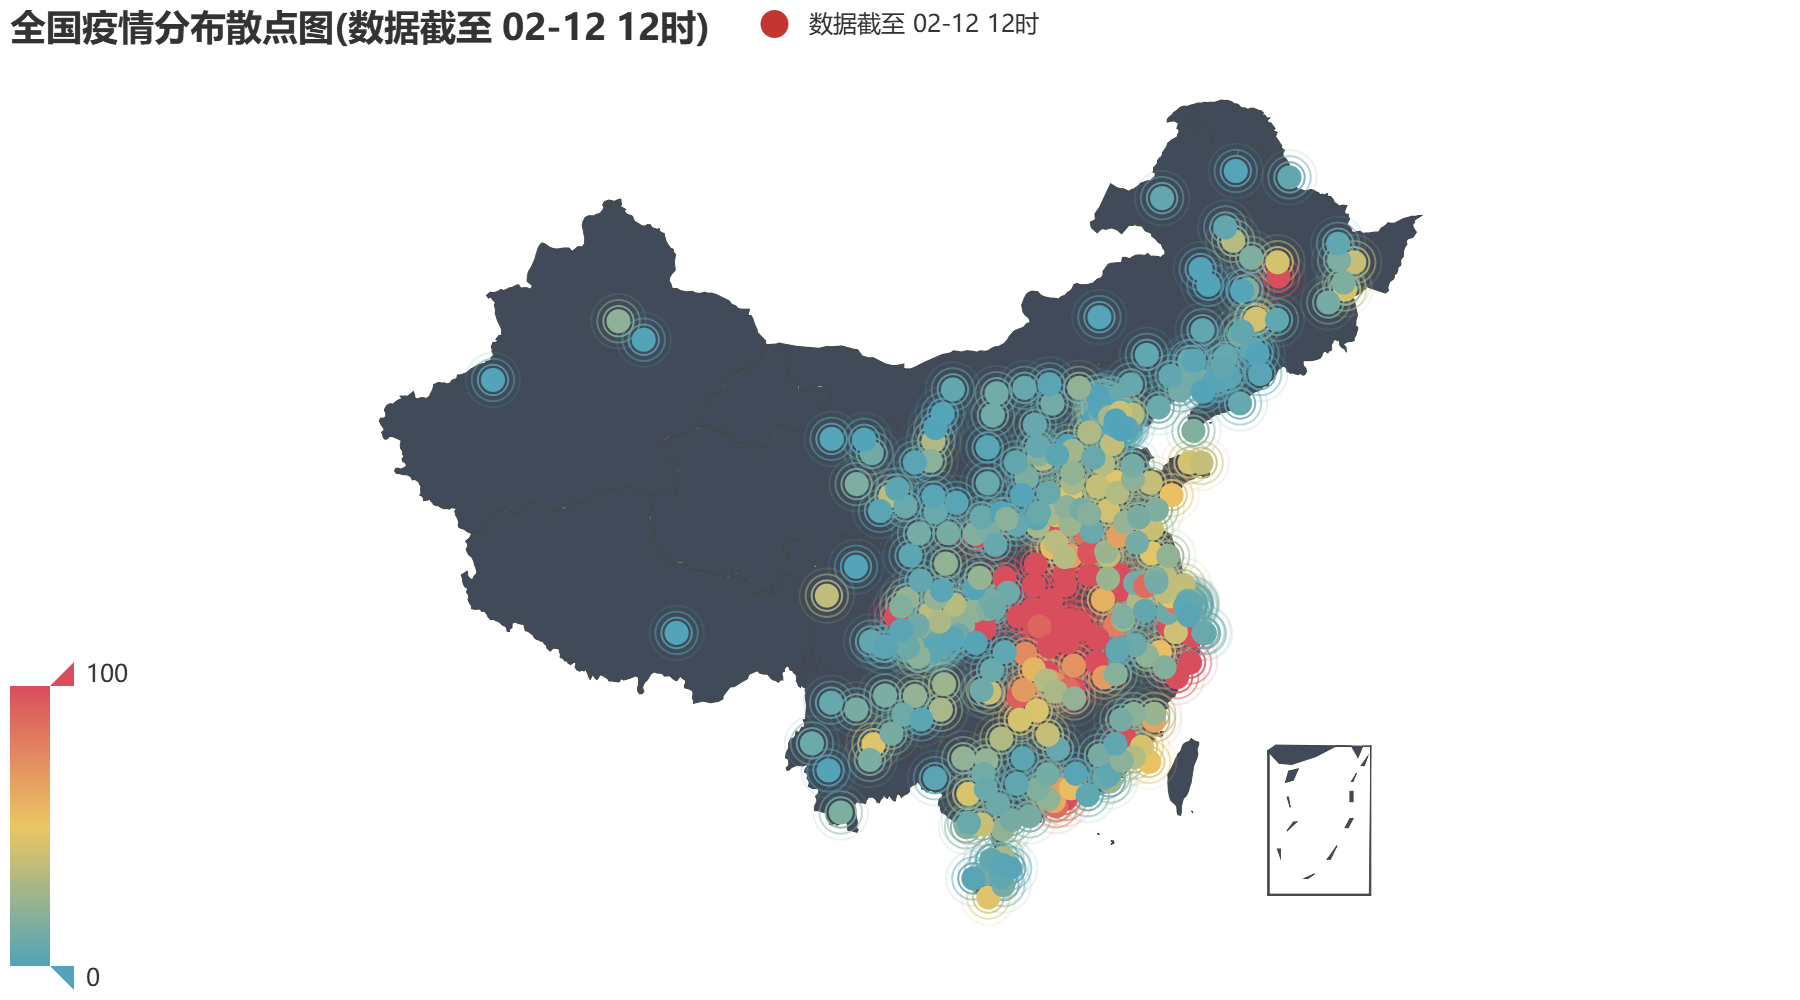
bar11 = (
    Geo()
    .add_schema(maptype="china", itemstyle_opts=opts.ItemStyleOpts(color='#404a59'))
    .add("data"+str(end_data_time), cconfirmed_geo)
    .set_series_opts(label_opts=opts.LabelOpts(is_show=False, formatter="{c}"), type='effectScatter')
    .set_global_opts(
        visualmap_opts=opts.VisualMapOpts(is_piecewise=False),
        title_opts=opts.TitleOpts(title="Scattered map of national epidemic situation"+"(data"+str(end_data_time)+")")
        )
    )
make_snapshot(snapshot, bar11.render(), "National scatter map.png")
bar11.render("National scatter map.html")

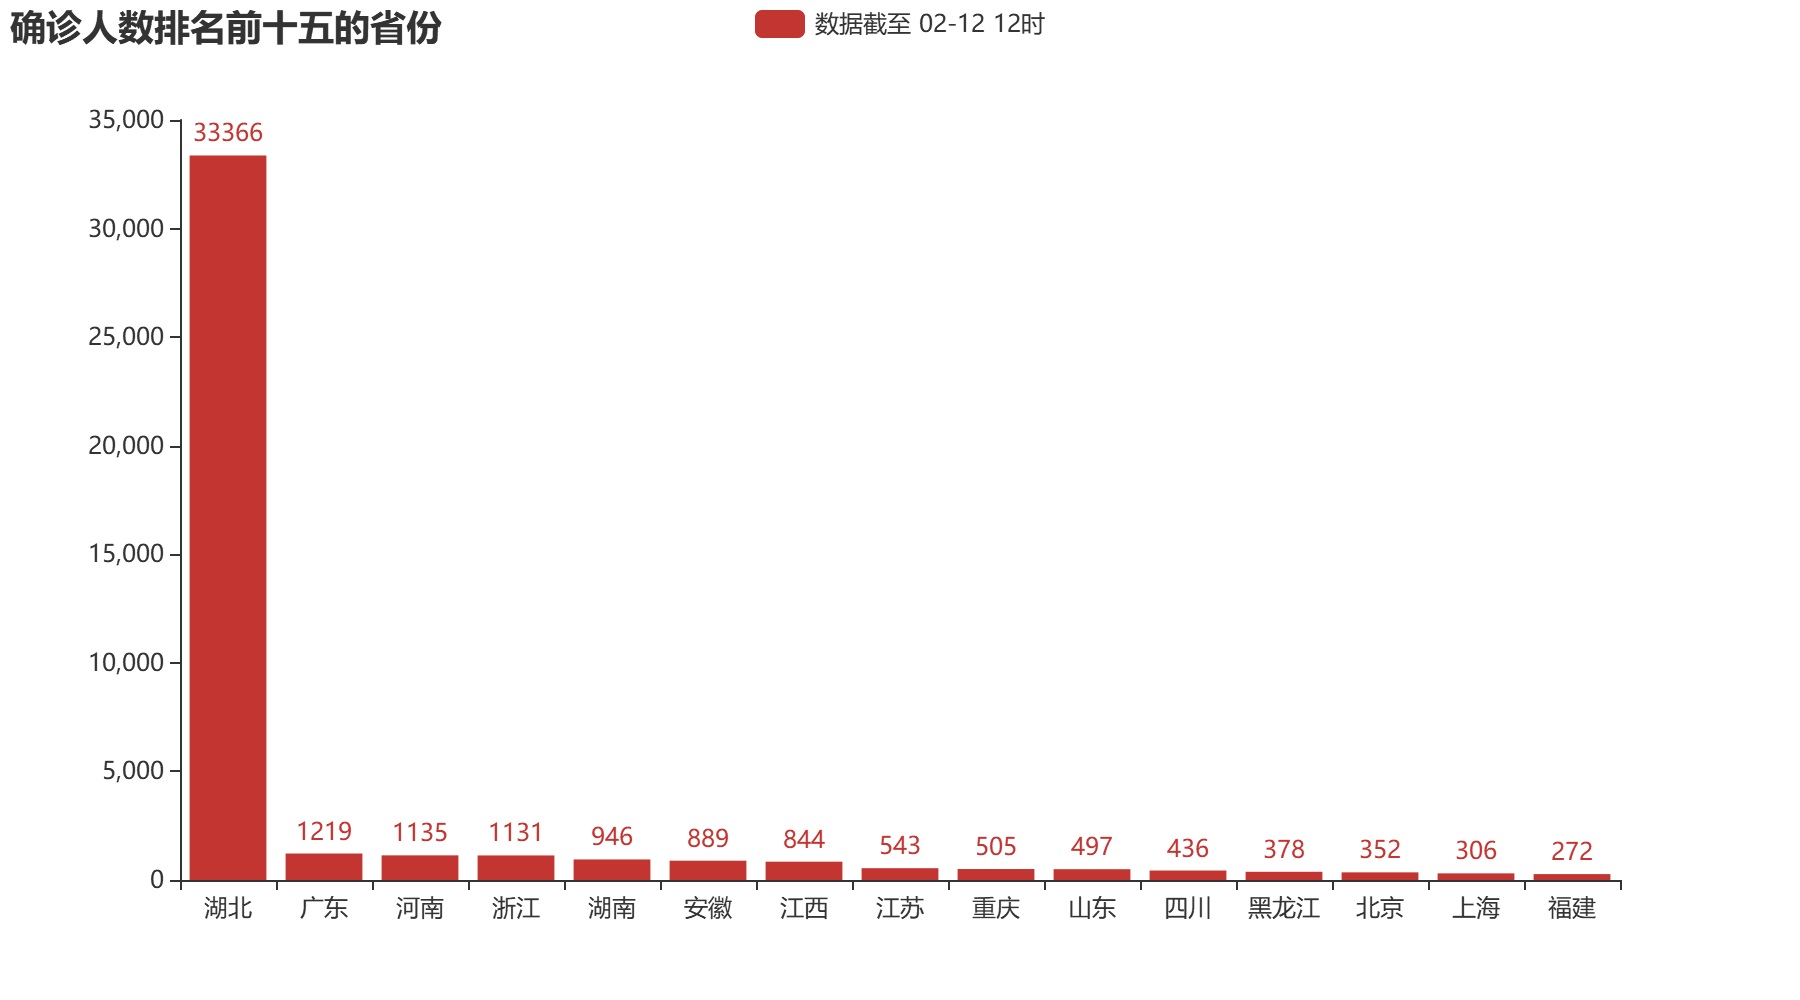
pname_list = pname_list[:15]
pconfirmed_list = pconfirmed_list[:15]
bar2 = (
    Bar()
    .add_xaxis(pname_list)
    .add_yaxis("data"+str(end_data_time), pconfirmed_list)
    .set_series_opts(label_opts=opts.LabelOpts(position="top"))
    .set_global_opts(title_opts=opts.TitleOpts(title="Top 15 provinces in the number of confirmed cases")
    )
)
make_snapshot(snapshot, bar2.render(), "Histogram of the top 15 provinces.png")
bar2.render("Histogram of the top 15 provinces.html")
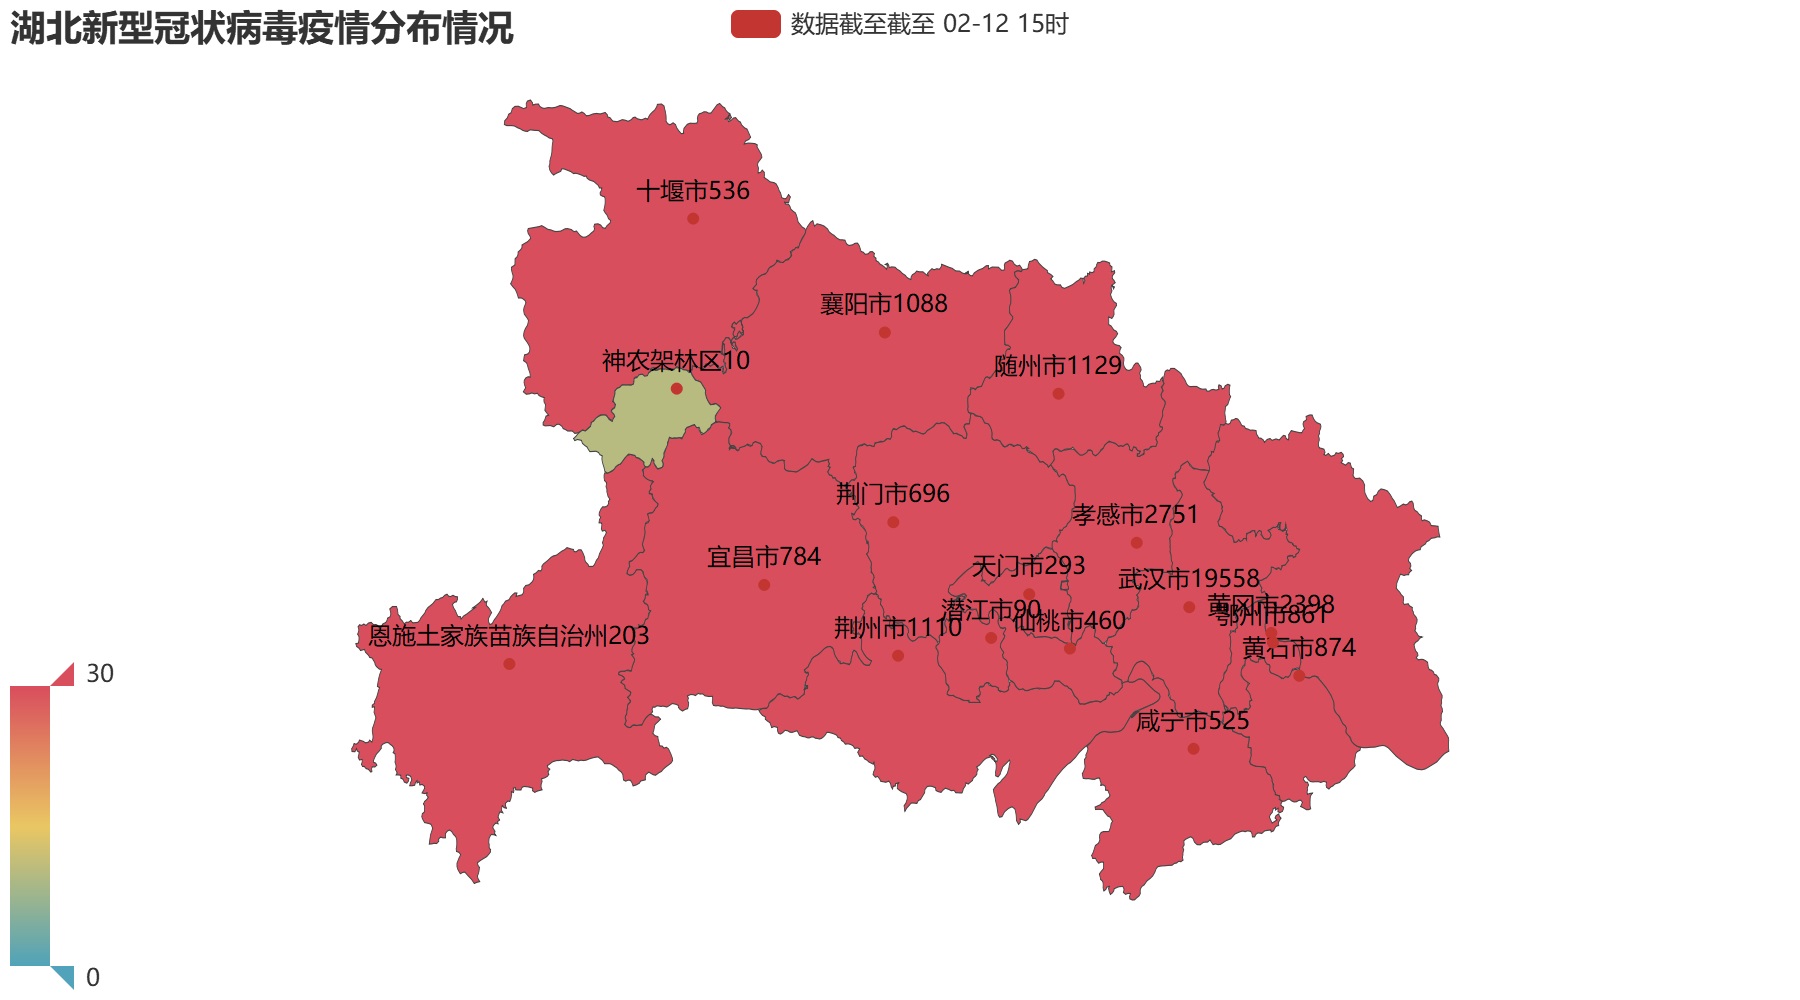
map_1 = Map()
map_1.set_global_opts(
    title_opts=opts.TitleOpts(title=str(test_name)+"Distribution of new coronavirus epidemic situation"),
    visualmap_opts=opts.VisualMapOpts(max_=30, is_piecewise=False)
    )
map_1.add(
    "Data up to date"+str(end_data_time), hei_geo, maptype=test_name,
    label_opts=opts.LabelOpts(is_show=True, formatter="{b}{c}")
    )
make_snapshot(snapshot, map_1.render(), str(test_name)+"Distribution situation.png")
map_1.render(str(test_name)+"Distribution situation.html")
map_2 = Map()
map_2.set_global_opts(
    title_opts=opts.TitleOpts(title="Distribution of new coronavirus in China"),
    visualmap_opts=opts.VisualMapOpts(is_piecewise=True, pieces=[
        {"max": 99999, "min": 900, "label": ">900"},
        {"max": 899, "min": 400, "label": "400-899"},
        {"max": 399, "min": 100, "label": "100-399"},
        {"max": 99, "min": 10, "label": "10-99"},
        {"max": 9, "min": 1, "label": "1-9"}
        ])
    )
map_2.add(
    "data"+str(end_data_time), pconfirmed_geo, maptype='china',
    label_opts=opts.LabelOpts(is_show=True, formatter="{b}{c}")
    )
make_snapshot(snapshot, map_2.render(), "National distribution.png")
map_2.render("National distribution.html")

Note that Pyecharts can only generate pictures in PNG and GIF format, JPG is not allowed, otherwise an error will be reported.
Next, it's optional to pop up these things in the window automatically.
win1 = tk.Tk()
win1.geometry('1360x700')
win1.title('Visualization system of new coronavirus epidemic situation')
Label(win1, text=str(end_data_time)+'   The number of new coronaviruses diagnosed in China is'+str(n_confirmed_data)+'   The death toll is'+str(n_dead_data), font=("Microsoft YaHei", 18), fg='black').pack()
img_gif1 = tk.PhotoImage(file='National distribution.png')
label_img1 = tk.Label(win1, image=img_gif1)
label_img1.pack()
win1.mainloop()

win2 = tk.Tk()
win2.geometry('1360x700')
win2.title('Visualization system of new coronavirus epidemic situation')
Label(win2, text=str(end_data_time)+'   The number of new coronaviruses diagnosed in China is'+str(n_confirmed_data)+'   The death toll is'+str(n_dead_data), font=("Microsoft YaHei", 18), fg='black').pack()
img_gif2 = tk.PhotoImage(file='Histogram of the top 15 provinces.png')
label_img2 = tk.Label(win2, image=img_gif2)
label_img2.pack()
win2.mainloop()

win3 = tk.Tk()
win3.geometry('1360x700')
win3.title('Visualization system of new coronavirus epidemic situation')
Label(win3, text=str(end_data_time)+'   The number of new coronaviruses diagnosed in China is'+str(n_confirmed_data)+'   The death toll is'+str(n_dead_data), font=("Microsoft YaHei", 18), fg='black').pack()
img_gif3 = tk.PhotoImage(file='National heat map.png')
label_img3 = tk.Label(win3, image=img_gif3)
label_img3.pack()
win3.mainloop()

win4 = tk.Tk()
win4.geometry('1360x700')
win4.title('Visualization system of new coronavirus epidemic situation')
Label(win4, text=str(end_data_time)+'   The number of new coronaviruses diagnosed in China is'+str(n_confirmed_data)+'   The death toll is'+str(n_dead_data), font=("Microsoft YaHei", 18), fg='black').pack()
img_gif4 = tk.PhotoImage(file='National scatter map.png')
label_img4 = tk.Label(win4, image=img_gif4)
label_img4.pack()
win4.mainloop()

win5 = tk.Tk()
win5.geometry('1360x700')
win5.title('Visualization system of new coronavirus epidemic situation')
Label(win5, text=str(end_data_time)+str(test_name)+'The number of new coronaviruses was confirmed.'+str(hei_all), font=("Microsoft YaHei", 18), fg='black').pack()
img_gif5 = tk.PhotoImage(file=str(test_name)+'Distribution situation.png')
label_img5 = tk.Label(win5, image=img_gif5)
label_img5.pack()
win5.mainloop()

win6 = tk.Tk()
win6.geometry('1360x700')
win6.title('Visualization system of new coronavirus epidemic situation')
Label(win6, text=str(end_data_time)+str(test_name)+'The number of new coronaviruses was confirmed.'+str(hei_all), font=("Microsoft YaHei", 18), fg='black').pack()
img_gif6 = tk.PhotoImage(file=str(test_name)+'Thermodynamic chart.png')
label_img6 = tk.Label(win6, image=img_gif6)
label_img6.pack()
win6.mainloop()
These are all the pictures I generated.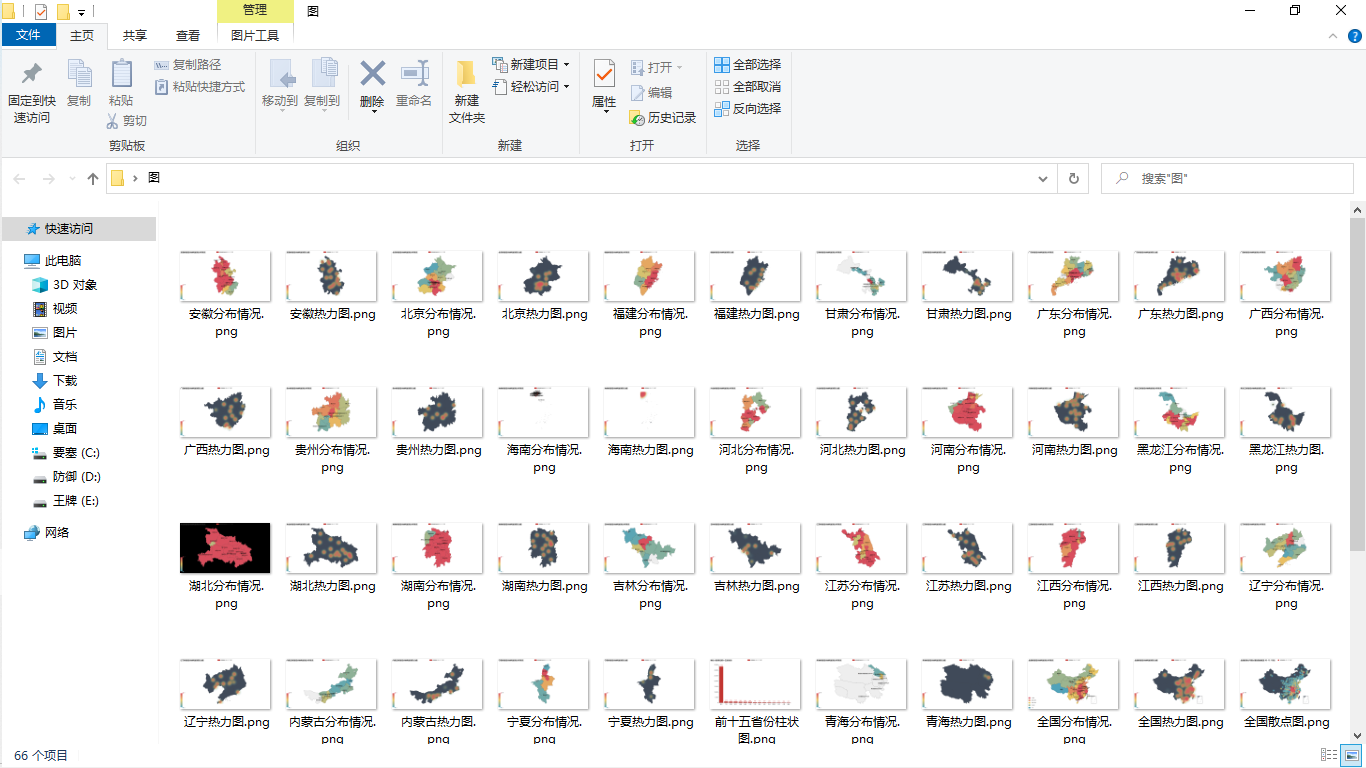
Finally, thank you for reading. Leave me a message if you have any questions.

