From: https://www.cnblogs.com/du-hong/p/11764517.html
brief introduction
After the last cosmetic and plastic surgery, some customers asked if they could upgrade the package of that ordinary member and make it more beautiful. So this time let's see where we can make it a little more beautiful.
The previous article modified some basic ReportNG information, links: Java automation test framework-05 - to make up the whole shape of your test report - (I) , this article will continue to take you to modify, the focus is to add pie chart, will be upgraded from ordinary members to VIP members.
After the recovery of the last cosmetic surgery, brother Hong continued to lead his friends and students to struggle and give reportng a second operation.
The first knife
1. Modify the test result order and the TestResultComparator class compare method
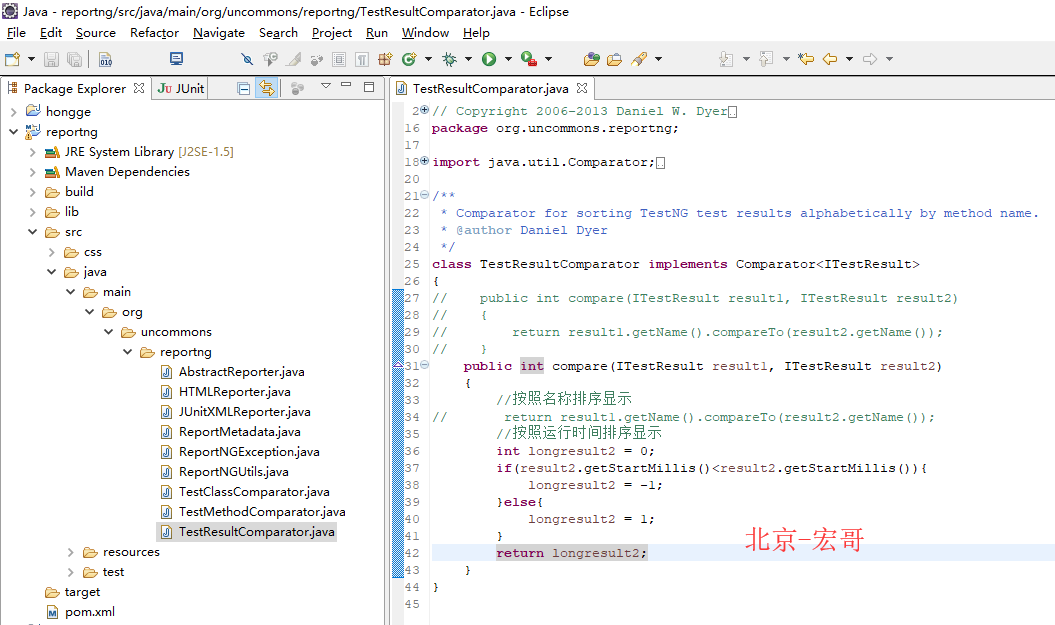
2. Reference code
//=============================================================================
// Copyright 2006-2013 Daniel W. Dyer
//
// Licensed under the Apache License, Version 2.0 (the "License");
// you may not use this file except in compliance with the License.
// You may obtain a copy of the License at
//
//     http://www.apache.org/licenses/LICENSE-2.0
//
// Unless required by applicable law or agreed to in writing, software
// distributed under the License is distributed on an "AS IS" BASIS,
// WITHOUT WARRANTIES OR CONDITIONS OF ANY KIND, either express or implied.
// See the License for the specific language governing permissions and
// limitations under the License.
//=============================================================================
package org.uncommons.reportng;

import java.util.Comparator;
import org.testng.ITestResult;

/**
 * Comparator for sorting TestNG test results alphabetically by method name.
 * @author Daniel Dyer
 */
class TestResultComparator implements Comparator<ITestResult>
{
//    public int compare(ITestResult result1, ITestResult result2)
//    {
//        return result1.getName().compareTo(result2.getName());
//    }
    public int compare(ITestResult result1, ITestResult result2)
    {
        //Sort display by name
//         return result1.getName().compareTo(result2.getName());
        //Sort display by run time
        int longresult2 = 0;
        if(result2.getStartMillis()<result2.getStartMillis()){
            longresult2 = -1;
        }else{
            longresult2 = 1;
        }
        return longresult2;
    }
}
Second knife
1. Add pie chart in overview.html.vm
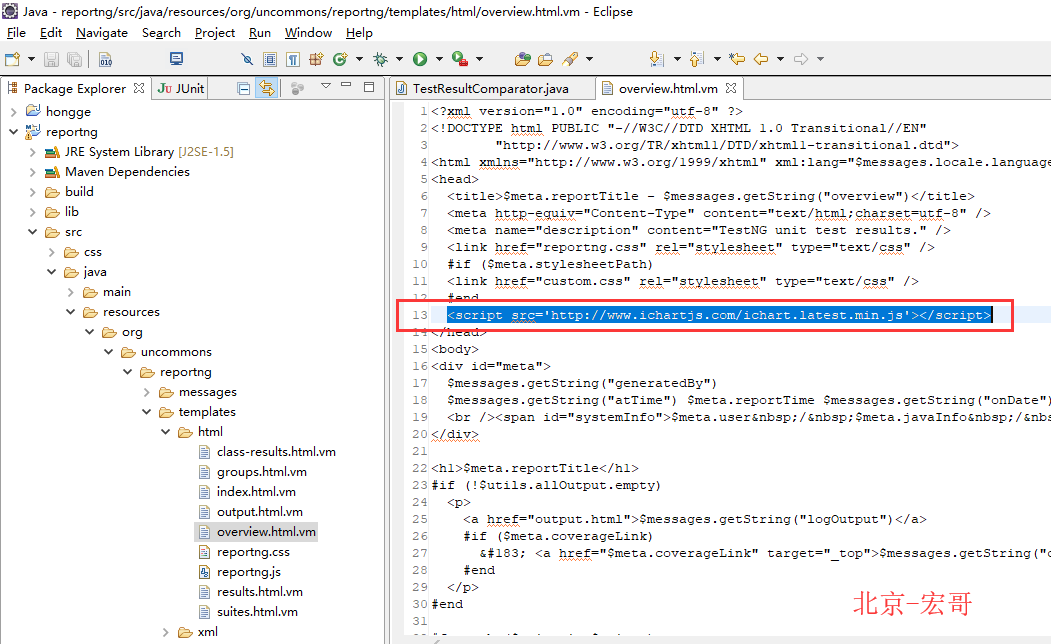
2. Reference code
<script src='http://www.ichartjs.com/ichart.latest.min.js'></script>
The third knife
1. Continue to add in overview.html.vm
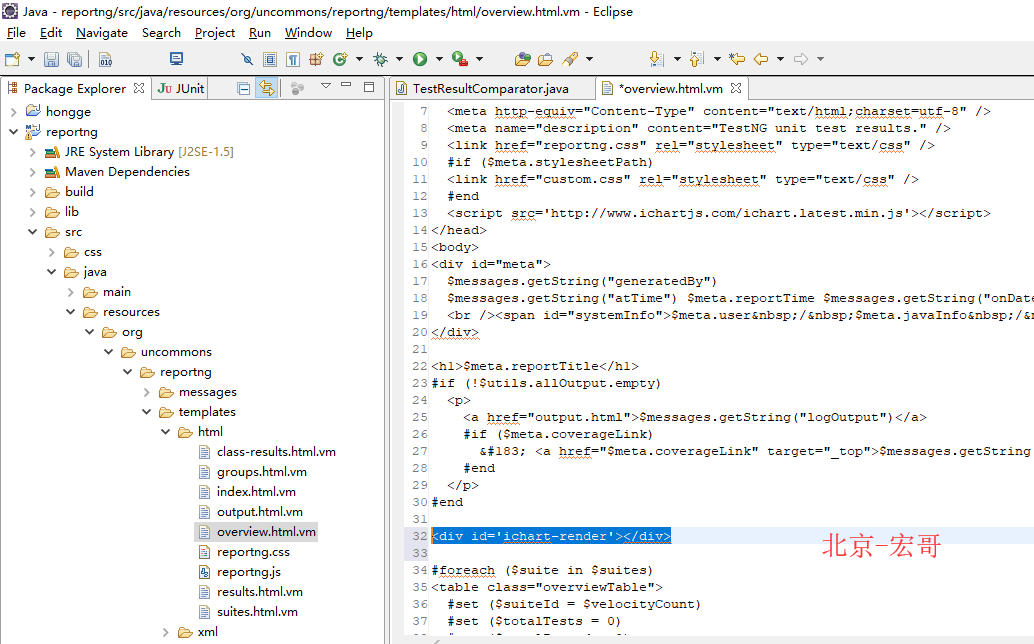
2. Reference code
<div id='ichart-render'></div>
The fourth knife
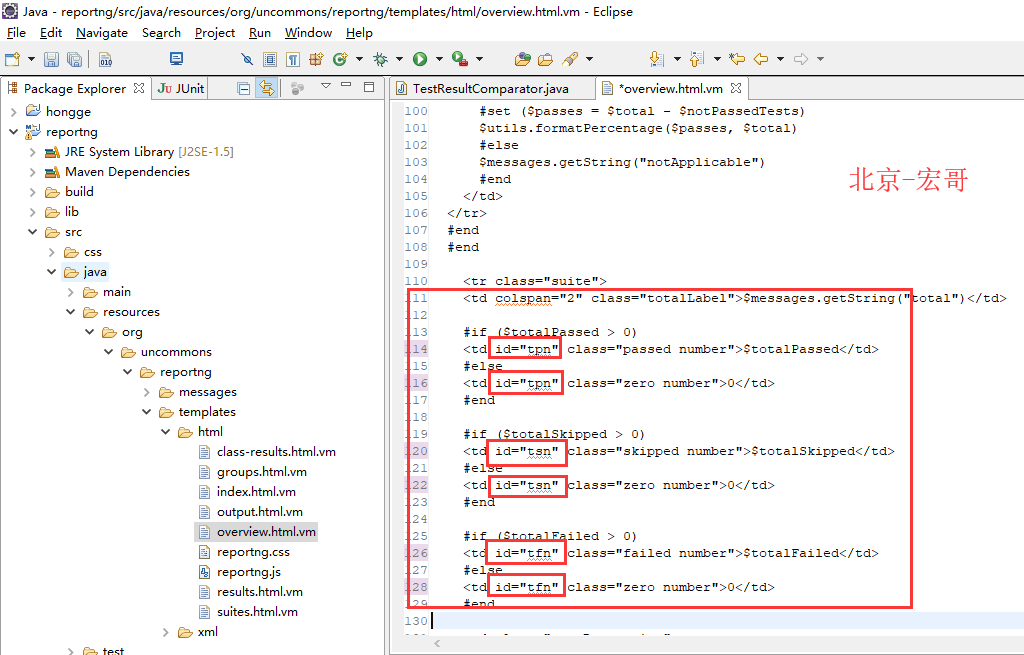
1. Add id attribute to the total number of passes, failures and skips before < td class = "passrate suite" > find "if" ($totalpassed > 0). Add id attribute to td tag as follows:
Fifth blade
1. Add the js code of pie chart before < / body >
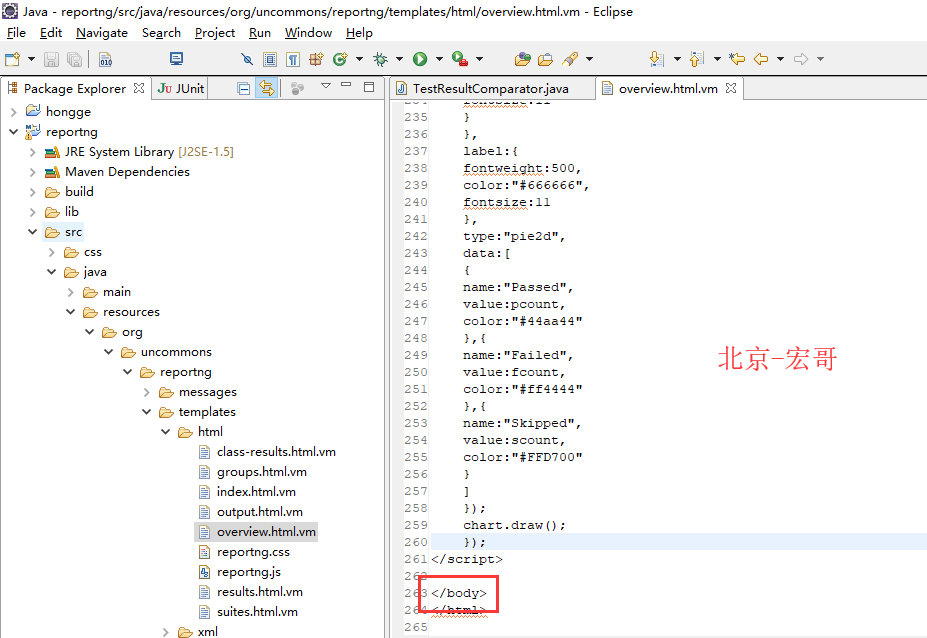
2. Reference code
<script type='text/javascript'>
    pcount=document.getElementById("tpn").innerHTML;
    fcount=document.getElementById("tfn").innerHTML;
    scount=document.getElementById("tsn").innerHTML;
    $(function(){
    var chart = iChart.create({
    render:"ichart-render",
    width:800,
    height:400,
    background_color:"#fefefe",
    gradient:false,
    color_factor:0.2,
    border:{
    color:"BCBCBC",
    width:0
    },
    align:"center",
    offsetx:0,
    offsety:0,
    sub_option:{
    border:{
    color:"#BCBCBC",
    width:1
    },
    label:{
    fontweight:500,
    fontsize:11,
    color:"#4572a7",
    sign:"square",
    sign_size:12,
    border:{
    color:"#BCBCBC",
    width:1
    }
    }
    },
    shadow:true,
    shadow_color:"#666666",
    shadow_blur:2,
    showpercent:false,
    column_width:"70%",
    bar_height:"70%",
    radius:"90%",
    subtitle:{
    text:"",
    color:"#111111",
    fontsize:16,
    font:"Microsoft YaHei ",
    textAlign:"center",
    height:20,
    offsetx:0,
    offsety:0
    },
    footnote:{
    text:"",
    color:"#111111",
    fontsize:12,
    font:"Microsoft YaHei ",
    textAlign:"right",
    height:20,
    offsetx:0,
    offsety:0
    },
    legend:{
    enable:false,
    background_color:"#fefefe",
    color:"#333333",
    fontsize:12,
    border:{
    color:"#BCBCBC",
    width:1
    },
    column:1,
    align:"right",
    valign:"center",
    offsetx:0,
    offsety:0
    },
    coordinate:{
    width:"80%",
    height:"84%",
    background_color:"#ffffff",
    axis:{
    color:"#a5acb8",
    width:[1,"",1,""]
    },
    grid_color:"#d9d9d9",
    label:{
    fontweight:500,
    color:"#666666",
    fontsize:11
    }
    },
    label:{
    fontweight:500,
    color:"#666666",
    fontsize:11
    },
    type:"pie2d",
    data:[
    {
    name:"Passed",
    value:pcount,
    color:"#44aa44"
    },{
    name:"Failed",
    value:fcount,
    color:"#ff4444"
    },{
    name:"Skipped",
    value:scount,
    color:"#FFD700"
    }
    ]
    });
    chart.draw();
    });
</script>
Bandage and suture
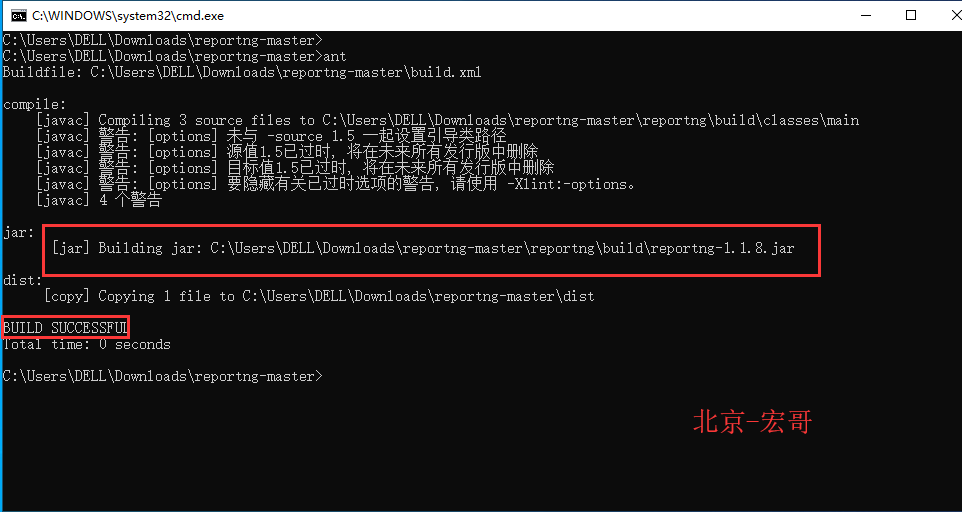
This time, Hongge will give you another way to export jar s through ant. The installation and configuration of ant can be seen in the previous article, which will not be covered here.
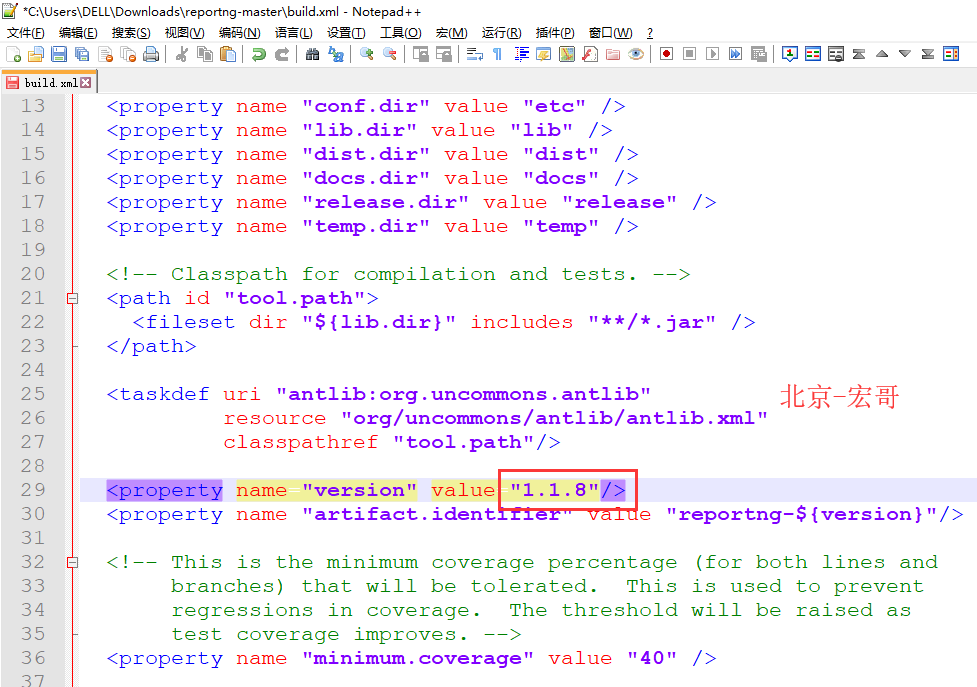
1. Enter the code directory and change the jar package version of build.xml to 1.1.8
2. Export the jar package. success.
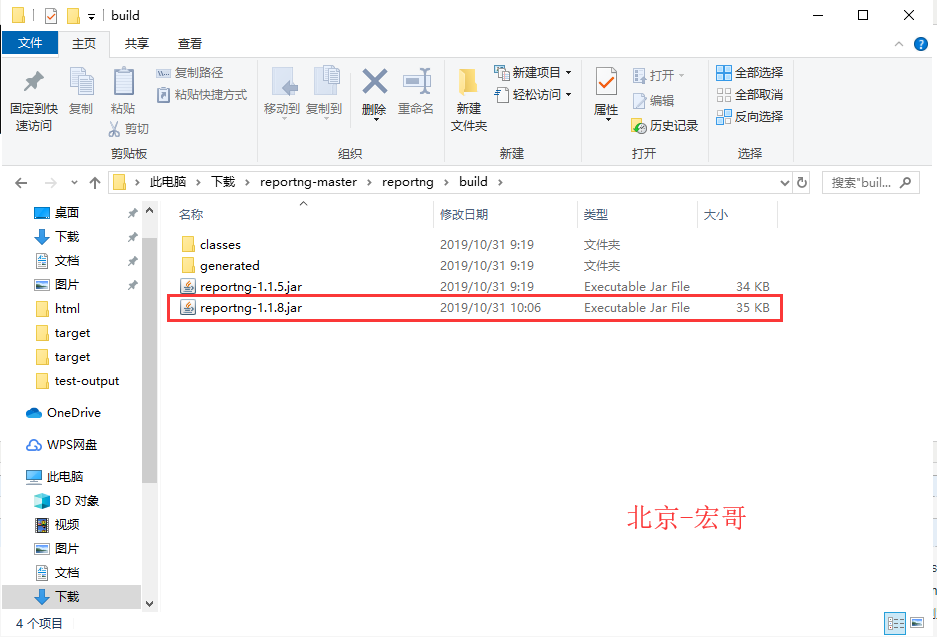
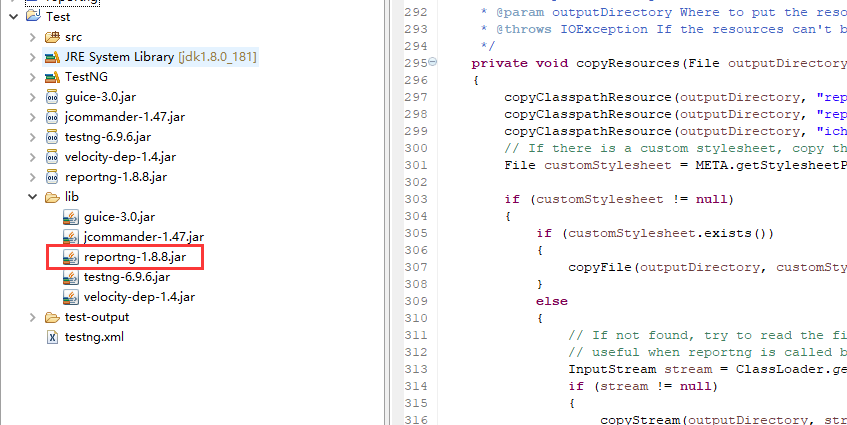
3. Where can I find the jar package.
4. New project references jar package.
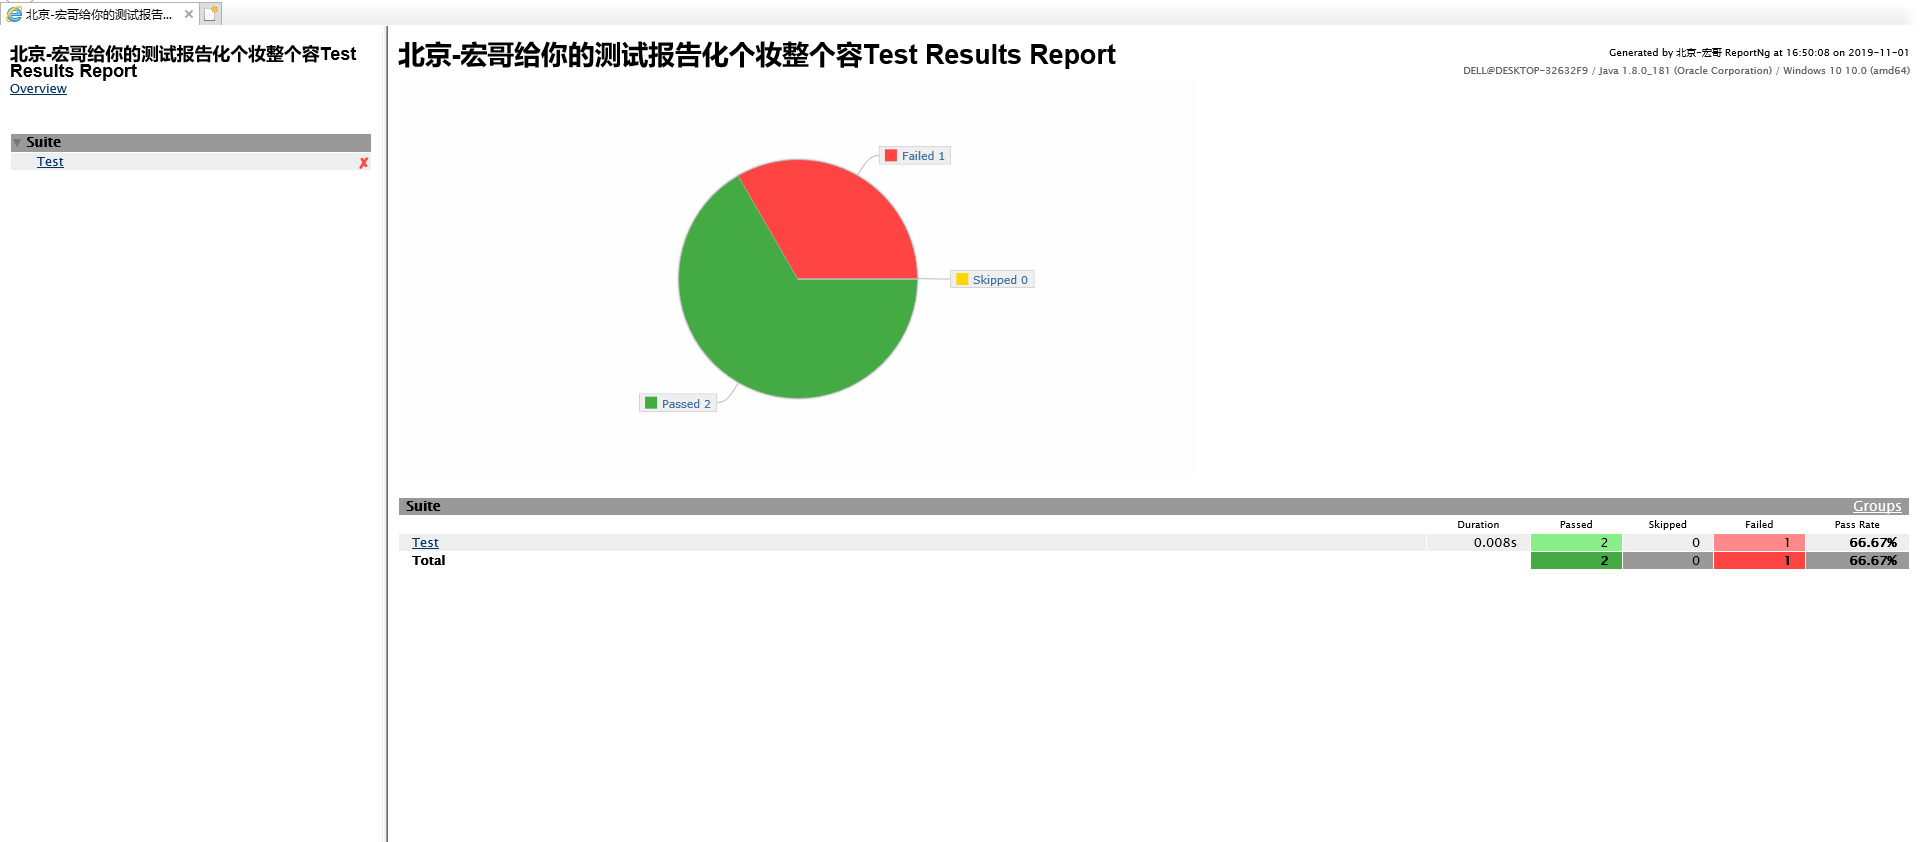
Postoperative recovery effect chart:
Summary
1. Little friend may follow the steps of brother Hong until he finally finds out where my pie chart is and who ate it. Follow brother Hong to see who ate it.
(1) First of all, brother Hong looked at the modified code and rechecked it without any problem.
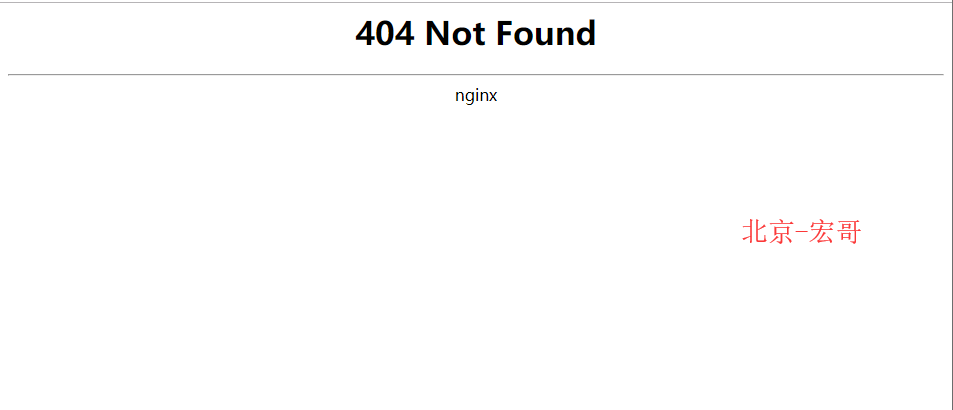
(2) After that, Hongge suddenly found that there was a section of JS code introducing icon plug-in: < script SRC ='http://www.ichartjs.com/ichart.latest.min.js' > script > was introduced through a website, that is, when using the second knife, Hongge tried to visit the website: http://www.ichartjs.com/ichart.latest.min.js, and the result was tragic as follows:
(3) Hongge is sure that there is a problem with the JS introduced here, so if the pie chart doesn't appear, then we can't access the website, then download one to the local, and visit it locally
(4) After that, Hongge began to export the jar package, and after introducing the jar package, there was still no pie chart.
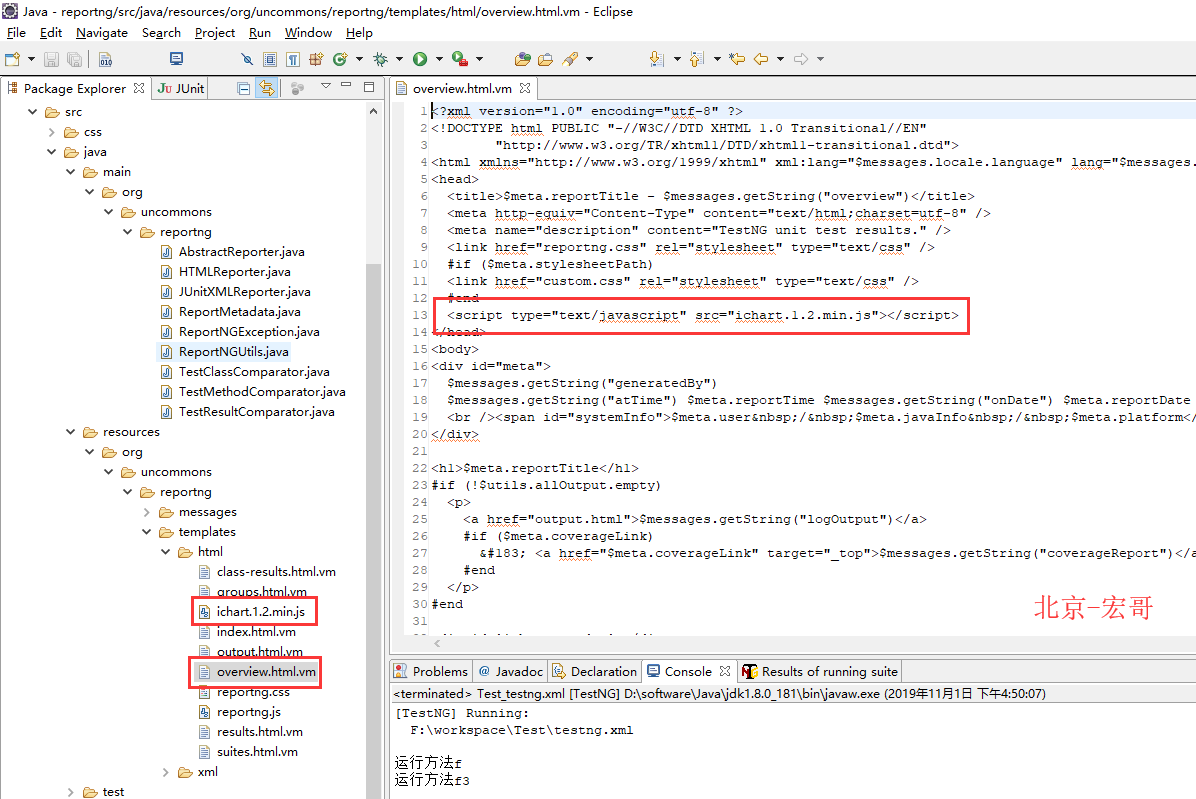
(5) After that, brother Hong tries to copy js to the folder of the test report and read the test report again.
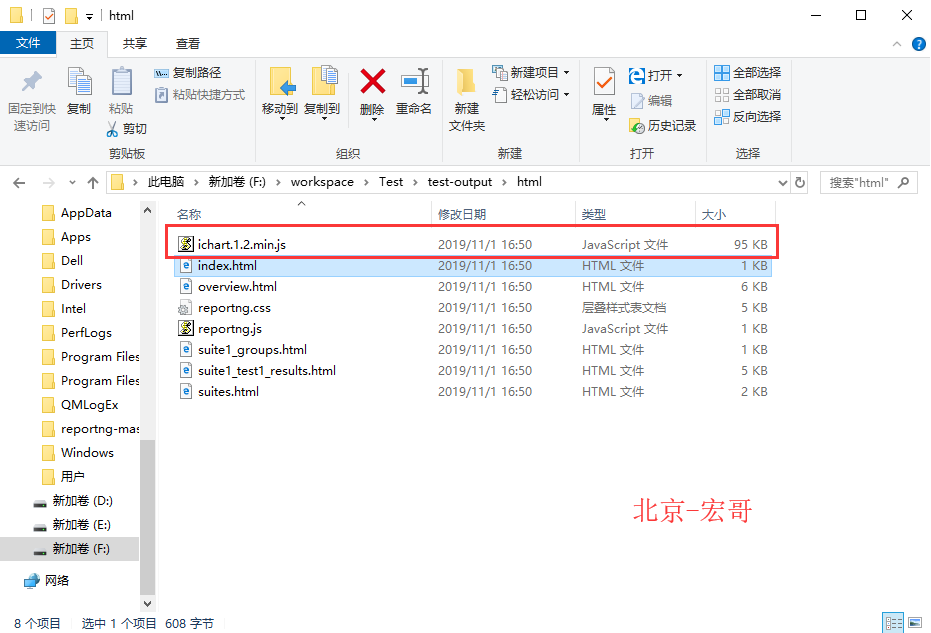
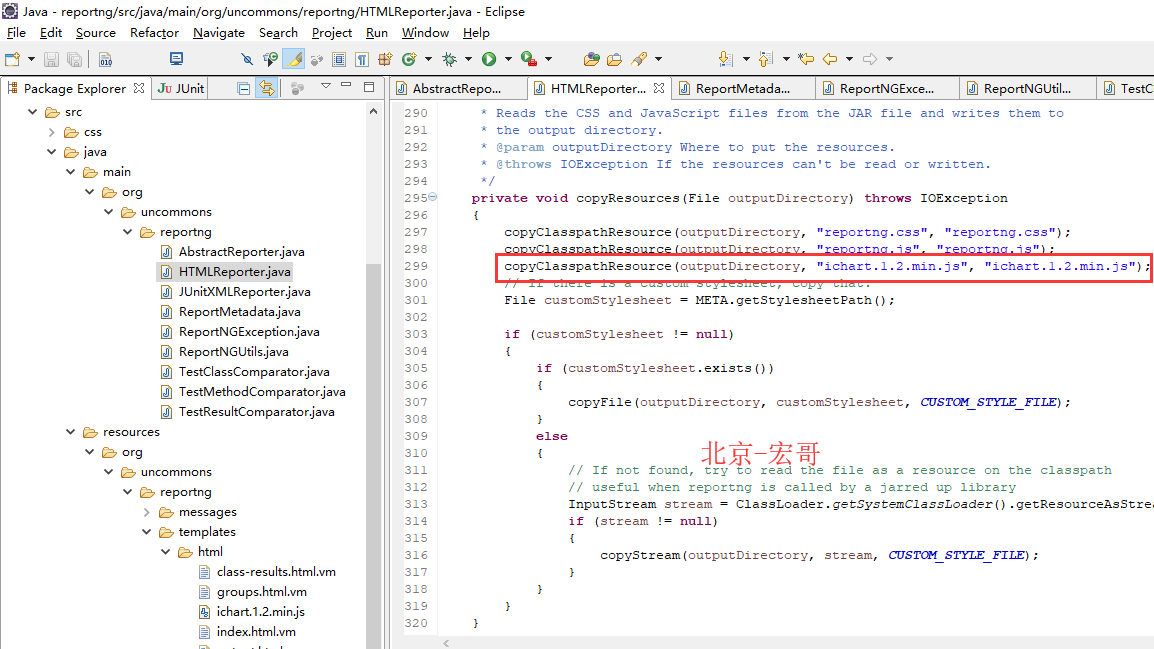
(6) the pie chart appears. It turns out that JS has not been introduced. What we have done before is just to introduce JS into the jar package, but not the test report. To introduce the test report, we need to modify the code in one place, following the introduction of CSS and JS above, as follows:
(7) export the jar package again, and the pie chart of the test report appears.
2. Well, that's all about it.