1: Background
1. Story telling
Last year, all the isv short message channels on the Jushi tower of Ali connected to Ali communication. We made a connection transformation and used the. net sdk provided by Ali.
website: https://help.aliyun.com/document_detail/114480.html
Colleagues used ons -. Net In v1.1.3, there will be a program crash a few days after the program goes online. At that time, I didn't pay much attention to it. I thought there was something wrong with my code or environment, so I added a detection program. If I detected that the sdk program exited, it would restart automatically. I just muddled it up until one day the server gave an alarm, and the CPU of that program actually soared to 100%, but the server was 16 Nuclear 128G...
2: Analyze problems
1. Grasp dump file
The situation is quite urgent. Immediately send the Ctrl+C command to the program to exit the program. The result can't be exited again. Wonderful... In order to analyze the problem, we grab a dump, and then force kill the program.
2. Check the thread pool and what each thread is doing?
0:000> !tp
CPU utilization: 100%
Worker Thread: Total: 0 Running: 0 Idle: 0 MaxLimit: 32767 MinLimit: 16
Work Request in Queue: 0
--------------------------------------
Number of Timers: 1
--------------------------------------
Completion Port Thread:Total: 1 Free: 1 MaxFree: 32 CurrentLimit: 1 MaxLimit: 1000 MinLimit: 16
From the perspective of CPU utilization: 100%, as expected, CPU is 100%. It is found that the Worker Thread has no Running thread. It may be because the execution of Ctrl+C is destroyed. Next, use ~ * e! Clrstack to print out all managed threads.
0:000> ~*e !clrstack
OS Thread Id: 0x1818 (0)
Unable to walk the managed stack. The current thread is likely not a
managed thread. You can run !threads to get a list of managed threads in
the process
Failed to start stack walk: 80070057
From the output result, there is no managed thread, the only thread 0 is not managed yet, and then change it to ~ * e! Dumpstack to find out the unmanaged thread stack.
0:000> ~*e !dumpstack
OS Thread Id: 0x1818 (0)
Current frame: ntdll!ZwRemoveIoCompletion+0x14
Child-SP         RetAddr          Caller, Callee
000000637323ef40 00007ff8327bac2f KERNELBASE!GetQueuedCompletionStatus+0x3f, calling ntdll!ZwRemoveIoCompletion
000000637323efa0 00007ff81b9c8a00 ONSClient4CPP!metaq_juce::URL::launchInDefaultBrowser+0x273d0, calling kernel32!GetQueuedCompletionStatus
000000637323f090 00007ff81ba3eb0a ONSClient4CPP!ons::Message::getMsgBody+0x5a8a, calling ONSClient4CPP!metaq_juce::URL::launchInDefaultBrowser+0x1f100
000000637323f140 00007ff81ba3f084 ONSClient4CPP!ons::Message::getMsgBody+0x6004, calling ONSClient4CPP!ons::Message::getMsgBody+0x5800
000000637323f280 00007ff81ba233b4 ONSClient4CPP!ons::ONSFactoryProperty::setSendMsgTimeout+0xa6b4, calling ONSClient4CPP!ons::ONSFactoryProperty::setSendMsgTimeout+0xa5d0
000000637323f2b0 00007ff81ba11b43 ONSClient4CPP!ons::ONSFactoryAPI::~ONSFactoryAPI+0x153
000000637323f310 00007ff81ba12d64 ONSClient4CPP!ons::SendResultONS::operator=+0xc44, calling ONSClient4CPP!ons::ONSFactoryAPI::~ONSFactoryAPI+0x10
000000637323f460 00007ff81ba83eb4 ONSClient4CPP!ons::Message::getStoreTimestamp+0xf484, calling ONSClient4CPP!ons::Message::getStoreTimestamp+0xf1c4
000000637323f630 00007ff8356f7d94 ntdll!RtlExitUserProcess+0xb4, calling ntdll!LdrShutdownProcess
000000637323f690 00007ff832777c23 KERNELBASE!CtrlRoutine+0xa3
000000637323f780 00007ff834df8364 kernel32!BaseThreadInitThunk+0x14, calling kernel32!WriteConsoleOutputW+0x530
From the view of unmanaged call stack, KERNELBASE!CtrlRoutine indicates that the main thread has received the command of Ctrl+C. It seems that the reason why the main thread cannot exit is that the main thread is taken over by ONSClient4CPP, and the C + + is making a remote connection and waiting for the network IO to return, but it is unlikely that the 16 core cpu will be full, which seems to be stuck here.
3: Restart the program found that the problem is still
1. Grasp dump file
I'm very happy that after the program is restarted, the CPU is soaring again after two minutes. This time, I learned to be obedient. When the CPU reaches 60% or 70%, I'll grab the dump file.
2. Continue troubleshooting
0:000> .time
Debug session time: Fri Apr 17 17:36:50.000 2020 (UTC + 8:00)
System Uptime: 355 days 5:33:48.092
Process Uptime: 0 days 0:02:11.000
  Kernel time: 0 days 0:03:31.000
  User time: 0 days 0:13:22.000


0:000> !tp
CPU utilization: 59%
Worker Thread: Total: 3 Running: 0 Idle: 3 MaxLimit: 32767 MinLimit: 16
Work Request in Queue: 0
--------------------------------------
Number of Timers: 1
--------------------------------------
Completion Port Thread:Total: 2 Free: 2 MaxFree: 32 CurrentLimit: 2 MaxLimit: 1000 MinLimit: 16
As can be seen from the above code, the process started for 2 minutes and 11 seconds. This time, the cpu utilization rate is 59%. It's a bit early to catch, but it's OK. Let's take a look at the Threads first.
0:000> !threads
ThreadCount:      25
UnstartedThread:  0
BackgroundThread: 8
PendingThread:    0
DeadThread:       16
Hosted Runtime:   no
                                                                                                        Lock
       ID OSID ThreadOBJ           State GC Mode     GC Alloc Context                  Domain           Count Apt Exception
   0    1  cdc 0000022bb9f53220    2a020 Preemptive  0000022BBBFACCE8:0000022BBBFADFD0 0000022bb9f27dc0 1     MTA
   2    2  3dc 0000022bb9f7f9f0    2b220 Preemptive  0000000000000000:0000000000000000 0000022bb9f27dc0 0     MTA (Finalizer)
   3    4 296c 0000022bb9fe97b0  102a220 Preemptive  0000000000000000:0000000000000000 0000022bb9f27dc0 0     MTA (Threadpool Worker)
XXXX    5    0 0000022bb9ffc5a0  1039820 Preemptive  0000000000000000:0000000000000000 0000022bb9f27dc0 0     Ukn (Threadpool Worker)
XXXX    6    0 0000022bd43938c0  1039820 Preemptive  0000000000000000:0000000000000000 0000022bb9f27dc0 0     Ukn (Threadpool Worker)
.............................................................................
 163   24 29e8 0000022bd4898650  1029220 Preemptive  0000022BBC102108:0000022BBC103FD0 0000022bb9f27dc0 0     MTA (Threadpool Worker)
 164   25 2984 0000022bd489d470  1029220 Preemptive  0000022BBC0EA2D0:0000022BBC0EBFD0 0000022bb9f27dc0 0     MTA (Threadpool Worker)
Good guy, in just 2 minutes and 11 seconds, the managed thread count: 25 is dead. 16 threads are dead. From the threads list, the maximum number given by windbg is 164, indicating that there are currently (164 + 1) - 25 = 142 unmanaged threads, which should be enabled by the ONSClient4CPP of Ali. What's the reason for enabling so many threads? That's a very noteworthy problem. Next, use ~ * e !dumpstack prints out the managed and unmanaged thread stacks of all threads. Because there is too much information, I will take a few pictures.
<font color="red" style="font- size:large "> personal guess, pure technical discussion: < / font >
Figure 1

From the stack, there are 105 thread cards in ntdll! Zwlemoveiocompletion + 0x14, and from onsclient4cpp! Metadata_ Juce:: URL:: launchindefaultbrowser + 0x23072. It seems that Ali has opened a browser kernel to send data with the kernel. It is estimated that the concurrency threshold here is quite large. I consulted my next colleague that a big customer in front of me sent many SMS messages, < font color = "red" > it is estimated that there is a large amount of backholding backlog < / font >. This C# The SDK has a crazy read, which should have something to do with the CPU boom.
Figure 2
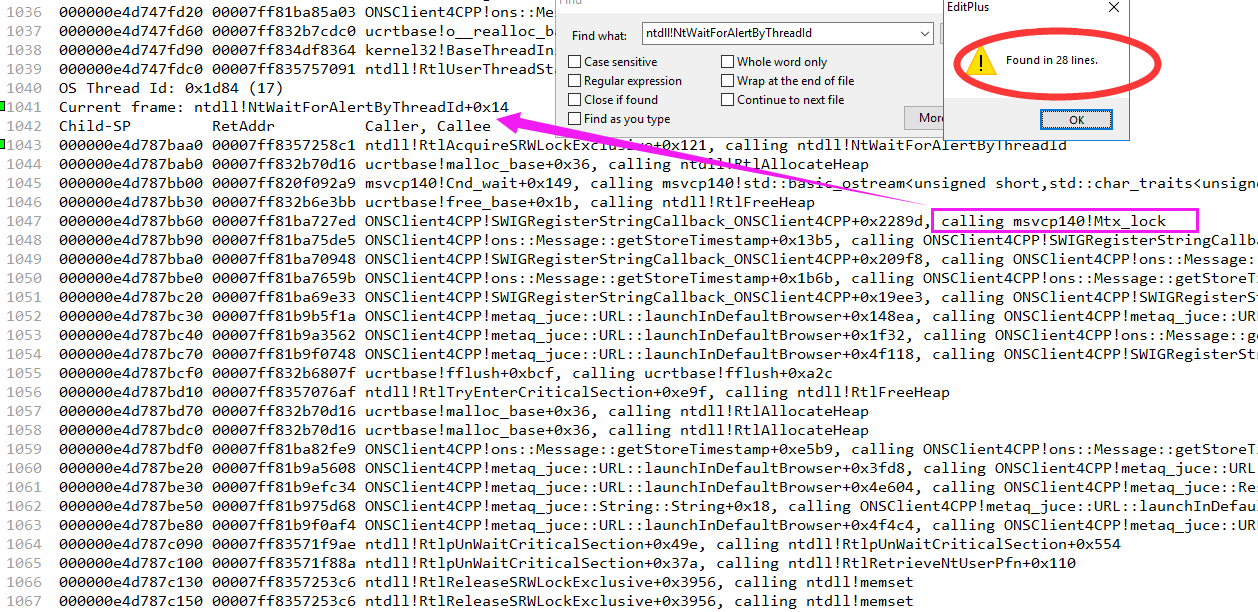
In terms of retrieval, 28 threads seem to be waiting for locks in the critical area. A classic case of high CPU is when many threads are waiting in the critical area, when a thread in the critical area leaves, the scheduling competition of these 28 threads is also a reason for high CPU.
Due to the limited personal level, there is no such technology for further excavation of the unmanaged pile...
4: Solutions
What else can we do to solve this SDK problem? What we can think of is to go to the official website and find the latest version:
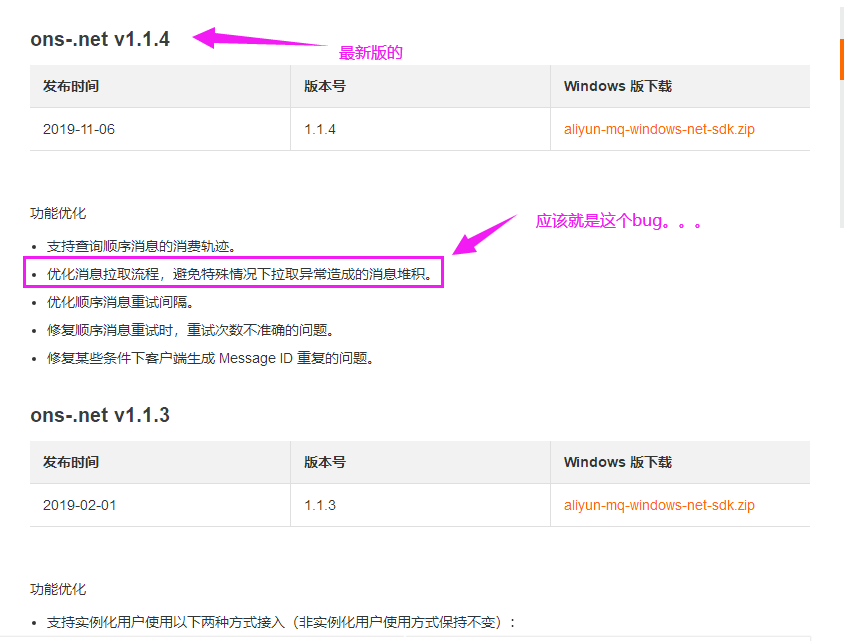
You can see the optimization points mentioned in the latest version of ons-.net v1.1.4: < font color = "red" > optimize the message pulling process to avoid message piling up caused by pull-down exceptions under special circumstances < / font >.
You can use the latest version of sdk, 🐮👃.