Author: Richard_Yi
Original text: https://juejin.im/post/6844904050056495111
preface
Last year, our project made the architecture transformation of microservice 1.0, but the service monitoring did not keep up. No, I was recently assigned the task of monitoring all our core microservice applications. Our microservice applications are all Spring Boot applications, so we naturally thought of using the activator module of Spring Boot. (I've never eaten pork. I've always heard of pigs barking. Have I seen pigs running 🤪).
This article is my summary of the learning and application of Spring Boot Actuator module after completing this work order. In this article, you can learn:
- Getting started with Spring Boot Actuator
- Introduction to some important endpoints of Spring Boot Actuator
- How to view the thread dump information of the current application in real time through the Actuator module
- How to view the heap information of the current application in real time through the Actuator module
- How to modify the log print level of the current application in real time through the Actuator module
- ...
Then I will introduce:
- TODO: SpringBoot microservice application integration Prometheus + Grafana to monitor alarms
1, What is Spring Boot Actuator
The Spring Boot Actuator module provides production level functions, such as health check, audit, indicator collection, HTTP tracking, etc., to help us monitor and manage Spring Boot applications. This module is a module that collects application internal information and exposes it to the outside. The above functions can be accessed through HTTP and JMX.
Because of the characteristics of exposing internal information, activator can also integrate with some external application monitoring systems (Prometheus, Graphite, DataDog, Influx, Wavefront, New Relic, etc.). These monitoring systems provide excellent dashboard, graphics, analysis and alarm, which can help you monitor and manage your applications through a unified and friendly interface.
Activator uses Micrometer to integrate with these external application monitoring systems. This makes it easy to integrate external monitoring systems with few configurations.
Micrometer provides a general API for performance data collection on the Java platform. Applications only need to use the general API of micrometer to collect performance indicators. Micrometer will be responsible for adapting to different monitoring systems. This makes it easy to switch monitoring systems.
Compare the positioning of Slf4j in Java Logger.
2, Get started and create a Spring Boot Actuator Demo
Let's create a demo application first.
- You can create through the Spring Boot CLI:
spring init -d=web,actuator -n=actuator-demo actuator-demo
 Copy code
- Or create it through Spring Initializr:
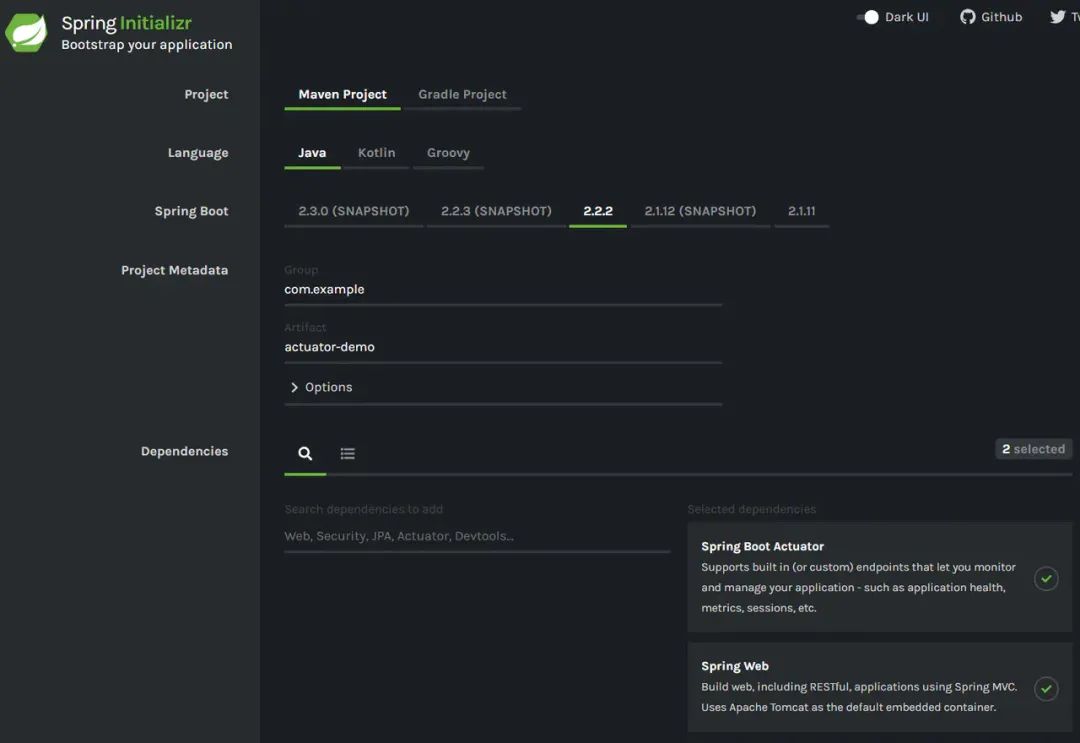
- Corresponding maven dependencies:
<dependencies>
    ...
<dependency>
<groupId>org.springframework.boot</groupId>
<artifactId>spring-boot-starter-actuator</artifactId>
</dependency>
    ...
</dependencies>- Corresponding Gradle dependency:
dependencies {
compile("org.springframework.boot:spring-boot-starter-actuator")
}
3, Introduction to Endpoints
Spring Boot provides so-called endpoints (hereinafter translated as endpoints) to the outside to access and interact with applications.
For example, / health endpoint provides some basic information about application health. Metrics endpoint provides some useful application metrics (JVM memory usage, system CPU usage, etc.).
The endpoints of these activator modules are called native endpoints. According to the role of endpoints, they can be divided into three categories:
- Application configuration class: obtain the application configuration, environment variables, automatic configuration reports and other configuration class information closely related to Spring Boot applications loaded in the application.
- Metrics class: get metrics used for monitoring during application running, such as memory information, thread pool information, HTTP request statistics, etc.
- Operation control class: provides operation class functions such as closing applications.
For a detailed introduction to the native endpoint, please refer to the official website. I won't repeat it here to increase the space.
It should be noted that:
- Each endpoint can be disabled or started individually through configuration
- Unlike actor 1. X, most endpoints of actor 2. X are disabled by default. The default endpoint in actor 2. X is prefixed with / actor. The two endpoints exposed by default are / Actor / health and / Actor / info
4, Endpoint exposure configuration
We can configure the endpoints exposed through JMX and HTTP through the following configuration.
| Property | Default |
|---|---|
| management.endpoints.jmx.exposure.exclude | |
| management.endpoints.jmx.exposure.include | * |
| management.endpoints.web.exposure.exclude | |
| management.endpoints.web.exposure.include | info, healt |
All monitoring points can be opened
management.endpoints.web.exposure.include=*
You can also select the open part, and "*" represents exposing all endpoints. If multiple endpoints are specified, separate them with ","
management.endpoints.web.exposure.exclude=beans,trace
By default, all monitoring point paths of actuator are in / Actor / *. Of course, this path also supports customization if necessary.
management.endpoints.web.base-path=/minitor
After setting the restart, the access address will become / minitor / *.
Now we configure it as follows:
# "*" indicates that all endpoints are exposed. If multiple endpoints are specified, separate them with ","
management.endpoints.web.exposure.include=*
# The assignment rules are the same as above
management.endpoints.web.exposure.exclude=
Start DEMO program and access http://localhost:8080/actuator , view the exposed endpoints:
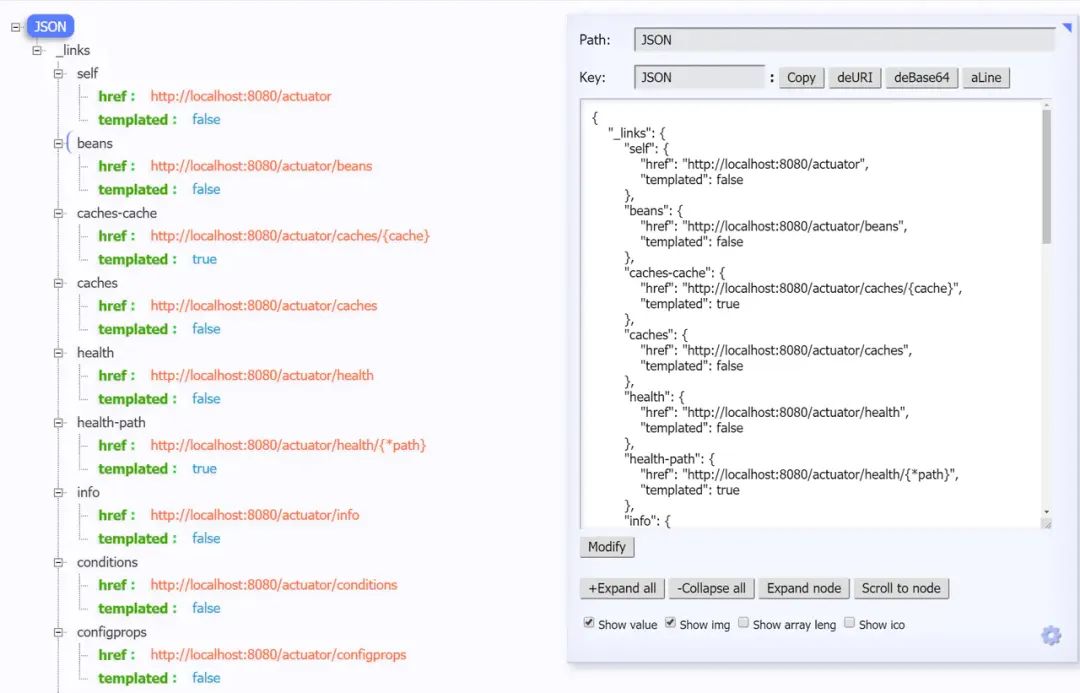
The reason shown above is that the chrome browser installs the json handle plug-in, which actually returns a large section of json
Next, I will focus on several important endpoints.
5, Important endpoint resolution
5.1 /health endpoint
/The health endpoint will aggregate the health indicators of your application to check the health of the application. The application health information disclosed by the endpoint depends on:
management.endpoint.health.show-details=always
This property can be configured with one of the following values:
| Name | Description |
|---|---|
| never | No detailed information is displayed, and the status of up or down is the default configuration |
| when-authorized | Details will be displayed to authenticated users. Authorized roles can be configured through management.endpoint.health.roles |
| always | Expose details to all users |
According to the above configuration, after configuring as always, we start the project and access http://localhost:8080/actuator/health Port, you can see the following information:
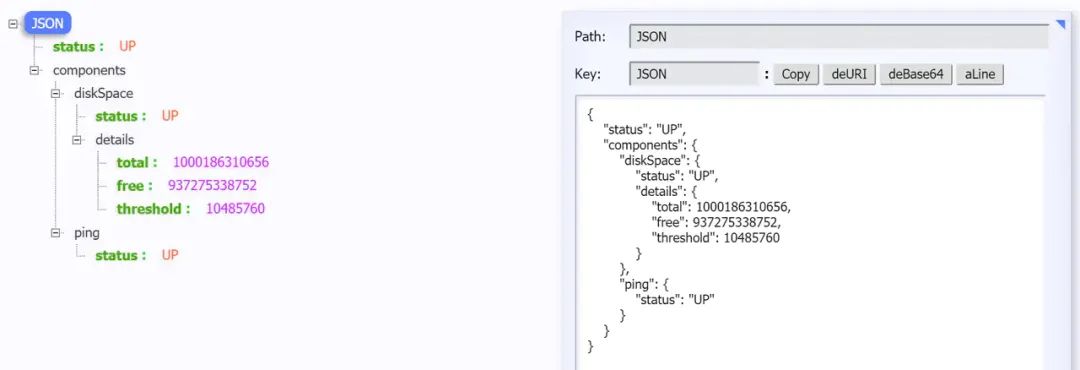
Does it feel like there is little health information? Don't worry, it's because we create the most basic Demo project without relying on many components.
/The health endpoint has many automatically configured health indicators, such as redis, rabbitmq, db and other components. When your project depends on the corresponding components, these health indicators will be automatically assembled and the corresponding information will be collected. For example, the diskSpace node information above is that the DiskSpaceHealthIndicator is working.
The above screenshot is taken from official documents
This is the / health endpoint information for my other project.
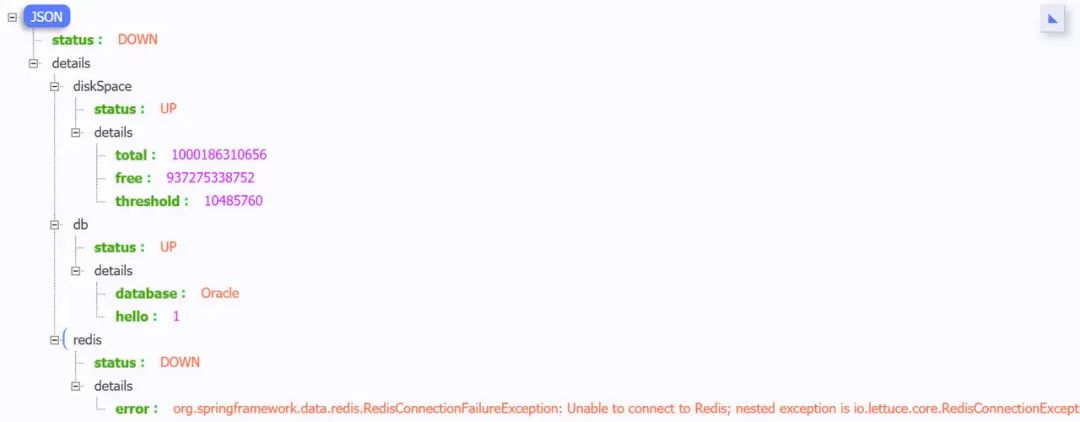
When the above components have an abnormal state, the overall state of the application service is down. We can also disable the health monitoring of a component through configuration.
management.health.mongo.enabled: false
Or disable all automatically configured health indicators:
management.health.defaults.enabled: false
⭐ Customize Health Indicator
Of course, you can also customize a Health Indicator. You only need to implement the HealthIndicator interface or inherit the AbstractHealthIndicator class.
/** * @author Richard_yyf * @version 1.0 2020/1/16 */@Componentpublic class CustomHealthIndicator extends AbstractHealthIndicator { @Override protected void doHealthCheck(Health.Builder builder) throws Exception { // Use builder to create health status information. / / if you throw an exception, the status will be set to DOWN, and the exception information will be recorded. Builder. Up(). Withdetail ("app", "this project is healthy"). withDetail("error", "Nothing, I'm very good");}}Final effect:

5.2 /metrics endpoint
/The metrics endpoint is used to return various important metrics of the current application, such as memory information, thread information, garbage collection information, tomcat, database connection pool, etc.
{ "names": [ "tomcat.threads.busy", "jvm.threads.states", "jdbc.connections.active", "jvm.gc.memory.promoted", "http.server.requests", "hikaricp.connections.max", "hikaricp.connections.min", "jvm.memory.used", "jvm.gc.max.data.size", "jdbc.connections.max", .... ]}Unlike 1.x, Actuator does not see specific indicator information in this interface, but only displays a list of indicators. In order to obtain the detailed information of an indicator, we can request specific indicator information, such as:
http://localhost:8080/actuator/metrics/{MetricName}For example, when I visit / Actor / metrics / jvm.memory.max, the returned information is as follows:
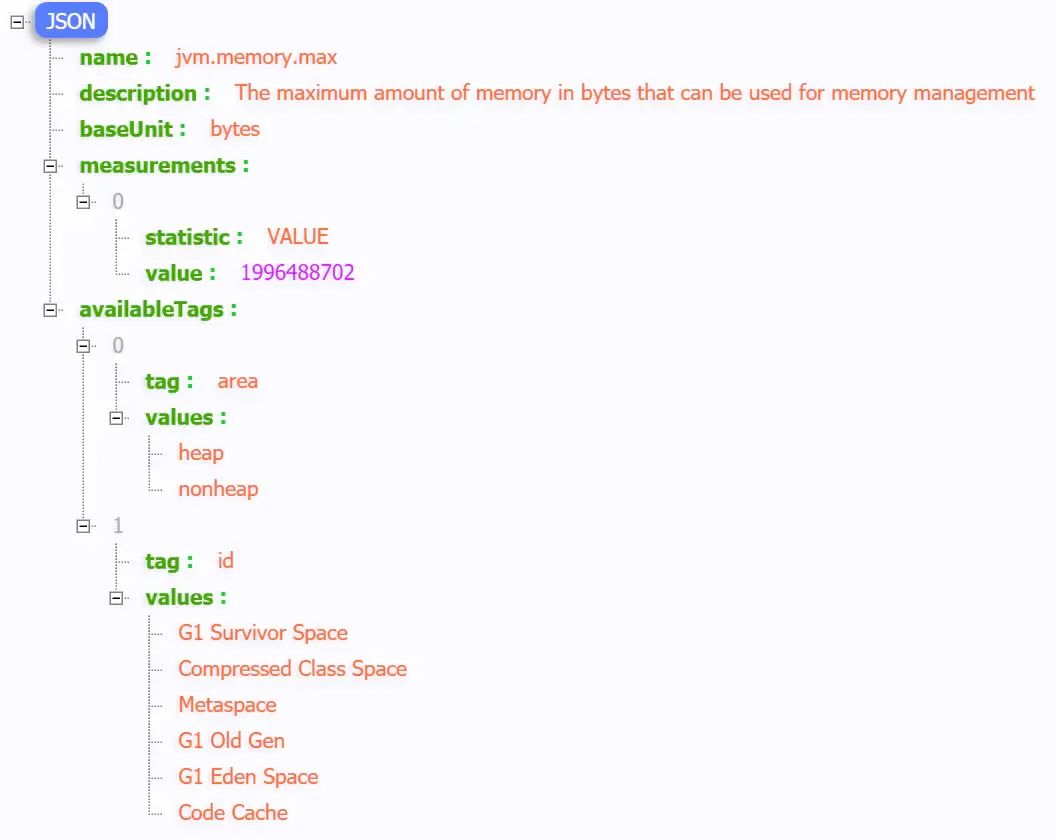
You can also use query param to view a separate area. For example, you can visit / Actor / metrics / JVM. Memory. Max? Tag = ID: Metaspace. The result is:

5.3/loggers endpoint
/The loggers endpoint exposes the information of all loggers configured inside our program. When we visit / Actor / loggers, we can see that,
You can also access a single logger in the following ways,
http://localhost:8080/actuator/loggers/{name}For example, I now access the root logger, http://localhost:8080/actuator/loggers/root
{ "configuredLevel": "INFO", "effectiveLevel": "INFO"}⭐ Change the log level at run time
/The loggers endpoint I want to mention most is this function, which can dynamically modify your log level.
For example, we can modify the log level of root logger in the following ways. We just need to initiate a URL for http://localhost:8080/actuator/loggers/root The POST message is as follows:
{ "configuredLevel": "DEBUG"}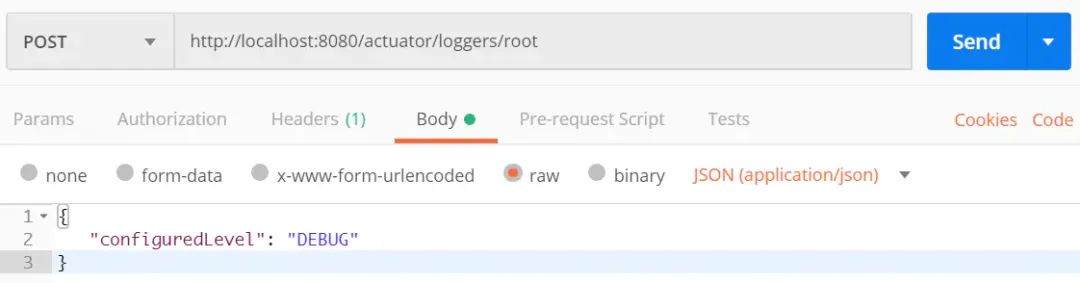
Think about it. Is this feature very useful. In the production environment, if you want your application to output some Debug information so that you can diagnose some exceptions, you can modify it in the above way without restarting the application.
If you want to reset to the default value, change value to null
5.4 /info endpoint
/The info endpoint can be used to display information about your program. I understand that it is the basic information of some programs. And you can personalize the configuration in the configuration file application.properties according to your own needs (by default, the endpoint will only return an empty json content.):
info.app.name=actuator-test-demoinfo.app.encoding=UTF-8info.app.java.source=1.8info.app.java.target=1.8# stay maven In the project, you can directly reference it in the following ways maven properties Value of# info.app.encoding=@project.build.sourceEncoding@# info.app.java.source=@java.version@# info.app.java.target=@java.version@
Start project, access http://localhost:8080/actuator/info :
{ "app": { "encoding": "UTF-8", "java": { "source": "1.8.0_131", "target": "1.8.0_131" }, "name": "actuator-test-demo" }}5.5 /beans endpoint
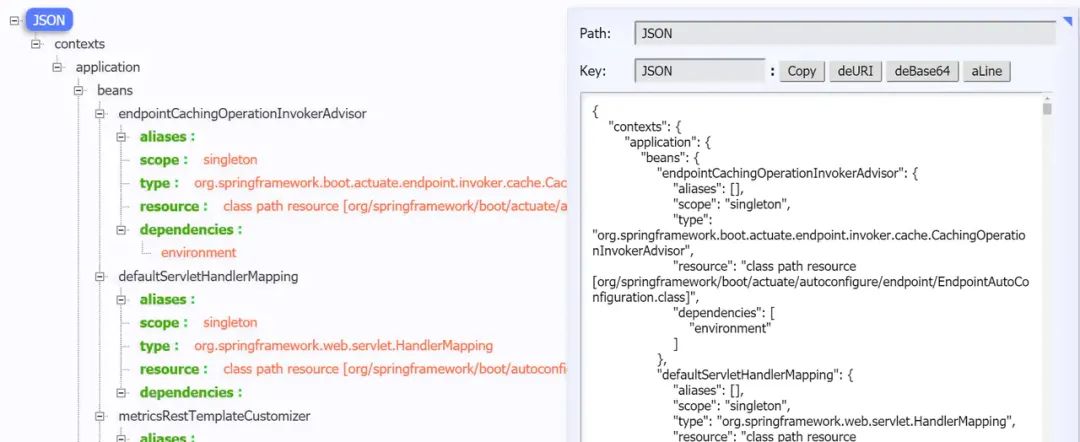
/The beans endpoint will return the alias, type, singleton, dependency and other information of all beans in the Spring container.
visit http://localhost:8080/actuator/beans , return as follows:
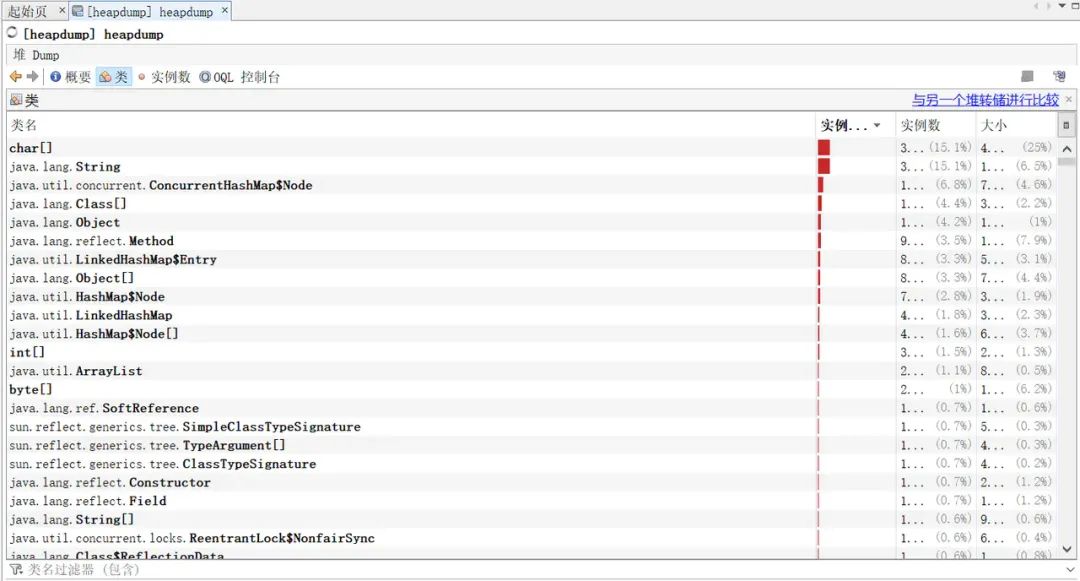
5.6 /heapdump endpoint
visit: http://localhost:8080/actuator/heapdump A Jvm heap file heapdump will be generated automatically. We can use the Jvm monitoring tool VisualVM provided with JDK to open this file and view the memory snapshot.
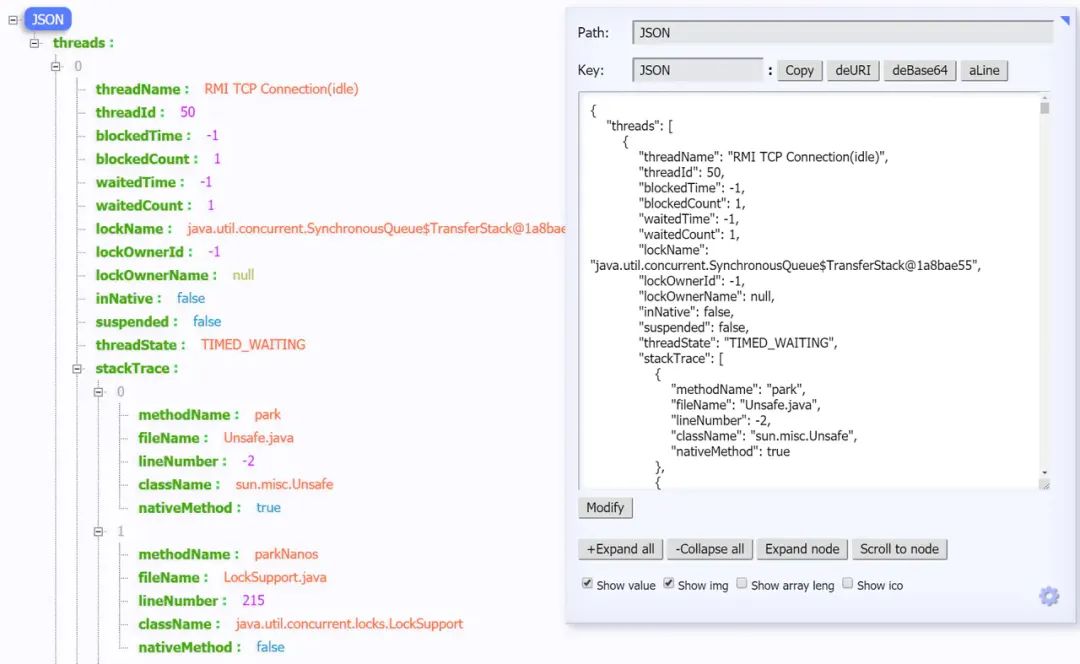
5.7 /threaddump endpoint
Personally, I think this endpoint is particularly useful for us to view the thread when we locate the problem every day. It mainly displays the thread name, thread ID, thread status, whether to wait for lock resources, thread stack and other information. It may not be intuitive to view. visit http://localhost:8080/actuator/threaddump Return as follows:
5.8 /shutdown endpoint
This endpoint belongs to the operation control class endpoint, which can gracefully close the Spring Boot application. To use this function, you must first enable it in the configuration file:
management.endpoint.shutdown.enabled=true
Since the shutdown interface only supports POST requests by default, we start the Demo project to http://localhost:8080/actuator/shutdown Initiate a POST request. Return information:
{ "message": "Shutting down, bye..."}The application is then closed.
Since the operation of opening and closing applications is very dangerous, we need to add some protection mechanisms to them when they are really used online, such as customizing the endpoint path of Actuator, integrating Spring Security for security verification, etc. (if it is not particularly necessary, this endpoint does not need to be opened)
6, Integrate Spring Security for security verification of endpoints
Because the information and interaction of the endpoint are very sensitive, unauthorized external access must be prevented. If there is a dependency on Spring Security in your application, form based HTTP authentication is used to protect the endpoint by default.
If not, just add the corresponding dependency:
<dependency>
   <groupId>org.springframework.boot</groupId>
   <artifactId>spring-boot-starter-security</artifactId>
</dependency>
After adding, we need to define security verification rules to override the default configuration of Spring Security.
Here I give two versions of template configuration:
import org.springframework.boot.actuate.autoconfigure.security.servlet.EndpointRequest;
import org.springframework.boot.actuate.context.ShutdownEndpoint;
import org.springframework.boot.autoconfigure.security.servlet.PathRequest;
import org.springframework.context.annotation.Configuration;
import org.springframework.security.config.annotation.web.builders.HttpSecurity;
import org.springframework.security.config.annotation.web.configuration.WebSecurityConfigurerAdapter;

/**
 * @author Richard_yyf
 */
@Configuration
public class ActuatorSecurityConfig extends WebSecurityConfigurerAdapter {

    /*
     * version1:
     * 1. Restrict access to '/ shutdown' endpoint, only actors are allowed_ Admin access
     * 2. Allow external access to other endpoints
     * 3. Allow external access to static resources
     * 4. Allow external access' / '
     * 5. Other accesses need to be verified
     * version2:
     * 1. Restrict access to all endpoints and only actors are allowed_ Admin access
     * 2. Allow external access to static resources
     * 3. Allow external access' / '
     * 4. Other accesses need to be verified
     */

    @Override
    protected void configure(HttpSecurity http) throws Exception {
        // version1
//        http
//                .authorizeRequests()
//                    .requestMatchers(EndpointRequest.to(ShutdownEndpoint.class))
//                        .hasRole("ACTUATOR_ADMIN")
//                .requestMatchers(EndpointRequest.toAnyEndpoint())
//                    .permitAll()
//                .requestMatchers(PathRequest.toStaticResources().atCommonLocations())
//                    .permitAll()
//                .antMatchers("/")
//                    .permitAll()
//                .antMatchers("/**")
//                    .authenticated()
//                .and()
//                .httpBasic();

        // version2
        http
                .authorizeRequests()
                .requestMatchers(EndpointRequest.toAnyEndpoint())
                    .hasRole("ACTUATOR_ADMIN")
                .requestMatchers(PathRequest.toStaticResources().atCommonLocations())
                    .permitAll()
                .antMatchers("/")
                    .permitAll()
                .antMatchers("/**")
                    .authenticated()
                .and()
                .httpBasic();
    }
}
The relevant configurations of application.properties are as follows:
# Spring Security Default user name and password
spring.security.user.name=actuator
spring.security.user.password=actuator
spring.security.user.roles=ACTUATOR_ADMIN
epilogue
That's all for this article.
The corresponding source code can be seen on Github. ( https://github.com/Richard-yyf/springboot-actuator-prometheus-test)
If this article is helpful to you, I hope you can like it, which is the biggest motivation for me 🤝🤝🤗🤗.
reference resources:
https://docs.spring.io/spring-boot/docs/current/reference/html/actuator.html
http://www.ityouknow.com/springboot/2018/02/06/spring-boot-actuator.html
Recent hot article recommendations:
1.1000 + Java interview questions and answers (2021 latest version)
2.Stop playing if/ else on the full screen. Try the strategy mode. It's really fragrant!!
3.What is the new syntax of xx ≠ null in Java?
4.Spring Boot 2.5 heavy release, dark mode is too explosive!
5.Java development manual (Songshan version) is the latest release. Download it quickly!
Feel good, don't forget to like + forward!