research meaning
Aiming at the characteristics of indoor point cloud data without structured attributes, no connection between data, no semantic information and high data point density, combined with the geometric features of building point cloud and the requirements of indoor navigation, this paper simplifies the complexity of building geometric feature extraction through data dimensionality reduction, and proposes a method of extracting building wall lines based on indoor point cloud data.
Algorithm idea
- Firstly, by projecting to a specific direction, the preliminary segmentation of ceiling panel, floor and room wall is completed by using point cloud density histogram;
- Then the point cloud data of the room wall is projected to the ground to generate the point cloud distribution matrix and convert it into a binary map. The straight line is extracted by Hough transform algorithm, and the intersection point is obtained by line equation to obtain the alternative wall line;
- Finally, the alternative wall line and the binary map of wall line point cloud are superimposed to obtain the final building wall line.
Experimental steps
programing language? Don't tangle, recognize that the programming language is just a tool, the important logical idea of the algorithm, what language is convenient and what language to use. Although matlab algorithm programming is simple and matrix operation is convenient, it is not as good as C++Eigen in the manually written cycle.
My programming language:
- matlab: mainly responsible for displaying images and simple operations
- C + +: mainly responsible for the algorithm implementation of Eigen.
Split wall
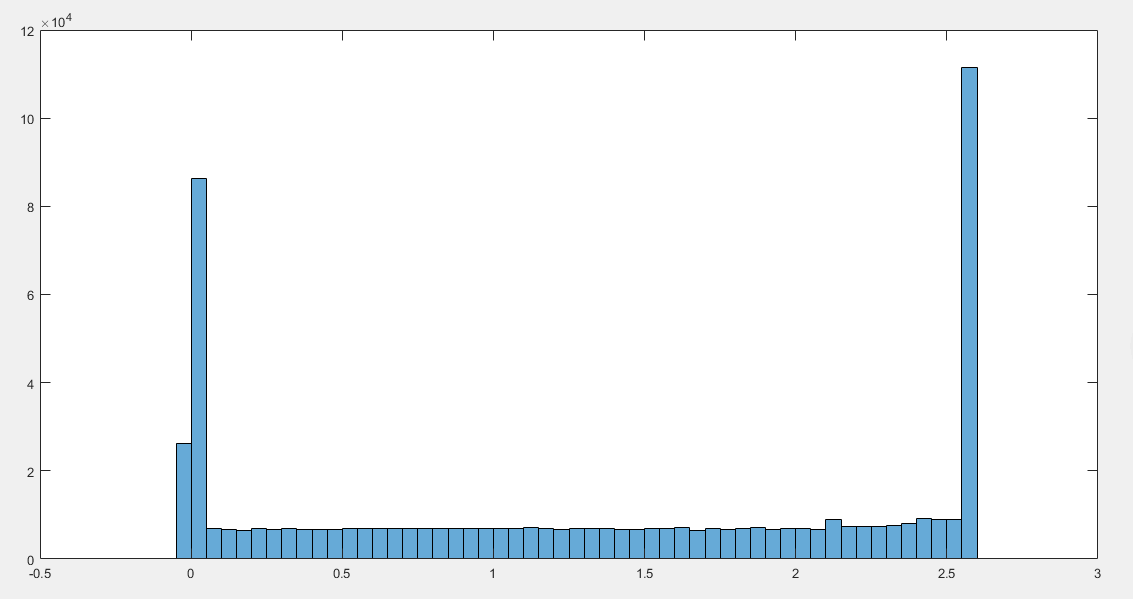
1. Use matlab to try to project to the coordinate axis to generate the point cloud density histogram.
- code
clc,clear
%%%Point cloud to axis z Projection generates a point cloud density histogram.
home=importdata('hallway_2.txt');%read txt Point cloud data
home_z=home(:,3);%Get point cloud z Axis data, i.e z Axial projection
h=histogram(home_z);%Display density histogram
h.BinWidth=0.02;%You can also draw after setting the scale by default

% Summary:
% hallway_2.txt Extract wall range[0.02,2.56]
%
- experimental result
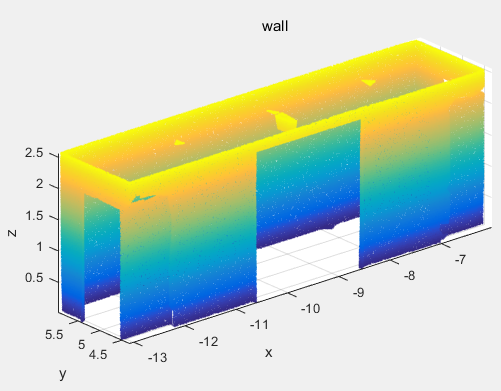
2. Use C + + to directly filter the point cloud and extract the part of the wall:
- critical code
	pcl::PassThrough<pcl::PointXYZ> pass;// Create filter object
	pass.setInputCloud(cloud);
	pass.setFilterFieldName("z"); //The filter field name is set to the Z-axis direction
	pass.setFilterLimits(0.02, 2.56); //Set the filtering range in the filtering direction
	pass.setNegative(false); //Set whether to keep or filter out the points within the range. When the flag is false, the points within the range are kept
	pass.filter(*cloud_filtered);
- experimental result
Hough transform line finding
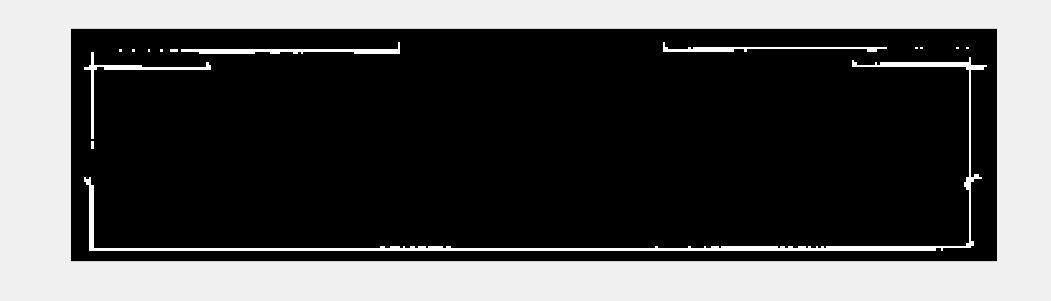
1. The wall point cloud is projected to the ground to finally generate a binary map
//Get the most valuable data in the point cloud
Minimum: x_min=-13.084 y_min=4.321 z_min=0.02
Max: x_max=-6.018 y_max=5.956 z_max=2.56
//Set the pixel to 0.02m to calculate the number of rows and columns of the matrix
Matrix size: 91x363
//Start projection, calculate the number of point clouds in each pixel, and generate the point cloud distribution matrix
- code
	cout << "/*---------------------------------------------------------------*/" << endl;
	cout << "/*Start projecting to the ground to generate a point cloud distribution matrix*/" << endl;
	//Get the most valuable data in the point cloud
	PointT minPt, maxPt;//Save the maximum / minimum points
	pcl::getMinMax3D(*cloud, minPt, maxPt);
	cout << "Minimum: x_min=" << minPt.x << " y_min=" << minPt.y << " z_min=" << minPt.z << endl;
	cout << "Maximum: x_max=" << maxPt.x << " y_max=" << maxPt.y << " z_max=" << maxPt.z << endl;
	//Set the pixel to 0.02m to calculate the number of rows and columns of the matrix
	float pix_size = 0.02;
	int row = (maxPt.y+0.1 - (minPt.y-0.1)) / pix_size;//Get the number of rows 1dm
	int col = (maxPt.x + 0.1 - (minPt.x - 0.1)) / pix_size;//Get the number of columns 1dm
	cout << "Matrix size:" << row << "x" << col << endl;
	//Start projection, calculate the number of point clouds in each pixel, and generate the point cloud distribution matrix
	Eigen::MatrixXf ground_matrix=Eigen::MatrixXf::Zero(row, col);//Create matrix
	int row_n;//Row subscript
	int col_n;//Column subscript
	for (int i = 0; i < cloud->size(); i++)//Traverse all points and count the number of point clouds per pixel
	{
		//Just count which pixel the current point x,y is in
		row_n = (cloud->points[i].y - (minPt.y - 0.1)) / pix_size;
		col_n = (cloud->points[i].x - (minPt.x - 0.1)) / pix_size;
		//Corresponding pixel + 1
		ground_matrix(row_n, col_n) += 1;
	}
	//Graying of point cloud distribution matrix
	ground_matrix = 255 * ground_matrix / ground_matrix.maxCoeff();
	//Gray matrix binarization
	float bin_threshold = 10;
	for (int i = 0; i < ground_matrix.rows(); i++)
	{
		for (int j = 0; j < ground_matrix.cols(); j++)
		{
			if (ground_matrix(i, j) > bin_threshold)	ground_matrix(i, j) = 1;
			else										ground_matrix(i, j) = 0;
		}
	}
	//Write matrix to ground_matrix.txt
	ofstream outfile;
	outfile.open("ground_matrix.txt",ios::app);
	outfile << ground_matrix << endl;
	outfile.close();
	cout << "The matrix was successfully written to the file" << endl;
- experimental result
Convert to grayscale:
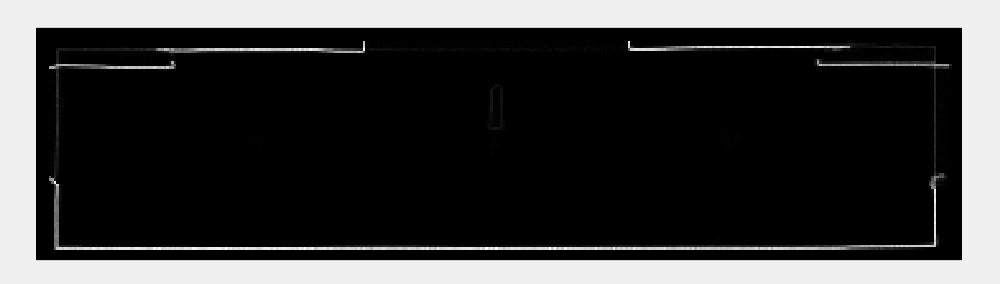
Convert to binary diagram:
2. Find alternative wall lines by Hough transform of binary graph
- matlab code
BW = importdata('ground_matrix_bin.txt');
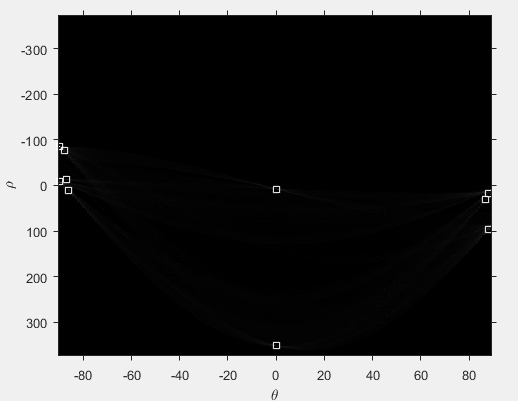
[H,T,R] = hough(BW);%Hough transform H: Hough matrix, counting box T: theta R: rho
imshow(H,[],'XData',T,'YData',R,...
'InitialMagnification','fit');%Show Hough matrix
xlabel('\theta'), ylabel('\rho');
axis on, axis normal, hold on;
P = houghpeaks(H,10,'threshold',ceil(0.1*max(H(:))));%Threshold of maximum number of peaks of statistical Hough matrix
x = T(P(:,2)); y = R(P(:,1));
plot(x,y,'s','color','white');%Displays the peak found
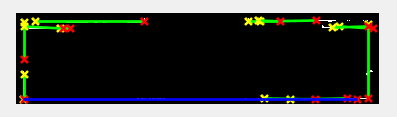
% Find lines and plot them
lines = houghlines(BW,T,R,P,'FillGap',10,'MinLength',5);%Traverse all points( tho,theta)Find all segments FillGap: Merge spacing MinLength: Minimum length
figure, imshow(BW), hold on
max_len = 0;
for k = 1:length(lines)
xy = [lines(k).point1; lines(k).point2];
plot(xy(:,1),xy(:,2),'LineWidth',2,'Color','green');
% Plot beginnings and ends of lines
plot(xy(1,1),xy(1,2),'x','LineWidth',2,'Color','yellow');
plot(xy(2,1),xy(2,2),'x','LineWidth',2,'Color','red');
% Determine the endpoints of the longest line segment
len = norm(lines(k).point1 - lines(k).point2);
if ( len > max_len)%Get the endpoint corresponding to the maximum length
max_len = len;
xy_long = xy;
end
end
% highlight the longest line segment
plot(xy_long(:,1),xy_long(:,2),'LineWidth',2,'Color','blue');
- experimental result
Marked peak
Rough wall lines, too lazy to write programs to draw straight lines. It is easier to draw straight lines. Each straight line is determined directly according to the peak value of (rho,theta).
Overlay final wall line
It is to overlay the binary diagram with the alternative wall line and compare the final wall line.