1, Object loading process
So, how is an image loaded when it is new? What are the steps and how to allocate memory space?
1.1 main process of object creation
Take this code as an example:
public static void main(String[] args) {
    Math math = new Math();
    math.compute();

    new Thread().start();
}
When we create a New Math object, we actually execute a new instruction to create the object. We have studied the process of class loading before, so what is the process of creating an object? As shown in the figure below. Let's analyze it step by step.
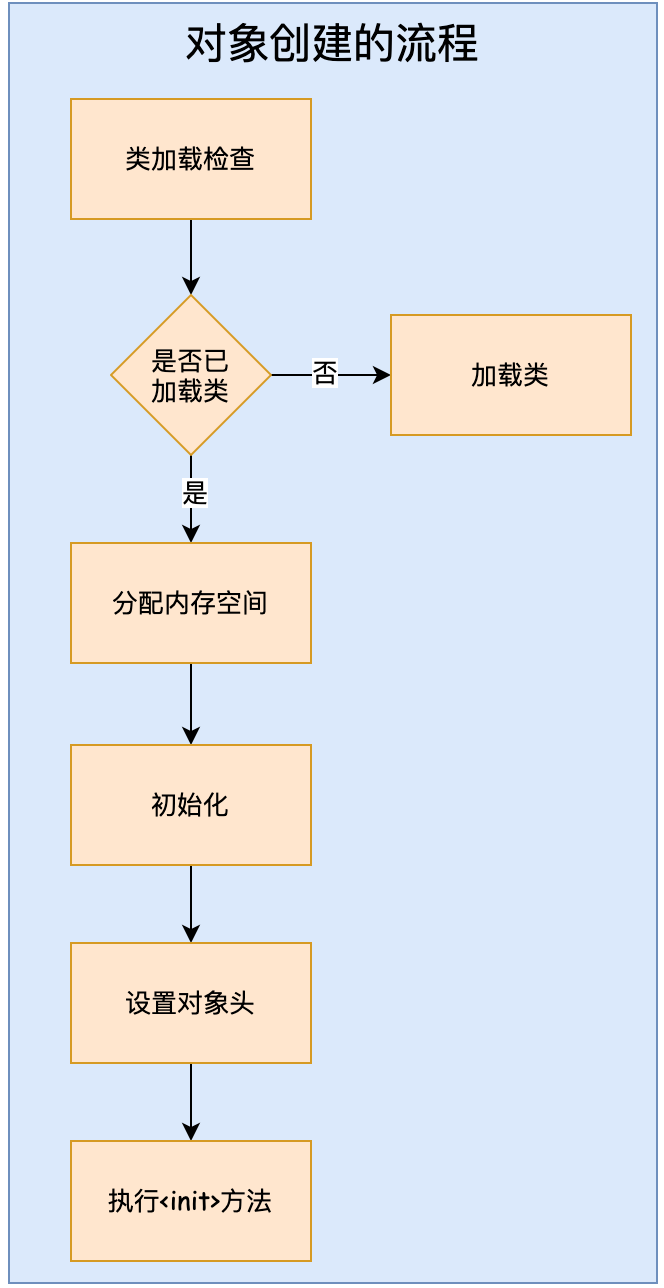
1.1.1 class loading inspection
When the virtual machine executes a new instruction, first check whether the parameters of the instruction can locate the symbolic reference of a class in the constant pool, and check the
Whether the class represented by the symbolic reference has been loaded, parsed and initialized (that is, check whether the class has been loaded). If not, the corresponding class loading process must be executed first.
1.1.2 allocate memory space
After the class loading check passes, the next step is to allocate memory space for the new object. How much memory an object needs is determined when the class is loaded. The process of allocating space for an object is to divide a certain size of memory from the java heap to the object. So how to divide the memory? If concurrency exists, how to deal with multiple objects that want to occupy the same block of memory at the same time?
1) How to divide memory space for objects?
Generally, there are two ways to allocate memory to objects: pointer collision and free list.
- Pointer collision
Bump the Pointer. The default method is pointer collision. If the memory in the Java heap is absolutely regular, all used memory is placed on one side, free memory is placed on the other side, and a pointer is placed in the middle as the indicator of the dividing point, the allocated memory is only to move the pointer to the free space for a distance equal to the size of the object.
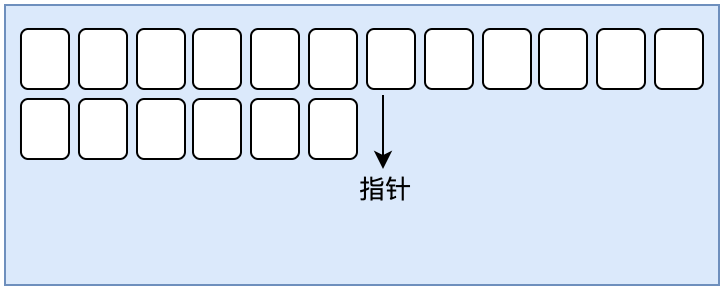
- free list
If the memory in the Java heap is not regular, and the used memory and free memory are staggered, there is no way to simply collide with the pointer. The virtual machine must maintain a list to record which memory blocks are available. When allocating, find a large enough space in the list to allocate to the object instance, and update the records on the list
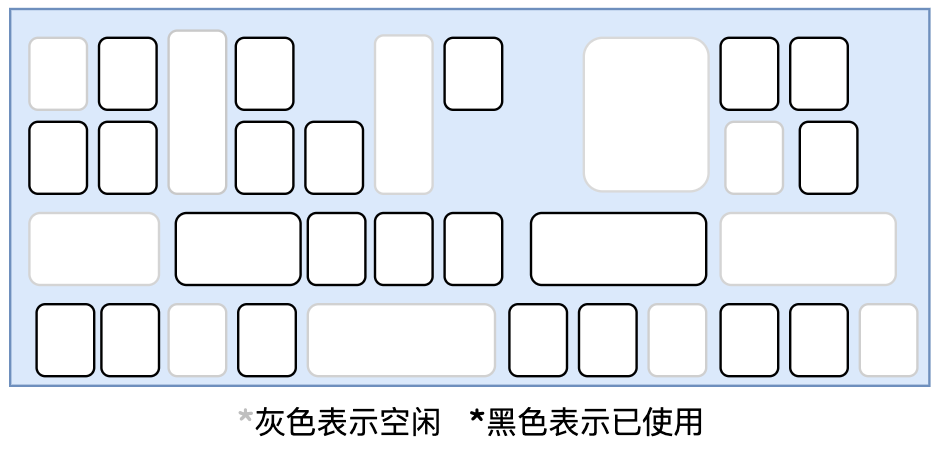
Different memory allocation methods adopt different methods in garbage collection.
2) How to solve the problem that multiple objects occupy space concurrently?
When multiple threads are started at the same time, the new objects of multiple threads must allocate memory. No matter what method is used for memory allocation, pointer collision or free list, these objects must compete for this memory. When multiple threads want to compete for a piece of memory, how to deal with it? There are usually two ways: CAS and local thread allocation buffer.
- CAS(compare and swap)
CAS can be understood as multiple threads competing for a fast memory at the same time. If they grab it, they will use it. If they don't grab it, they will try again to grab a piece of memory.
The virtual machine uses CAS with failure retry to ensure the atomicity of update operation to synchronize the action of allocating memory space.
- Thread local allocation buffer (TLAB)
What is TLAB? In short, TLAB is to avoid multi threads competing for memory. When each thread initializes, it allocates an exclusive memory for the thread in the heap space. The object of your own thread can be stored in your own exclusive memory. In this way, multiple threads will not compete for the same piece of memory. jdk8 allocates memory in TLAB by default.
The action of memory allocation is divided into different spaces according to threads, that is, each thread pre allocates a small piece of memory in the Java heap. Use the - XX:+UseTLAB parameter to set whether the virtual machine uses TLAB (the JVM will enable - XX:+UseTLAB by default), - 20: Tlabsize specifies the TLAB size.
1.1.3 initialization
After the memory allocation is completed, the virtual machine needs to initialize the allocated memory space to zero (excluding the object header). If TLAB is used, this working process is also necessary
It can be carried out in advance at the time of TLAB allocation. This step ensures that the instance field of the object can be used directly without assigning an initial value in Java code, and the program can access it
The zero value corresponding to the data type of these fields.
1.1.4 set object header
Let's take a look at this class:
public class Math {
    public static int initData = 666;
    public static User user = new User();

    public int compute() {
        int a = 1;
        int b = 2;
        int c = (a + b) * 10;
        return c;
    }

    public static void main(String[] args) {
        Math math = new Math();
        math.compute();

        new Thread().start();
    }
}
For a class, we usually see member variables and methods, but it doesn't mean that the information of a class is only what we can see. After the object initializes the zero value, the virtual machine should make necessary settings for the object, such as which class instance the object is, how to find the metadata information of the class, the hash code of the object, the GC generation age of the object, etc. This information is stored in the Object Header of the object. In the HotSpot virtual machine, the object contains three parts in memory:
- Object Header
- Instance Data
- Object Padding
Not much about instance data, which is the data we often see and use. We will focus on the object header and fill data. Let's start with the object header.
1. Components of object header
The object header of the HotSpot virtual machine includes the following parts of information:
Part I: Mark Word marking field, 32 bits occupy 4 bytes and 64 bits occupy 8 bytes. It is used to store the runtime data of the object itself, such as HashCode, GC generation age, lock status flag, lock held by thread, biased thread ID, biased timestamp, etc.
Part II: Klass Pointer type pointer, that is, the pointer of the object to its class metadata. The virtual machine uses this pointer to determine which class instance the object is. 4 bytes for compression on and 8 bytes for compression off.
Part III: array length, usually 4 bytes, only object array.
2.Mark Word mark field
As shown in the figure below, it is the mark word mark field of the object header of a 32-bit machine. The structure of object headers corresponding to different states of objects is also different. According to the lock status, there are five types of objects: stateless, lightweight lock, heavyweight lock, GC tag and biased lock.
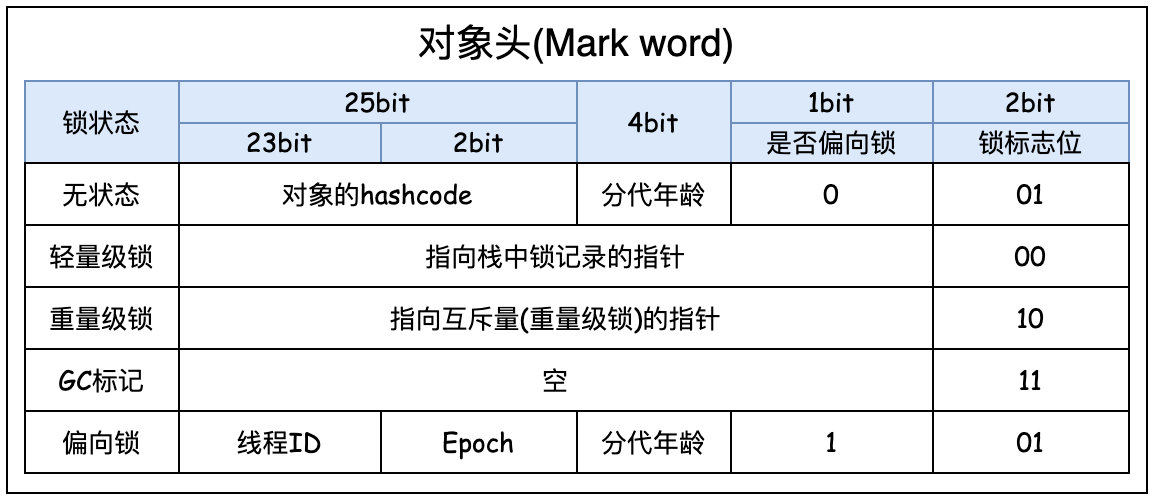
The unlocked state is the state of an ordinary object. After an object is new, there is no lock mark. At this time, its object header allocation is
- 25 bits: hashcode used to store objects
- 4 bits: used to store generation age. It was said before that a new object over 15 years old will be put into the old age before it has been recycled. Why is the age set to 15? Because the generation age is stored in 4 bytes, the maximum is 15.
- Bit 1: whether the storage is a bias lock
- Bit 2: storage lock flag bit
The last two are related to concurrent programming. Later, we will focus on this part when we study concurrent programming.
3.Klass Pointer type pointer
In 64 bit machines, the type pointer takes up 8 bytes, but when compression is turned on, it takes up 4 bytes
After the new object comes out, it is placed in the heap. The metadata information of the class is placed in the method area. There is a pointer in the head of the new object to the metadata information of the class in the method area. The pointer to this header is Klass Pointer. When the code executes to the math.compute() method call, how do you find the compute() method? In fact, it is found through the type pointer. (after knowing the address of the object pointed to by math, find the source code data in the method area according to the type pointer of the object, and then find the compute() method from the source code data).
public static void main(String[] args) {
  	Math math = new Math();
  	math.compute();
}
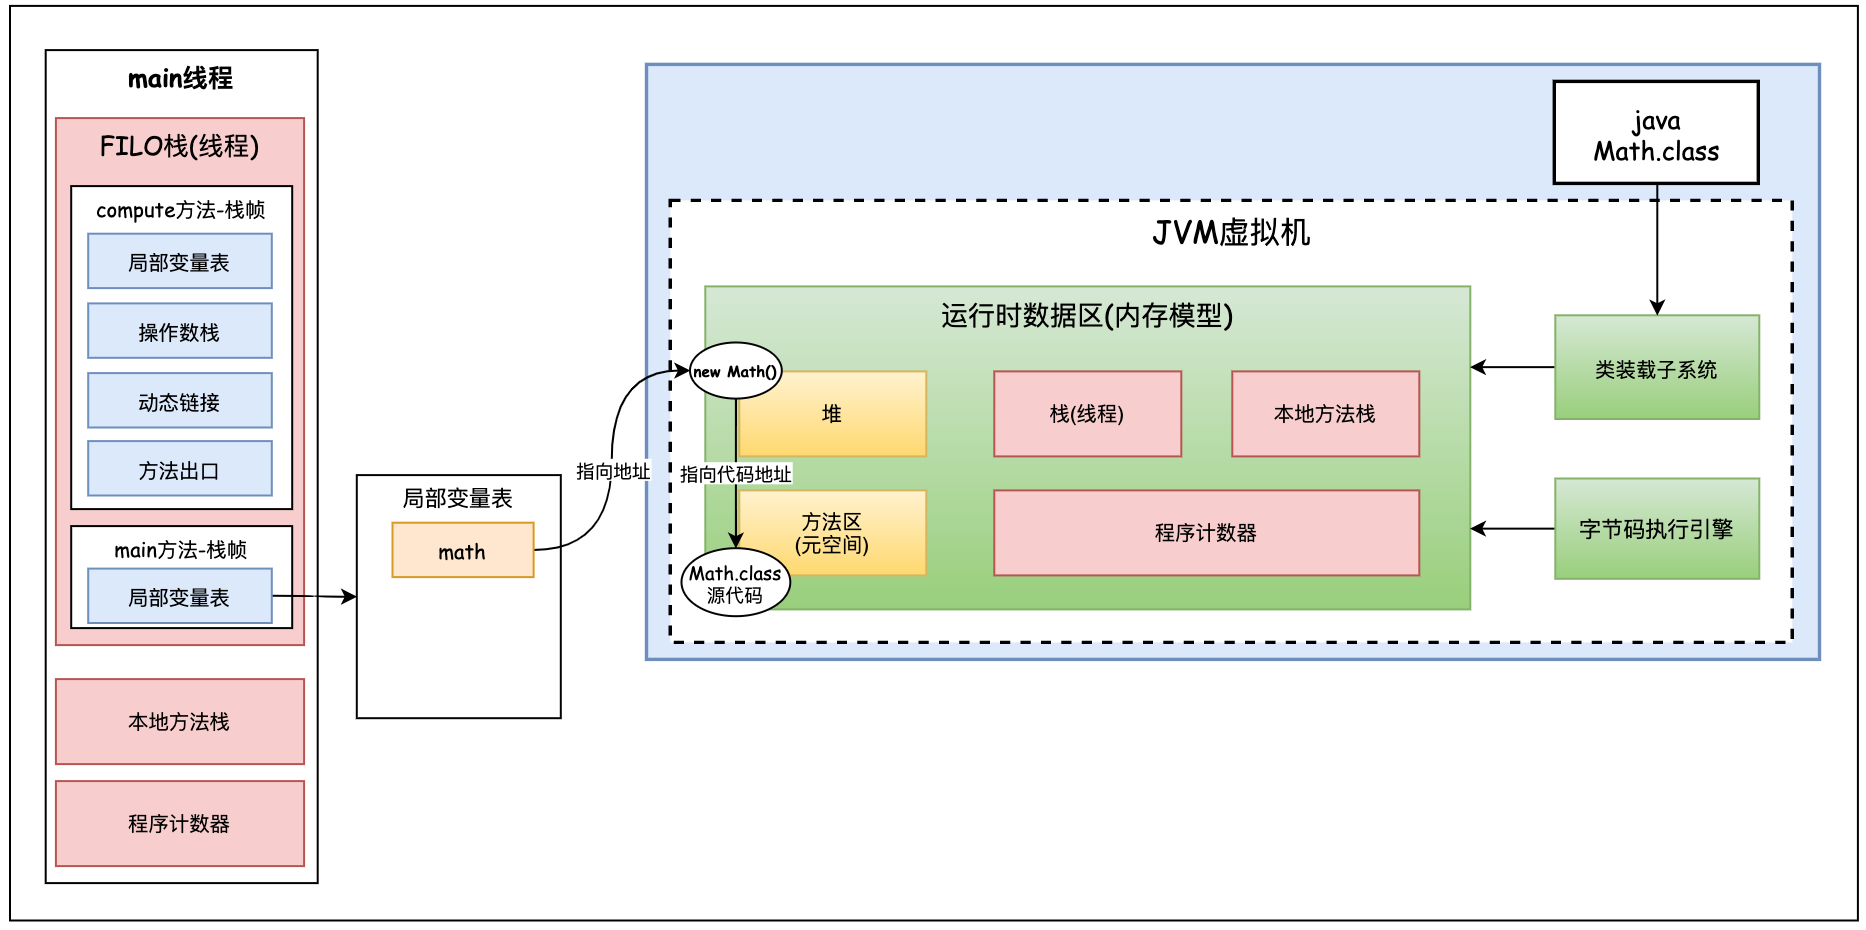
For the Math class, it also has a class object, as shown in the following code:
Class<? extends Math> mathClass = math.getClass();
Where is this class object stored? Is this class object a metadata object in the method area? no, it isn't. This class object is actually a piece of information created by the jvm virtual machine in the heap similar to the source code in the method area. As shown in the figure below, the upper right corner of heap space.
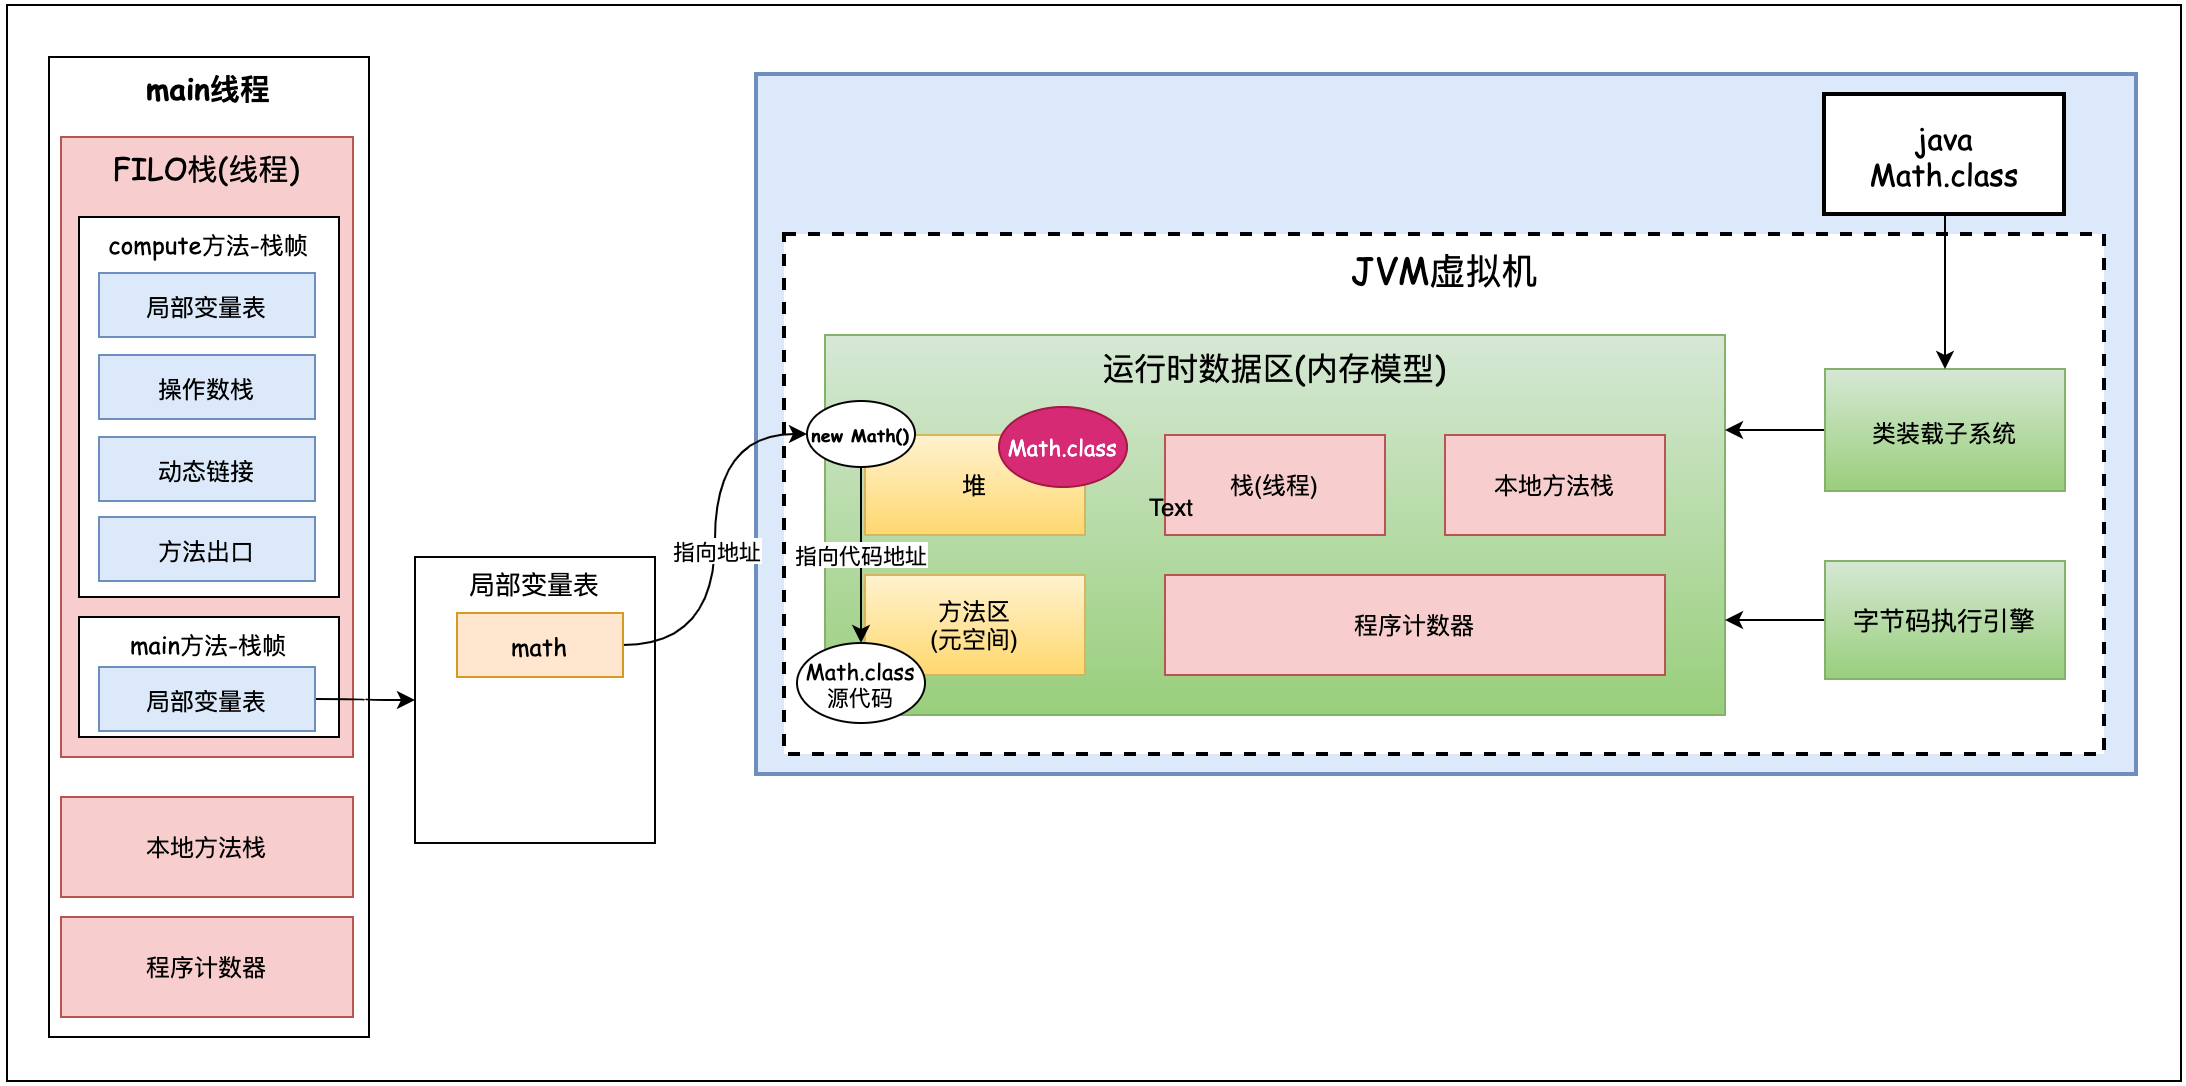
So what is the difference between a class object in the heap and a class meta object in the method area?
The metadata information of the class is placed in the method area. The class information in the heap can be understood as the convenient class access information provided by the jvm to java developers after class loading. Through class reflection, we know that we can get the name, method, attribute, inheritance relationship, interface, etc. of this class through math's class. We know that most implementations of the jvm are implemented in c + +. When the jvm gets the math class, it will not get it through the class information in the heap (math class information in the upper right corner of the heap above), but directly find the metadata in the method area through the type pointer, which is also implemented in c + +. The class metadata information in the method area is obtained and implemented in c + +. We java developers want to obtain class metadata information through the class information in the heap. The class class in the heap will not store metadata information. We can understand the class information in the heap as a mirror image of the class metadata information in the method area.
The meaning of Klass Pointer type pointer: Klass is not a class, and class pointer is a class pointer; Klass Pointer refers to the pointer of the class corresponding to the underlying c + +
4. Array length
If an object is an array, it will have an array length in addition to the Mark Word tag field and the Klass Pointer type pointer. Used to record the length of the array, usually 4 bytes.
The comments of the object header in the C + + source code of hotspot are as follows:
5. Object alignment
As mentioned above, there are three objects: object head, entity and object alignment. So what is object alignment?
For an object, sometimes there is object alignment, and sometimes there is no alignment. The JVM will align the read information of the object according to 8 bytes. As for why to align by 8 bytes? This is the underlying principle of the computer. A lot of practice has proved that the efficiency of reading objects according to 8 bytes will be very high. In other words, the number of bytes is required to be an integer multiple of 8. It can be 8, 16, 24, 32
6. Code view object structure
How to view the internal structure and size of an object? We can refer to the jol-core package and then call several of the methods to see it.
Import jar package
introduce jar Package:

  <dependency>
			<groupId>org.openjdk.jol</groupId>
			<artifactId>jol-core</artifactId>
			<version>0.9</version>
  </dependency>
Test code
import org.openjdk.jol.info.ClassLayout;

/**
 * Internal structure and size of query class
 */
public class JOLTest {
    public static void main(String[] args) {
        ClassLayout layout = ClassLayout.parseInstance(new Object());
        System.out.println(layout.toPrintable());

        System.out.println();
        ClassLayout layout1 = ClassLayout.parseInstance(new int[]{});
        System.out.println(layout1.toPrintable());

        System.out.println();
        ClassLayout layout2 = ClassLayout.parseInstance(new Object());
        System.out.println(layout2.toPrintable());

    }

    class A {
        int id;
        String name;
        byte b;
        Object o;
    }
}
Execution code run result:
java.lang.Object object internals:
 OFFSET  SIZE   TYPE DESCRIPTION                               VALUE
      0     4        (object header)                           01 00 00 00 (00000001 00000000 00000000 00000000) (1)
      4     4        (object header)                           00 00 00 00 (00000000 00000000 00000000 00000000) (0)
      8     4        (object header)                           e5 01 00 f8 (11100101 00000001 00000000 11111000) (-134217243)
     12     4        (loss due to the next object alignment)
Instance size: 16 bytes
Space losses: 0 bytes internal + 4 bytes external = 4 bytes total

[I object internals:
 OFFSET  SIZE   TYPE DESCRIPTION                               VALUE
      0     4        (object header)                           01 00 00 00 (00000001 00000000 00000000 00000000) (1)
      4     4        (object header)                           00 00 00 00 (00000000 00000000 00000000 00000000) (0)
      8     4        (object header)                           6d 01 00 f8 (01101101 00000001 00000000 11111000) (-134217363)
     12     4        (object header)                           00 00 00 00 (00000000 00000000 00000000 00000000) (0)
     16     0    int [I.<elements>                             N/A
Instance size: 16 bytes
Space losses: 0 bytes internal + 0 bytes external = 0 bytes total

com.lxl.jvm.JOLTest$A object internals:
 OFFSET  SIZE               TYPE DESCRIPTION                               VALUE
      0     4                    (object header)                           01 00 00 00 (00000001 00000000 00000000 00000000) (1)
      4     4                    (object header)                           00 00 00 00 (00000000 00000000 00000000 00000000) (0)
      8     4                    (object header)                           12 f2 00 f8 (00010010 11110010 00000000 11111000) (-134155758)
     12     4                int A.id                                      0
     16     1               byte A.b                                       0
     17     3                    (alignment/padding gap)
     20     4   java.lang.String A.name                                    null
     24     4   java.lang.Object A.o                                       null
     28     4                    (loss due to the next object alignment)
Instance size: 32 bytes
Space losses: 3 bytes internal + 4 bytes external = 7 bytes total
Internal structure of Object:
java.lang.Object object internals:
 OFFSET  SIZE   TYPE DESCRIPTION               VALUE
      0     4        (object header)           01 00 00 00 (00000001 00000000 00000000 00000000) (1)
      4     4        (object header)           00 00 00 00 (00000000 00000000 00000000 00000000) (0)
      8     4        (object header)           e5 01 00 f8 (11100101 00000001 00000000 11111000) (-134217243)
     12     4        (loss due to the next object alignment)
Instance size: 16 bytes
Space losses: 0 bytes internal + 4 bytes external = 4 bytes total
There are four lines:
- The first two lines are the object header (Mark Word), occupying 8 bytes;
- The third line is the Klass Pointer type pointer, which occupies 4 bytes. If it is not compressed, it will occupy 8 bytes;
- The fourth line is Object Alignment. Object Alignment is to ensure that the number of bits occupied by the whole object is a multiple of 8.
Internal structure of array object
[I object internals:
 OFFSET  SIZE   TYPE DESCRIPTION             VALUE
      0     4        (object header)         01 00 00 00 (00000001 00000000 00000000 00000000) (1)
      4     4        (object header)         00 00 00 00 (00000000 00000000 00000000 00000000) (0)
      8     4        (object header)         6d 01 00 f8 (01101101 00000001 00000000 11111000) (-134217363)
     12     4        (object header)         00 00 00 00 (00000000 00000000 00000000 00000000) (0)
     16     0    int [I.<elements>                             N/A
Instance size: 16 bytes
Space losses: 0 bytes internal + 0 bytes external = 0 bytes total
There are five lines:
- The first two lines are Mark word tag fields, accounting for 8 digits;
- The third line is the Klass Pointer type pointer, accounting for 4 bits;
- The fourth line is unique to the array, marking the length of the array, accounting for 4 bits.
- The fifth line is object alignment. Since the first four lines are 16 bits in total, there is no need to supplement here
Internal structure of A (custom) object
com.lxl.jvm.JOLTest$A object internals:
 OFFSET  SIZE          TYPE DESCRIPTION      VALUE
      0     4          (object header)       01 00 00 00 (00000001 00000000 00000000 00000000) (1)
      4     4          (object header)       00 00 00 00 (00000000 00000000 00000000 00000000) (0)
      8     4          (object header)       12 f2 00 f8 (00010010 11110010 00000000 11111000) (-134155758)
     12     4          int A.id              0
     16     1          byte A.b              0
     17     3          (alignment/padding gap)
     20     4   java.lang.String A.name      null
     24     4   java.lang.Object A.o         null
     28     4          (loss due to the next object alignment)
Instance size: 32 bytes
Space losses: 3 bytes internal + 4 bytes external = 7 bytes total
There are four lines:
- The first two lines are the object header (Mark Word), occupying 8 bytes;
- The third line is the Klass Pointer type pointer, which occupies 4 bytes. If it is not compressed, it will occupy 8 bytes;
- The fourth line is int type, accounting for 4 bits.
- The fifth line is byte type: 1 bit.
- The sixth line is byte complement: Step 3.
- The seventh line is String type: 4 digits
- The eighth line is the Object type: 4 digits
- The ninth line is object alignment, and 4 bits are added. The first 28 digits are not multiples of 8, so 4 digits are added.
1.1.5. Execution method
The init method here is not a construction method, but an init method called by c + +. Execute the method, that is, the object is initialized according to the programmer's wishes, that is, assign a value to the attribute in the real sense (note that this is different from the above initialization zero value, which is the value set by the programmer), and call the construction method.
1.1.6 pointer compression
1. What is pointer compression for java objects?
Starting with jdk1.6, in 64 bit operating systems, jvm turns on pointer compression by default. Pointer compression is the compression of Klass Pointer type pointers, including Object objects and String objects. Take the following example:
import org.openjdk.jol.info.ClassLayout;

/**
 * Internal structure and size of query class
 */
public class JOLTest {
    public static void main(String[] args) {
        System.out.println();
        ClassLayout layout2 = ClassLayout.parseInstance(new A());
        System.out.println(layout2.toPrintable());
    }

    public static class A {
        int id;
        String name;
        byte b;
        Object o;
    }
}
Running this code, the class structure of A:
com.lxl.jvm.JOLTest$A object internals:
 OFFSET  SIZE          TYPE DESCRIPTION      VALUE
      0     4          (object header)       01 00 00 00 (00000001 00000000 00000000 00000000) (1)
      4     4          (object header)       00 00 00 00 (00000000 00000000 00000000 00000000) (0)
      8     4          (object header)       12 f2 00 f8 (00010010 11110010 00000000 11111000) (-134155758)
     12     4          int A.id              0
     16     1          byte A.b              0
     17     3          (alignment/padding gap)
     20     4   java.lang.String A.name      null
     24     4   java.lang.Object A.o         null
     28     4          (loss due to the next object alignment)
Instance size: 32 bytes
Space losses: 3 bytes internal + 4 bytes external = 7 bytes total
Pointer compression is on by default. This class structure has been analyzed above. Here we mainly see that the third line Klass Pointer and the seventh line String occupy 4 bits, and the eighth line Object occupies 4 bits. We know that all the addresses stored here are pointer addresses.
Let's manually turn off pointer compression:
There are two commands for pointer compression: UseCompressedOops(Compress all pointer objects, including header Head and others) and UseCompressedClassPointers(Compress pointer objects only)

Turn on pointer compression:  -XX:+UseCompressedOops(Default on),
Disable pointer compression:  -XX:-UseCompressedOops

Meaning of parameter:
  				compressed: Compression means
  				oop(ordinary object pointer): Object pointer
Set XX:-UseCompressedOops in the VM configuration parameter of the main method

Then let's look at the running results:
com.lxl.jvm.JOLTest$A object internals:
 OFFSET  SIZE        TYPE DESCRIPTION           VALUE
      0     4        (object header)            01 00 00 00 (00000001 00000000 00000000 00000000) (1)
      4     4        (object header)            00 00 00 00 (00000000 00000000 00000000 00000000) (0)
      8     4        (object header)            d0 0c be 26 (11010000 00001100 10111110 00100110) (649989328)
     12     4        (object header)            02 00 00 00 (00000010 00000000 00000000 00000000) (2)
     16     4        int A.id                   0
     20     1        byte A.b                   0
     21     3        (alignment/padding gap)
     24     8   java.lang.String A.name         null
     32     8   java.lang.Object A.o            null
Instance size: 40 bytes
Space losses: 3 bytes internal + 0 bytes external = 3 bytes total
Look at the change points:
- Klass Pointer used to be 4 bits, but now it has 4 more bits. The type pointer occupies 8 bits
- The String object originally occupied 4 bits, but it was 8 bits without compression
- The Object object used to occupy 4 bits, but it does not compress and occupies 8 bits
From the phenomenon, we can see the difference between compression and non compression. So why compress pointers?
2. Why do I compress pointers?
1. Using 32-bit pointer in HotSpot on 64 bit platform will increase memory usage by about 1.5 times. Using a larger pointer to move data between main memory and cache will occupy a larger bandwidth. At the same time, GC will also bear a greater pressure (less memory, more objects can be stored, and the frequency of triggering GC will be reduced). In order to reduce memory consumption on 64 bit platforms, pointer compression is enabled by default.
2. In the jvm, the 32-bit address supports up to 4G memory (the 32nd power of 2). The compression, coding and decoding methods of the object pointer can be optimized, so that the jvm can support a larger memory configuration (less than or equal to 32G) with only 32-bit address
3. When the heap memory is less than 4G, it is not necessary to enable pointer compression. The jvm will directly remove the high 32-bit address, that is, use the low virtual address space
4. When the heap memory is greater than 32G, the compressed pointer will fail, and 64 bits (i.e. 8 bytes) will be forced to address java objects, which will lead to the problem of 1. Therefore, it is better not to exceed 32G
2, Object's memory allocation
The memory allocation process of the object is as follows:
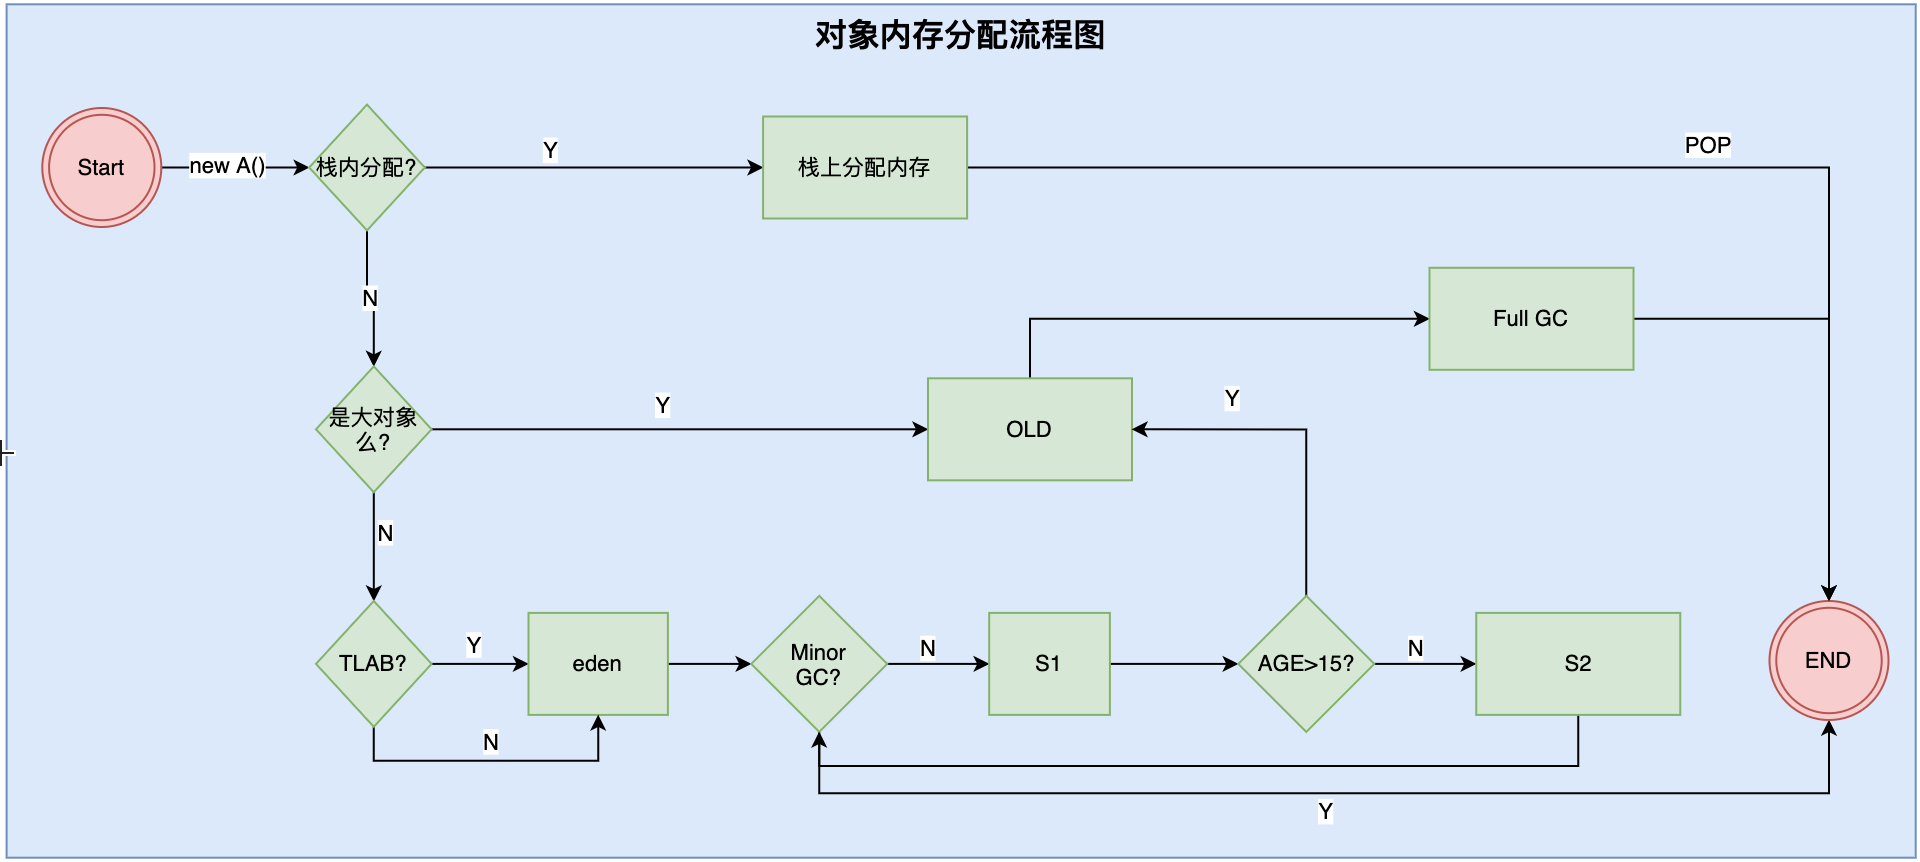
During object creation, memory will be allocated to the object. The overall process of allocating memory is as follows:
Step 1: determine whether there is enough space on the stack.
This is different from the previous understanding. It has always been thought that the objects from new are allocated on the heap. In fact, they are not allocated on the stack when certain conditions are met. So why allocate on the stack? When is it allocated on the stack? How can objects allocated on the stack be recycled? Let's analyze it in detail.
1. Why is it allocated on the stack?
Through the JVM memory model, we know that Java objects are allocated on the heap. When the heap space (new generation or old generation) is almost full, GC will be triggered, and objects that are not referenced by any other objects will be recycled. If a large number of such garbage objects appear on the heap, GC will be triggered frequently, affecting the performance of the application. In fact, these objects are temporarily generated objects. If the probability of such objects entering the heap can be reduced, the number of GC triggers can be successfully reduced. We can put such an object on the heap, so that the memory space occupied by the object can be destroyed with the stack frame out of the stack, which reduces the pressure of garbage collection.
2. Under what circumstances will it be allocated on the stack?
In order to reduce the number of temporary objects allocated in the heap, the JVM determines whether the object will be accessed externally through escape analysis. If it does not escape, the object can be allocated memory on the stack. It is destroyed with the stack frame out of the stack to reduce the pressure of GC.
3. What is escape?
So what is escape analysis? To know escape analysis, we must first know what is escape? Let's look at an example
public class Test {

    public User test1() {
        User user = new User();
        user.setId(1);
        user.setName("Zhang San");
        return user;
    }

    public void test2() {
        User user = new User();
        user.setId(2);
        user.setName("Li Si");
    }
}
There are two methods in Test. The test1() method constructs the user object and returns the user. The returned object must be used externally. In this case, the user object escapes from the test1() method.
The test2() method also constructs the user object, but this object is only valid inside the test2() method and will not be used outside the method. This is that the user object does not escape.
Whether an object is an escape object depends on whether the object can be accessed by an external object.
Understand why there are no escaped objects and why they should be allocated on the stack in combination with on stack allocation? Look at the following figure:
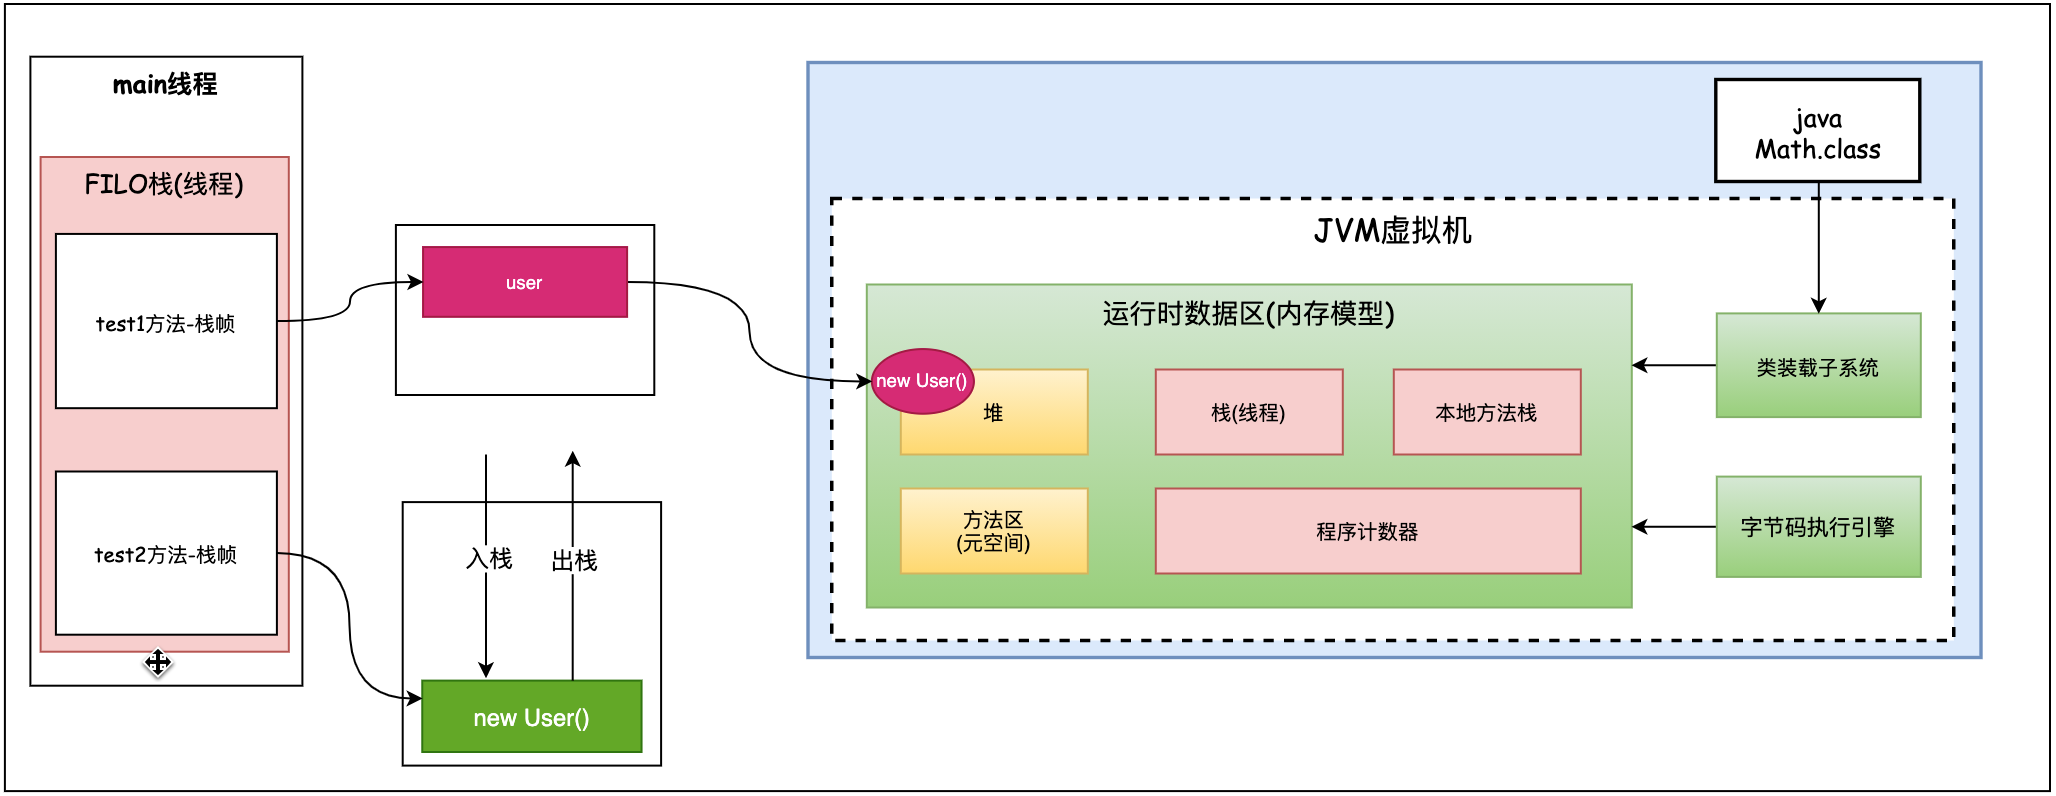
The user object of Test2() method will only be valid in the current method. If it is placed in the heap, after the method ends, the object is already garbage, but it occupies heap memory space in the heap. If this object is put on the stack, as the method is put on the stack, the logical processing ends, the object becomes garbage, and then comes out of the stack with the stack frame. This saves heap space. Especially when there are many non escape objects. It can save a lot of heap space and reduce the number of GC.
4. What is the escape analysis of objects?
This is to analyze the dynamic scope of an object. When an object is defined in a method, it may be referenced by external methods, such as passing it as a parameter to other places. In the above example, it is obvious that the user object in test1() method is returned. The scope of this object is uncertain. For the user object in test2 method, we can determine that this object can be regarded as an invalid object when the method ends. For such an object, we can actually allocate it in stack memory, Let it be reclaimed with stack memory at the end of the method.
In the vernacular, judge whether the user object will escape outside the method. If it will not escape outside the method, it is recommended to allocate a piece of memory space in the heap to store temporary variables. Will objects that do not escape outside the method be allocated to heap space? No, certain conditions need to be met: the first condition is that the JVM has enabled escape analysis. Escape analysis can be turned on / off by setting parameters.
-XX:+DoEscapeAnalysis     Open escape analysis
-XX:-DoEscapeAnalysis			Turn off escape analysis
In this case, the JVM can optimize the memory allocation location of the object by turning on the escape analysis parameter (- XX:+DoEscapeAnalysis), so that it is preferentially allocated on the stack through scalar replacement (allocation on the stack). After JDK7, escape analysis is turned on by default. If you want to turn off the use parameter (- XX:-DoEscapeAnalysis)
5. What is scalar substitution?
If an object can be allocated on the stack through escape analysis, we know that the default space of a thread stack is 1M, and the stack frame space is smaller. Object allocation requires a continuous space. After calculation, if the object can be placed on the stack frame, but the space of the stack frame is not continuous, this is not possible for an object, because the object needs a continuous space. Then what shall I do? At this time, the JVM makes an optimization. Even if there is no continuous space in the stack frame, it can put the object in the stack frame through other methods. This method is scalar replacement.
What is scalar substitution?
If an object is allocated on the stack through escape analysis, take User as an example. In order to put everything in the User in a limited space, we will not create a complete object on the stack, but just put the member variables in the object into the stack frame. As shown below:
There is no complete space in the stack frame space to put the User object. In order to put it down, we use the scalar replacement method. Instead of putting the whole User object into the stack frame, we take out the member variables in the User and put them in each free space. This is not to put a complete object, but to break the object into member variables one by one and put them on the stack frame. Of course, there will be a place to identify which object this attribute belongs to, which is scalar substitution.
When it is determined through escape analysis that the object will not be accessed externally and the object can be further decomposed, the JVM will not create the object, but decompose several member variables of the object to be replaced by the member variables used by this method, which allocate space on the stack frame or register, This will not cause insufficient object memory allocation because there is no large contiguous space. Enable scalar substitution parameter is
-XX:+EliminateAllocations
JDK7 is enabled by default.
6. Scalar substitution and aggregation
So what is scalar and what is aggregate?
Scalar is the quantity that cannot be further decomposed, and the basic data type of JAVA is scalar (such as int, long and other basic data types and reference types). The opposition of scalar is the quantity that can be further decomposed, and this quantity is called aggregate quantity. In JAVA, an object is an aggregate that can be further decomposed.
7. Summary + case analysis
Some objects from new can be placed on the stack. What kind of objects can be placed on the stack? Determine whether an object will escape outside the method through escape analysis. If it will not escape outside the method, it is recommended to allocate a memory space in the heap to store such variables. Does that mean that all objects that will not escape outside the method will be allocated to heap space? No, certain conditions need to be met:
- Open escape analysis
- Enable scalar substitution
The following is an example:
public class AllotOnStack {
    public static void main(String[] args) {
        long start = System.currentTimeMillis();
        for (int i = 0; i < 100000000; i++) {
            alloc();
        }
        long end = System.currentTimeMillis();
        System.out.println(end-start);
    }
    private static void alloc() {
        User user = new User();
        user.setId(1);
        user.setName("zhuge");
     }
}
There is a code above, calling the 100 million alloc() method in the main method. In the alloc() method, new the User object, but this object does not escape from the alloc() method. The for loop runs 100 million times, and 100 million objects will be generated. If allocated on the heap, a large number of GC will be generated; If allocated on the stack, there is almost no GC generation. What we are talking about here is that there is almost no GC, that is, there may not be no GC at all. GC may also be generated due to other circumstances.
In order to see the obvious effect of allocation on the stack, we analyze it in several cases:
- By default
Set parameters:
I currently use jdk8. By default, I enable escape analysis (- XX:+DoEscapeAnalysis) and scalar replacement (- XX:+EliminateAllocations).
-Xmx15m -Xms15m -XX:+PrintGC
Set the above parameters: reduce the heap memory and print the GC log, so that we can see the results clearly.
Operation results:
10
We see no GC generated. Because escape analysis is enabled, scalar substitution is enabled. This means that the object is not allocated on the heap, but on the stack.
Are you wondering why 100 million objects can be placed on the stack?
Because an object is generated, when this method is executed, the object will be recycled along with the stack frame. Then allocate the next object, which is recycled again after execution. and so on.
- Turn off escape analysis and turn on scalar substitution
In this case, escape analysis is turned off and scalar substitution is turned on. Set jvm parameters as follows:
-Xmx15m -Xms15m -XX:+PrintGC -XX:-DoEscapeAnalysis -XX:+EliminateAllocations
In fact, scalar substitution will take effect only when escape analysis is enabled. Therefore, in this case, objects will not be allocated on the stack, but on the heap, which will produce a large number of GC. Let's look at the operation results:
[GC (Allocation Failure)  4842K->746K(15872K), 0.0003706 secs]
[GC (Allocation Failure)  4842K->746K(15872K), 0.0003987 secs]
[GC (Allocation Failure)  4842K->746K(15872K), 0.0004303 secs]
......
[GC (Allocation Failure)  4842K->746K(15872K), 0.0004012 secs]
[GC (Allocation Failure)  4842K->746K(15872K), 0.0003712 secs]
[GC (Allocation Failure)  4842K->746K(15872K), 0.0003978 secs]
[GC (Allocation Failure)  4842K->746K(15872K), 0.0003969 secs]
[GC (Allocation Failure)  4842K->746K(15872K), 0.0011955 secs]
[GC (Allocation Failure)  4842K->746K(15872K), 0.0004206 secs]
[GC (Allocation Failure)  4842K->746K(15872K), 0.0004172 secs]
[GC (Allocation Failure)  4842K->746K(15872K), 0.0013991 secs]
[GC (Allocation Failure)  4842K->746K(15872K), 0.0006041 secs]
[GC (Allocation Failure)  4842K->746K(15872K), 0.0003653 secs]
773
We see that a large number of GC s are generated, and the time is extended from 10 milliseconds to 773 milliseconds
- Turn on escape analysis and turn off scalar substitution
In this case, escape analysis is turned off and scalar substitution is turned on. Set jvm parameters as follows:
-Xmx15m -Xms15m -XX:+PrintGC -XX:+DoEscapeAnalysis -XX:-EliminateAllocations
In fact, only when escape analysis is enabled, scalar substitution does not take effect, which means that if the object cannot be placed in the stack space, it will be directly placed in the heap space. Let's look at the operation results:
[GC (Allocation Failure)  4844K->748K(15872K), 0.0003809 secs]
[GC (Allocation Failure)  4844K->748K(15872K), 0.0003817 secs]
.......
[GC (Allocation Failure)  4844K->748K(15872K), 0.0003751 secs]
[GC (Allocation Failure)  4844K->748K(15872K), 0.0004613 secs]
[GC (Allocation Failure)  4844K->748K(15872K), 0.0005310 secs]
[GC (Allocation Failure)  4844K->748K(15872K), 0.0003402 secs]
[GC (Allocation Failure)  4844K->748K(15872K), 0.0003661 secs]
[GC (Allocation Failure)  4844K->748K(15872K), 0.0004457 secs]
[GC (Allocation Failure)  4844K->748K(15872K), 0.0004528 secs]
[GC (Allocation Failure)  4844K->748K(15872K), 0.0005270 secs]
657
We see that escape analysis is turned on, but scalar substitution is not turned on, which also produces a large number of GC.
Usually, we turn on escape analysis and scalar substitution at the same time.
Step 2: judge whether it is a large object, not in Eden area
Judge whether it is a large object. If so, it will be directly put into the elderly generation. If not, judge whether it is TLAB? If yes, allocate a small space to the thread in Eden and put the object in Eden area. If TLAB is not used, it will be directly placed in Eden area.
What is TLAB? Thread local allocation buffer (TLAB). In short, TLAB is to avoid multi threads competing for memory. When each thread initializes, it allocates an exclusive memory for the thread in the heap space. The object of your own thread can be stored in your own exclusive memory. In this way, multiple threads will not compete for the same piece of memory. jdk8 allocates memory in TLAB by default.
Set whether TLAB is enabled for the virtual machine through the - XX:+UseTLAB parameter (the JVM will enable - XX:+UseTLAB by default), - 20: Tlabsize specifies the TLAB size.
1. How are the objects allocated in Eden district?
For details of this section, refer to the article: https://www.cnblogs.com/ITPower/p/15384588.html
Here is a diagram of memory allocation, and then we use a case to verify:
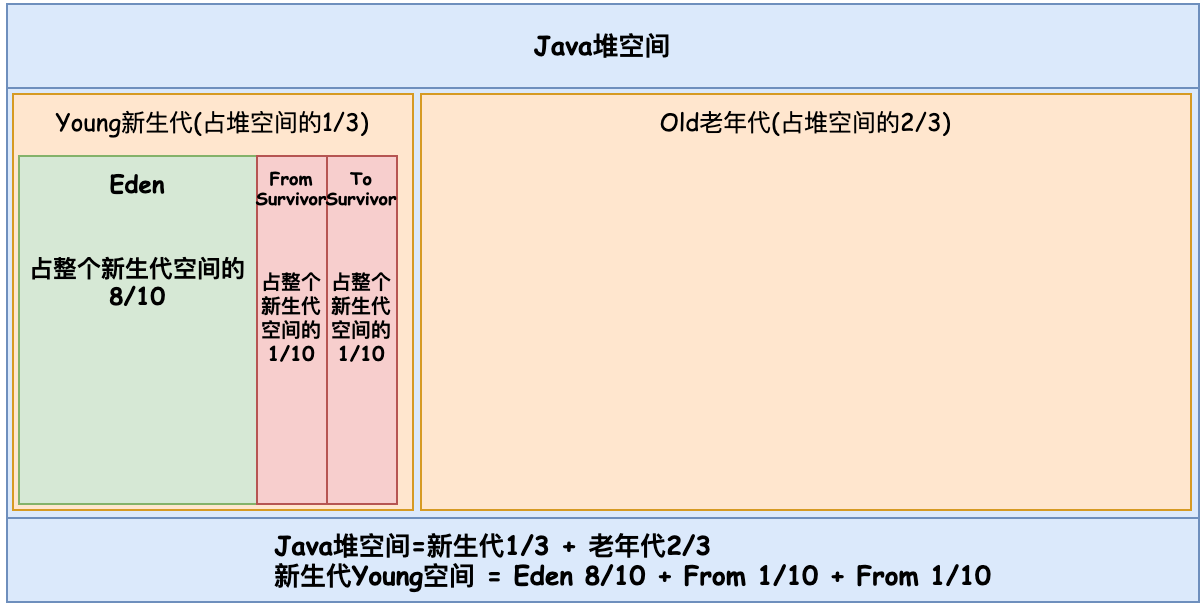
Case code:
public class GCTest {
    public static void main(String[] args) throws InterruptedException {
        byte[] allocation1, allocation2;
        allocation1 = new byte[60000*1024];
    }
}
Look at this code. It defines a byte array allocation2 and allocates a memory space of 60M to it.
Let's take a look at the running effect of the program. Here, in order to facilitate the detection of the effect, set the jvm parameters to print the GC log details
-XX:+PrintGCDetails Print GC Trust information
a) Eden, you can just fit the object
Operation results:
Heap
 PSYoungGen      total 76288K, used 65536K [0x000000076ab00000, 0x0000000770000000, 0x00000007c0000000)
  eden space 65536K, 100% used [0x000000076ab00000,0x000000076eb00000,0x000000076eb00000)
  from space 10752K, 0% used [0x000000076f580000,0x000000076f580000,0x0000000770000000)
  to   space 10752K, 0% used [0x000000076eb00000,0x000000076eb00000,0x000000076f580000)
 ParOldGen       total 175104K, used 0K [0x00000006c0000000, 0x00000006cab00000, 0x000000076ab00000)
  object space 175104K, 0% used [0x00000006c0000000,0x00000006c0000000,0x00000006cab00000)
 Metaspace       used 3322K, capacity 4496K, committed 4864K, reserved 1056768K
  class space    used 365K, capacity 388K, committed 512K, reserved 1048576K
- Cenozoic about 76M
- Eden district is about 65M, occupying 100%
- from/to 1M, 0%
- Elderly generation month 175M, accounting for 0%
- Metadata space is about 3M, occupying 365k.
We see the Cenozoic Eden district full. In fact, our object is only 60M, and Eden district is 65M. Why is it full? Because the Eden area also stores some classes started by the JVM. Because Eden district can accommodate it, it will not be put in the elderly generation.
The metadata space of about 3M is the mirror image of the class code information in the stored method area. We mentioned in the type pointer above that the metadata information in the method area is mirrored in the heap.
For the Math class, it also has a class object, as shown in the following code:
Class<? extends Math> mathClass = math.getClass();
Where is this class object stored? Is this class object a metadata object in the method area? no, it isn't. This class object is actually a piece of information created by the jvm virtual machine in the heap similar to the source code in the method area. As shown in the figure below, the upper right corner of heap space.

b) When Eden's area is full, GC will be triggered
public class GCTest {
    public static void main(String[] args) throws InterruptedException {
        byte[] allocation1, allocation2;
                /*, allocation3, allocation4, allocation5, allocation6*/
        allocation1 = new byte[60000*1024];
        allocation2 = new byte[8000*1024];
    }
}
Let's take a look at this case. We just set allocation1 = 60m and the Eden area is just full. At this time, we are allocating 8M to the object allocation2. Because Eden is full, it will trigger GC. 60M from/to cannot be put down. It will be directly put into the old generation, and then 8M of allocation2 will be put into the Eden area. Look at the operation results:
[GC (Allocation Failure) [PSYoungGen: 65245K->688K(76288K)] 65245K->60696K(251392K), 0.0505367 secs] [Times: user=0.25 sys=0.04, real=0.05 secs]
Heap
 PSYoungGen      total 76288K, used 9343K [0x000000076ab00000, 0x0000000774000000, 0x00000007c0000000)
  eden space 65536K, 13% used [0x000000076ab00000,0x000000076b373ef8,0x000000076eb00000)
  from space 10752K, 6% used [0x000000076eb00000,0x000000076ebac010,0x000000076f580000)
  to   space 10752K, 0% used [0x0000000773580000,0x0000000773580000,0x0000000774000000)
 ParOldGen       total 175104K, used 60008K [0x00000006c0000000, 0x00000006cab00000, 0x000000076ab00000)
  object space 175104K, 34% used [0x00000006c0000000,0x00000006c3a9a010,0x00000006cab00000)
 Metaspace       used 3323K, capacity 4496K, committed 4864K, reserved 1056768K
  class space    used 365K, capacity 388K, committed 512K, reserved 1048576K
As we predicted
- Younger generation 76M, 9343k used
- Eden 65m takes up 13%, of which there is 80M allocated by allocation2, and the other part is generated by the operation of the jvm
- 10M from area, occupying 6%. The data stored here is definitely not the 60M of allocation1, because it cannot be stored. The data here should be jvm related data
- to 10M, 0% occupied
- In the old age, 175M occupied 60M, which was recycled by allocation1
- The metadata occupies 3M and uses 365k. This piece of data has not changed because the metadata information has not changed.
2. Object dynamic age judgment
If the total size of a batch of objects is greater than 50% of the memory size of the Survivor area in the current Survivor area (one area is the s area where the objects are placed), then objects greater than or equal to the maximum age of this batch of objects can directly enter the elderly generation,
For example, there are a group of objects in the Survivor area. The sum of multiple age objects with age 1 + age 2 + age n exceeds 50% of the Survivor area. At this time, objects with age n or above will be placed in the elderly generation. This rule actually hopes that those who may survive for a long time will enter the elderly generation as soon as possible.
The object dynamic age determination mechanism is generally triggered after minor gc.
3. Old age space allocation guarantee mechanism
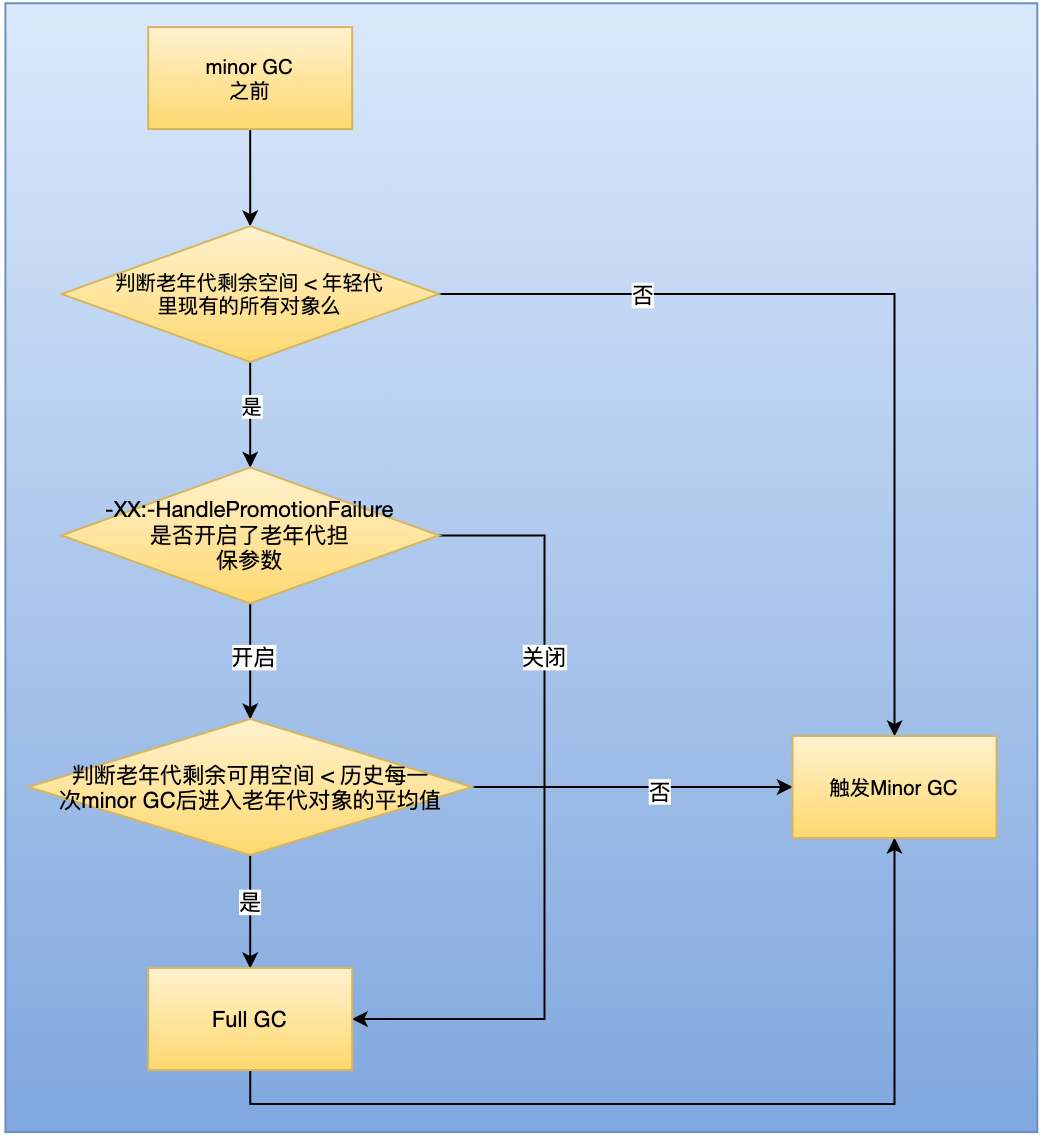
- Before each minor gc of the younger generation, the JVM will calculate the remaining available space in the old age. If the available space is less than the sum of the sizes of all existing objects in the younger generation (including garbage objects), you will see whether the parameter "- XX:-HandlePromotionFailure" (jdk1.8 is set by default) is set. If this parameter is available, you will see whether the available memory size of the older generation is greater than the average size of objects entering the old age after each minor gc.
- If the result of the previous step is less than or the parameters mentioned above are not set, then the Full GC will be triggered directly, and then the Minor GC will be triggered. If there is not enough space to store new objects after recycling, the "OOM" will occur
- If the size of the remaining surviving objects that need to be moved to the old generation after the minor gc is still larger than the available space of the old generation, the full GC will also be triggered. If there is still no space for the surviving objects after the minor gc after the full GC, the "OOM" will also occur.
After combing through this logic, why is it called guarantee mechanism. When the Minor GC is triggered, a condition judgment is made to estimate whether the space of the old age can accommodate the objects of the new generation. If it can accommodate, the Minor GC is triggered directly. If not, the Full GC is triggered first. Setting guarantee parameters when triggering Full GC will increase asynchronous judgment instead of directly triggering Full GC. Judge whether the remaining available space of the elderly generation is less than the average value of objects entering the elderly generation after each Minor GC in history. Such judgment can reduce the number of Full GC. Because the new generation will recover part of the memory after triggering the Full GC, and the rest will be put into the old generation, which may be put down.
The third step is to put large objects into the old age
1. What is a big object?
- Eden Park can't let go. It must be a big object.
- Set what is a large object through parameters- 20: Pretenuresizethreshold = 1000000 (in bytes) - XX:+UseSerialGC. If the object exceeds the set size, it will directly enter the older generation, not the younger generation. This parameter is only valid for the Serial and ParNew collectors.
- The long-term survivors will enter the elderly generation. The virtual machine uses the idea of generational collection to manage memory. The virtual machine sets an object Age counter for each object. If the object can still survive after Eden was born and passed the first Minor GC and can be accommodated by Survivor, it will be moved to Survivor space and the object Age will be set to 1. Each time an object Survivor survives MinorGC, its Age increases by 1 year. When its Age increases to a certain extent (the default is 15 years old, the CMS collector is 6 years old, and different garbage collectors will be slightly different), it will be promoted to the elderly generation. The Age threshold for the object to be promoted to the old Age can be set through the parameter - XX:MaxTenuringThreshold.
2. Why should we put large objects directly into the old age?
In order to avoid reducing the efficiency of copy operation when allocating memory for large objects.
3. Under what circumstances should the generation age be set manually?
If 80% of the objects in my system are useful objects, they will be flipped back and forth in Survivor after 15 GC. At this time, it is better to set the generation age to 5 or 8, so as to reduce the number of flipping back and forth in Survivor and put them directly into the old age, saving the space for younger generations.
4. How to judge whether a class is useless?
The method area mainly recycles useless classes, so how to judge whether a class is useless? Class needs to meet the following three conditions at the same time to be a "useless class".
- All instances of this class have been recycled, that is, there are no instances of this class in the Java heap.
- The ClassLoader that loaded this class has been recycled
- The java.lang.Class corresponding to this class is referenced anywhere, and the methods of this class cannot be accessed anywhere.
Here we focus on the second condition of "useless class". The classloader that loads this class has been recycled. Let's take a look at the result of classloader:
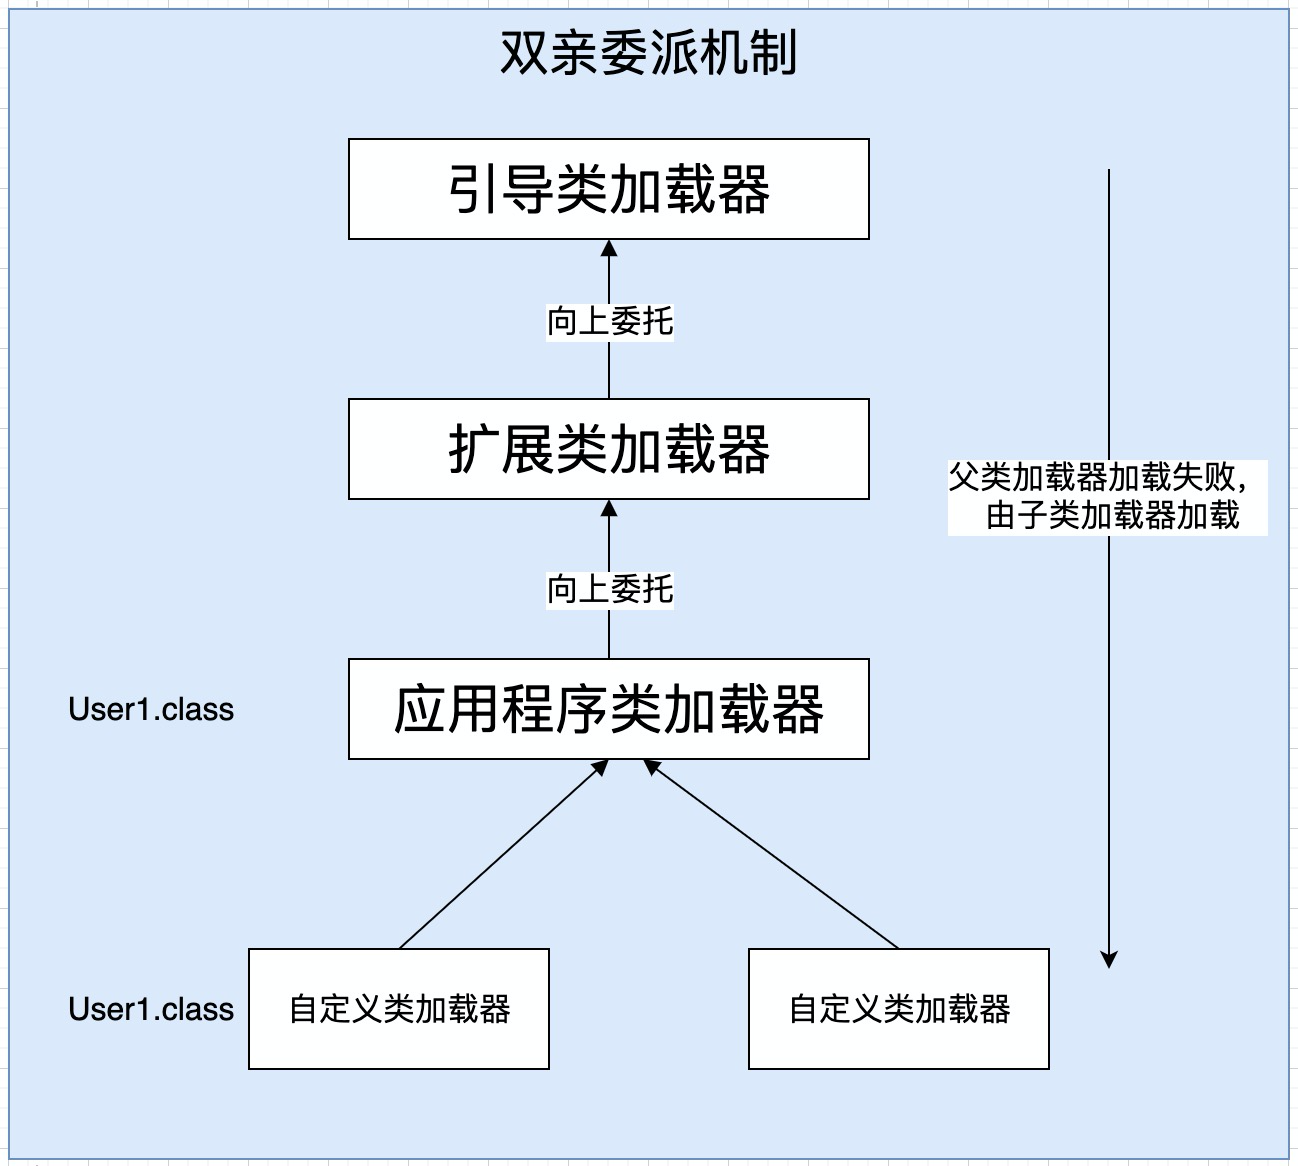
Among them, the first three class loaders (boot class loader, extension class loader and application class loader) are system class loaders. They load many classes. It is almost impossible for these class loaders to be recycled. However, for custom class loaders, they can be recycled. Taking the tomcat custom class loader as an example, a jsp will automatically generate a class loader. When the class loader processes the current jsp page, it will be recycled. That is, only custom class loaders are usually recycled.
