catalogue
2. Use Process Explorer to find out the cause of high CPU consumption
3. The problem is reproduced in the Intranet environment of the company using clussy tool
When checking the video image flicker problem of the project customer, I accidentally found a deeply hidden bug with high CPU consumption. This article will describe in detail the whole process of locating the high CPU consumption problem using the network environment simulation tool clumsy and Process Explorer.
Development tools: Visual Studio 2010
Development language: C++
1. Problem description
The project for a customer is coming to an end and is currently in the customer trial stage. If there are no major problems and everything goes smoothly, the customer is ready to purchase products. As a result, there was a serious video image flicker problem on one of the customer's laptops. The customer requested that the problem must be solved before product procurement.
This video flicker is a very difficult problem. The currently used video codec library will have a small probability of incompatibility with different manufacturers and different types of USB cameras. It happens to be encountered in the whole project, so a long problem investigation process began.
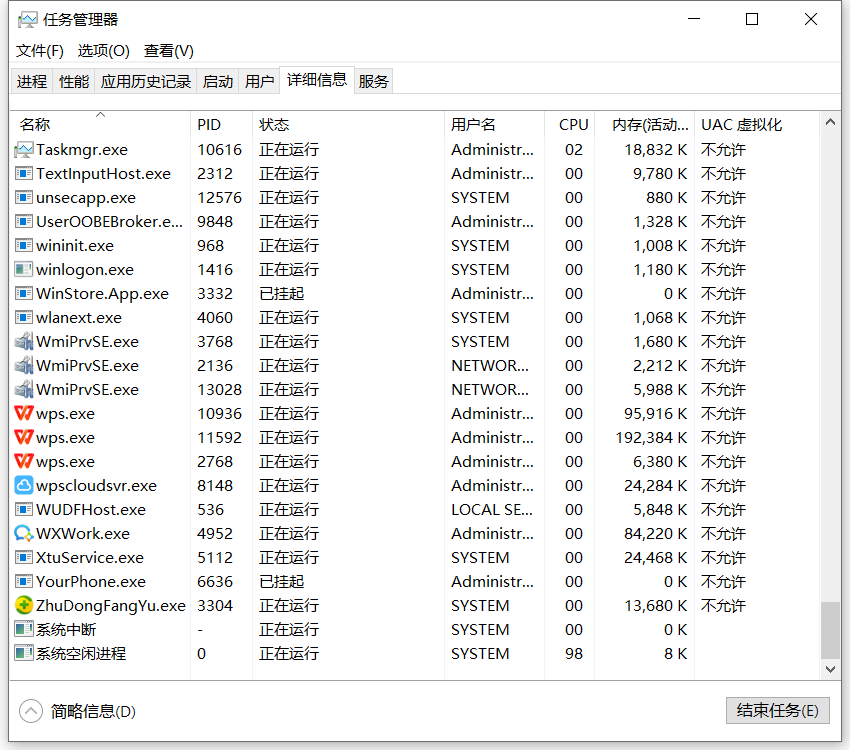
An angel used a sunflower to remote to the customer's notebook and found that the CPU occupation of the system was very high, resulting in an obvious jam in the system. Check the system's resource manager. Sunflower software accounts for about 15% of the CPU. The customer also started some other software, which also accounts for about 30%. Our software actually accounts for about 30%! No, we didn't do any business after our software login. It can account for 30%, which must be a problem!
2. Use Process Explorer to find out the cause of high CPU consumption
So I downloaded Process Explorer on the customer's machine. Use this tool to see the CPU usage of each thread of our software process, and see which module occupies about 30% of the CPU without doing anything.
Process Explorer is a frequently used tool for Troubleshooting Windows software problems. It mainly uses the following functions:
1) You can view the dll library information loaded by the target process, including the path and version of the library. You can also check whether the library dynamically started through LoadLibrary is started.
2) You can view the thread information of the target process, including the CPU utilization of each thread, the real-time function call stack of the thread, etc.
3) You can view the use of GPU hardware by the target process (GPU module is integrated on the CPU). Many software will use GPU, such as video encoding and decoding. GPU can be used to realize hard encoding and hard decoding (encoding and decoding using the computing power of CPU is called soft encoding and soft decoding), so as to effectively reduce the occupation of CPU.
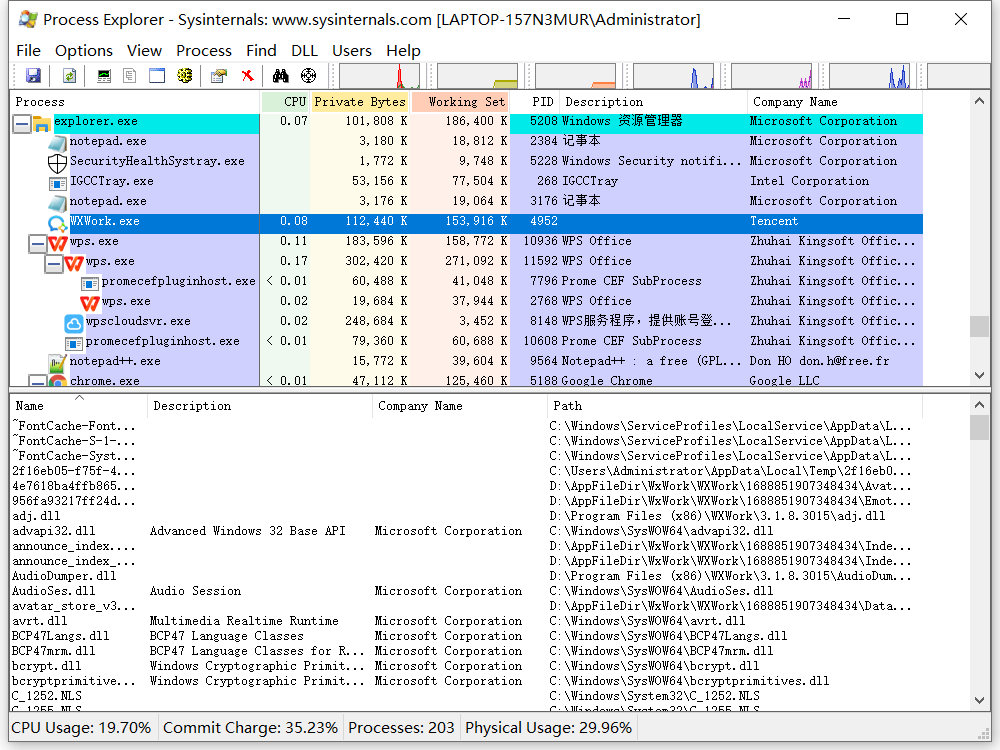
After starting Process Explorer, find our software process in the process list:
Double click our software process to pop up the process details window, and then switch to the Threads tab:
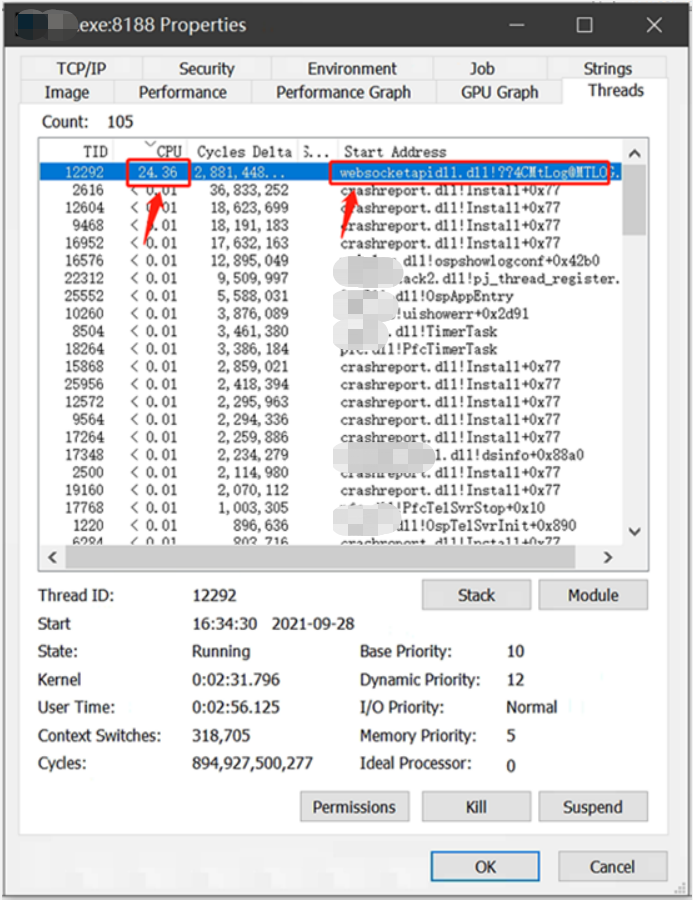
We can see from the figure that the thread with thread id 12292 has a problem, accounting for about 25% of the CPU!
Double click the thread to view the current function call stack of the thread as follows:
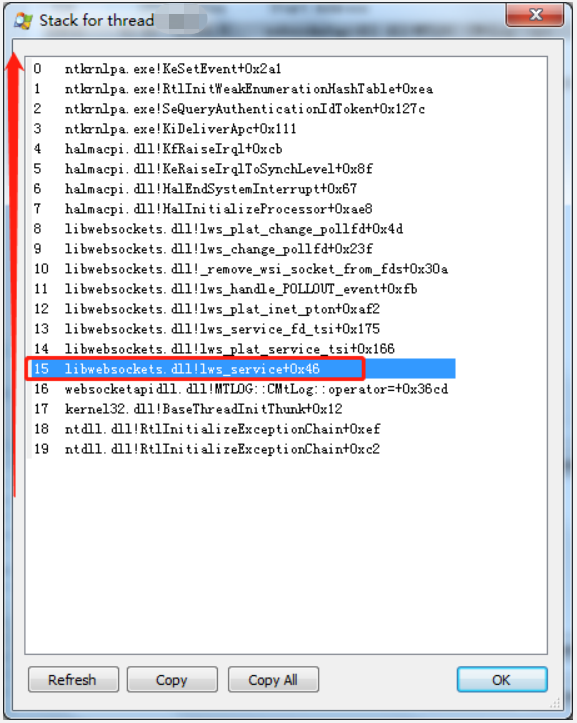
The function call stack is related to the interface calls of the libwebsockets open source library. We have simply encapsulated the libwebsockets open source library before. Is there a problem with our encapsulation?
The A business module of our software communicates with the A server of the platform through libwebsockts. The A server of the platform is responsible for the transaction processing of A business. However, at present, our software has not done anything and has not initiated the operation of A business. Why do the underlying modules frequently call libwebsockets?
When logging in, our software will establish A link with the A server of the platform to register with the A server, and this link is A long connection. If the software bottom layer is disconnected from server A, the bottom layer will initiate automatic reconnection. Is it because the bottom layer can't log in to server A at present, the bottom layer is constantly reconnecting regularly, and there is A problem with the code of regular reconnection, resulting in high CPU occupation?
Therefore, the address of server A was found to be 172.16.72.235 by checking and printing. ping the server address on the customer's notebook. As A result, the server address could not be pinged:
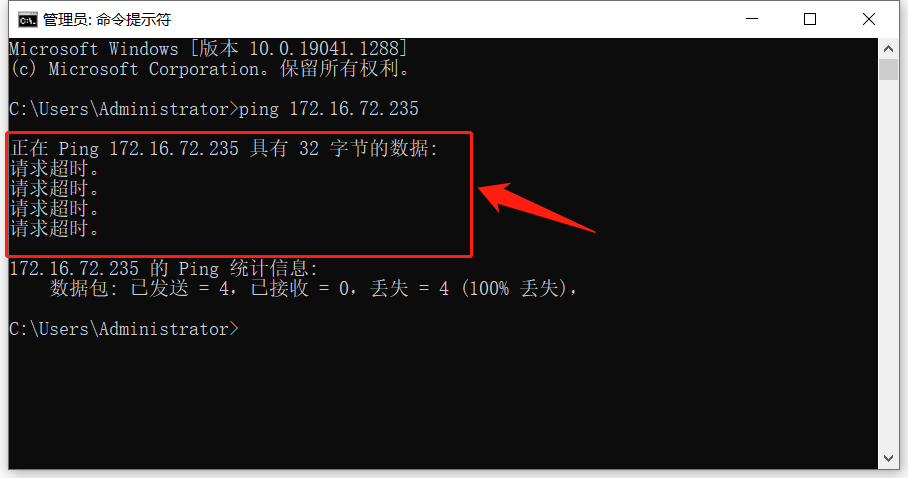
Therefore, we can basically estimate that the server cannot be connected, and the underlying layer is constantly reconnecting the server, resulting in high CPU consumption.
3. The problem is reproduced in the Intranet environment of the company using clussy tool
The above guess is that the underlying layer has been regularly reconnecting to server A when it can't connect to server A, resulting in high CPU consumption. However, according to the function call stack viewed in Process Explorer:
Compared with the source code, we didn't find the problem.
We can't always remote the customer's computer. The customer still has A lot of things to do, so we try to reproduce this problem in our company's environment (our company has built many sets of platform environments for testing, including Intranet environment and public network environment). How can it be replicated within the company? In fact, it is very simple. Use network tools to intercept the data interacting with server A, so that the client software can not connect to server A, and the underlying automatic reconnection can be triggered, which should be able to reproduce the problem.
So I thought of A very easy-to-use and lightweight network environment simulation tool clumsy, which can be used to intercept all the data packets sent by the client to the A server.
Clumsy is a weak network environment simulation tool, which can directly intercept network data, set the packet loss rate of the target address, and simulate a poor network environment. It is also a software tool used more in our daily work.
After opening clumsy, the default filter conditions are: outbound and IP. Dstaddr > = 127.0.0.1 and IP. Dstaddr < = 127.255.255.255, as follows:
We only need to set the target address as the address of server A in the platform 139.224.XXX.XXX (the platform is A large-scale test platform built within our company), that is, ip.DstAddr == 139.224.XXX.XXX:
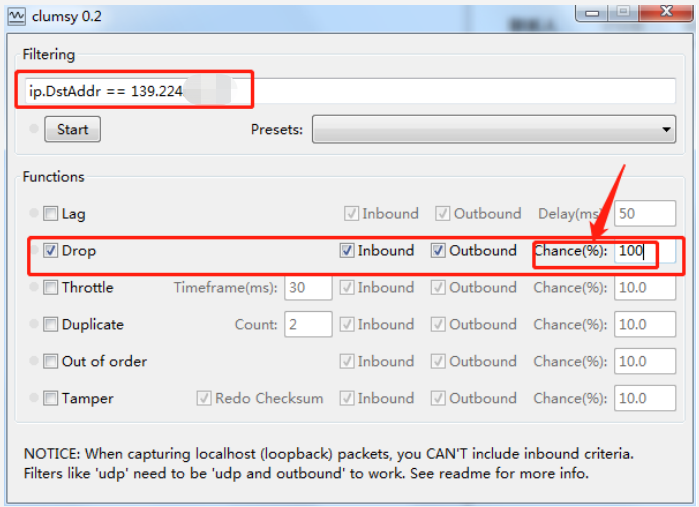
Then check the Drop option, check both Inbound and Outbound, and set the packet loss rate to 100%, so that the data packets sent by the software terminal to server A are discarded, so that server A cannot be connected. Note that you may need to run the tool with administrator privileges (especially on win10 systems).
If the A server cannot be connected, the bottom layer will continue to reconnect regularly, and then the problem will reappear. Our working machine also occupies A high CPU, so it is more certain that the high CPU occupation is caused by the reconnection code.
4. According to the function call stack in Process Explorer, the source code is analyzed and the problem is finally found
In fact, this bug with high CPU consumption is very hidden. There is no such problem when you can connect to server A. it will appear only when you trigger reconnection when you can't connect to server a.
So I asked my colleagues who are responsible for maintaining the underlying modules to see why their code leads to high CPU consumption. Because I am responsible for troubleshooting software exceptions, I often assist colleagues in the underlying module to troubleshoot various software exceptions, such as protocol module, network module, audio and video codec module, component module, etc.
By comparing the function call stack displayed in Process Explorer, we found the location of the source code, but after a detailed look at these codes, we found no obvious flaws! Why can we connect the code to execute without problem, but this code will have problems when it is not connected? The colleague in charge of the underlying module is very busy. He joked that since the problem is that the server is not connected, let the customer find out why the server is not connected. Let's put this problem away first. What a success! This is obviously a big hidden danger. No matter whether the customer's environment can be connected, it must be solved!
So I took their code and studied it carefully to see what was going on. The code for reconnecting server A is placed in A thread for processing. The relevant code is as follows: (the problem lies in the code calling lws_service!)
static void* WSSocketProc( void* pParam )
{
    s_ptContext = CreateContext();
    if ( NULL == s_ptContext )
    {
        MLOG::MLogErr( ML_WEBSOCKET, "[%s] Create Context Failed!!!", __func__ );
        return NULL;
    }

    if ( FALSE ==OspSemBCreate( &s_hWsiCloseSem ) )
    {
        MLOG::MLogErr( ML_WEBSOCKET, "[%s] s_hWsiCloseSem Inited Failed!!!", __func__ );
        return NULL;
    }

    SemGive( g_hWSInitSem );
    while ( TRUE )
    {
        CheckSvrConnect();

        SemTake( s_hWsiCloseSem );
        std::vector<u64>::iterator itWsi = s_vecToBeClosedWsi.begin();
        for ( ; s_vecToBeClosedWsi.end() != itWsi; ++itWsi )
        {
            SemTake( g_hSessionIDSem );
            std::map<u64, std::string>::iterator itSessionID = g_mapSessionID.find( *itWsi );
            if ( g_mapSessionID.end() != itSessionID )
            {
                bClientForceClose = TRUE;
                lws_close_free_wsi( (lws *)( *itWsi ) , LWS_CLOSE_STATUS_NOSTATUS );
            }

            SemGive( g_hSessionIDSem );
        }

        s_vecToBeClosedWsi.clear();
        SemGive( s_hWsiCloseSem );

        // The problem lies in this code. When there is no websockets connection, the interface does not play the role of sleep
        lws_service( s_ptContext, LWS_SERVICE_TIMEOUT );

        if ( s_bExitSocketProc )
        {
            MLOG::MLogHint( ML_WEBSOCKET, "[%s] SocketProc Thread Exit!!!", __func__ );
            OspSemDelete( s_hWsiCloseSem );
            s_vecToBeClosedWsi.clear();
            break;
        }
    }

    lws_context_destroy( s_ptContext );

    return NULL;
}
As a matter of fact, when using a thread to process transactions, you must add a Sleep. You can't let the thread run all the time. Otherwise, the thread is occupying the CPU time slice all the time, which will lead to high CPU occupation, which is similar to an endless loop. For programmers, this is common sense!
It does seem that there is also Sleep in the code by calling the interface LWS of libwebsockets_ A timeout parameter is passed in during service. It is estimated that the Sleep function is realized through this function.
Can I not call this lws_service, call the Sleep interface directly? The answer is no, go to LWS_ At the service interface implementation, view LWS_ Comments of service interface:
/**
 * lws_service() - Service any pending websocket activity
 * @context:    Websocket context
 * @timeout_ms:    Timeout for poll; 0 means return immediately if nothing needed
 *        service otherwise block and service immediately, returning
 *        after the timeout if nothing needed service.
 *
 *    This function deals with any pending websocket traffic, for three
 *    kinds of event.  It handles these events on both server and client
 *    types of connection the same.
 *
 *    1) Accept new connections to our context's server
 *
 *    2) Call the receive callback for incoming frame data received by
 *        server or client connections.
 *
 *    You need to call this service function periodically to all the above
 *    functions to happen; if your application is single-threaded you can
 *    just call it in your main event loop.
 *
 *    Alternatively you can fork a new process that asynchronously handles
 *    calling this service in a loop.  In that case you are happy if this
 *    call blocks your thread until it needs to take care of something and
 *    would call it with a large nonzero timeout.  Your loop then takes no
 *    CPU while there is nothing happening.
 *
 *    If you are calling it in a single-threaded app, you don't want it to
 *    wait around blocking other things in your loop from happening, so you
 *    would call it with a timeout_ms of 0, so it returns immediately if
 *    nothing is pending, or as soon as it services whatever was pending.
 */

LWS_VISIBLE int
lws_service(struct lws_context *context, int timeout_ms)
{
    return lws_plat_service(context, timeout_ms);
}
The above notes are translated as follows:
This function deals with any pending websocket traffic, for three kinds of event. It handles these events on both server and client types of connection the same.
1) Accept new connections to our context's server
2) Call the receive callback for incoming frame data received by server or client connections.
This function handles any (pending) websocket traffic that needs to be handled, and is applicable to three events. It handles these events on the server and client connection types in the same way.
1) Accept a new connection to our context server
2) Call the callback function to call back the data received by the server or client connection.
You need to call this service function periodically to all the above functions to happen; if your application is single-threaded you can just call it in your main event loop.
You need to call this service function periodically to make all the above functions happen; If your application is single threaded, you can call it in the main event loop.
As can be seen from the above comments, LWS must be called to ensure that the libwebsockets library can send and receive data normally_ Service interface.
Then why is there a problem when the above code is connected to the server, but there will be a problem when the server is not connected? It is estimated that when the server cannot be connected, there is no valid websockets connection in libwebsockets. When LWS is called_ Service interface, the interface immediately returns, that is, the interface does not play the role of Sleep! This should be the reason.
The final solution is to add a Sleep in the thread function: (add a Sleep below the call lws_service)
lws_service( s_ptContext, LWS_SERVICE_TIMEOUT );

Sleep( LWS_SERVICE_TIMEOUT ); // Sleep needs to be added artificially to ensure that the current thread has sleep time
In any case, Sleep must be executed for a certain period of time. After modifying the code, compile the library and overwrite it in the software directory. There will be no problem after re running the software.
5. Summary
As software developers, it is necessary to master the use of some common tools to assist in troubleshooting various problems encountered in the operation of our software products, which can effectively improve the efficiency of troubleshooting.
In this example, it is by looking at the function call stack of the Process Explorer tool that the problem code block is found, and the problem is reproduced in the company environment through the clussy tool. It is relying on these tools that we can gradually locate and solve the problem.