This time, Python is used to write the crawler and store the crawled data into the database. Finally, pyechards is used to draw the chart to visually display 58677 IP addresses, including IP address classification, IP address attribution distribution and IP address operator distribution.
1, Preparatory work
The overall operation is based on Python. My environment:
- Python3.8
- JetBrains PyCharm 2018.2.2 x64
- pyecharts 1.9.0
2, Train of thought
1. Overall idea
2. Reptile ideas

In fact, after data extraction, it can be directly stored in the database. Here, I first store the txt text file, then read the text file and write it into excel, and finally manually import the MySQL database, which is a bit superfluous.
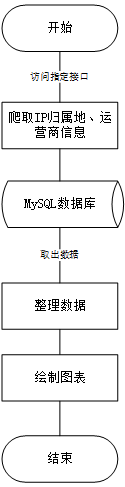
3, Effect display
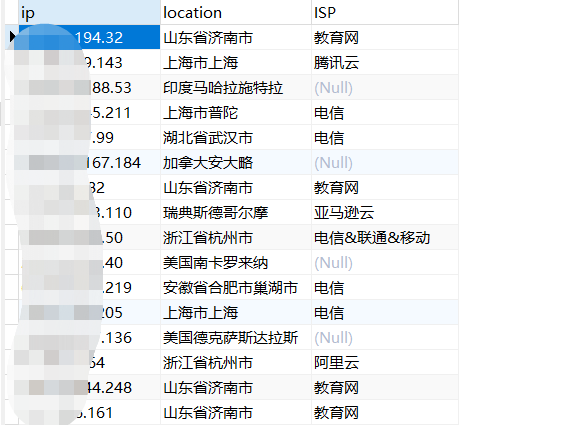
1. Database
1.1 data sheet
The data table stores IP, IP home and IP operator information.
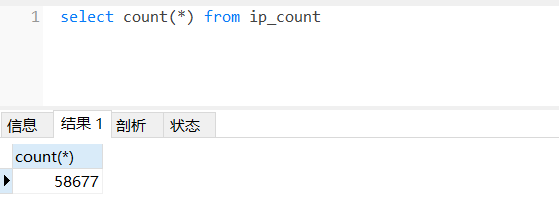
1.2 data volume
A total of 58677 IP address information are stored (after de duplication).
2.IP address classification analysis - pie chart
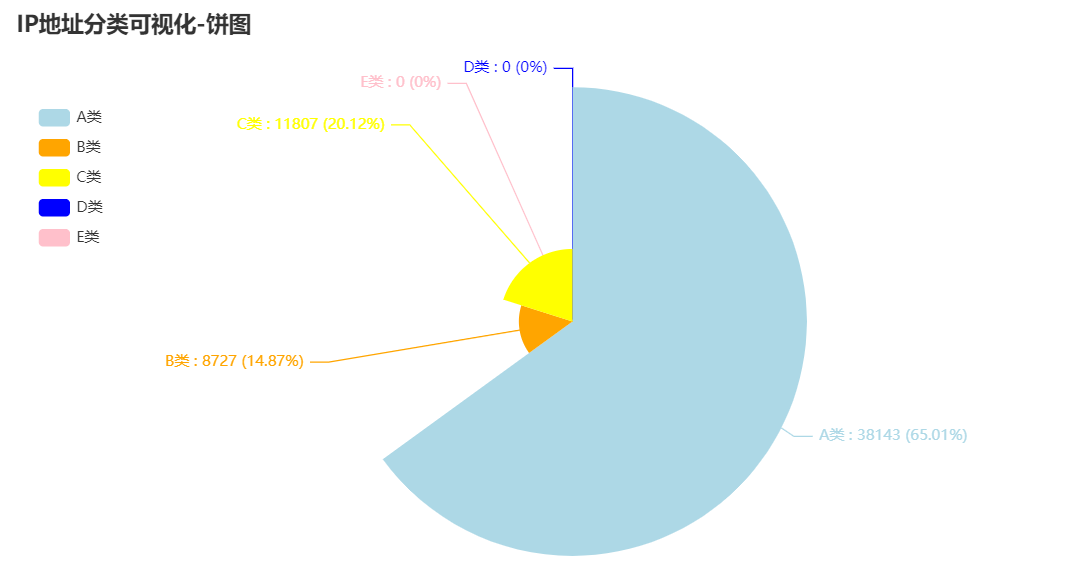
You can see that class A addresses account for A large proportion.
3.IP address distribution visualization - Map
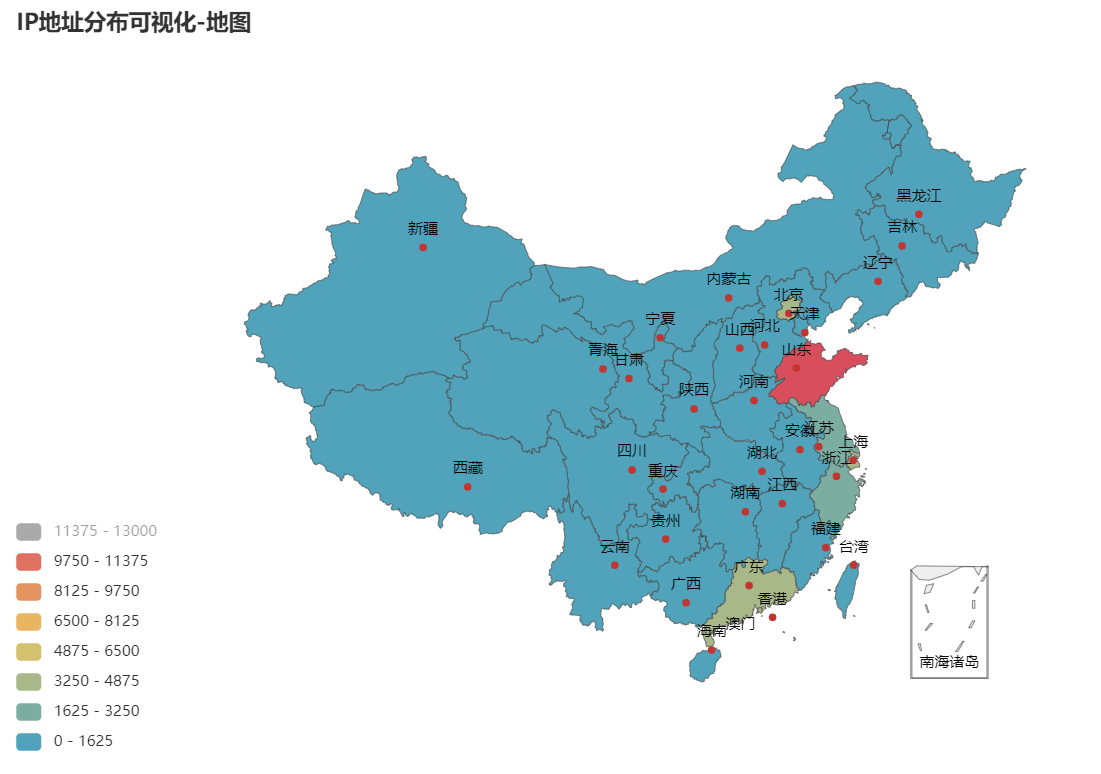
Visually mark the IP address attribution information on the map (do not analyze the IP addresses in foreign countries). There are more IP addresses in Shandong, with a total of 12805, followed by Guangdong and Hong Kong.
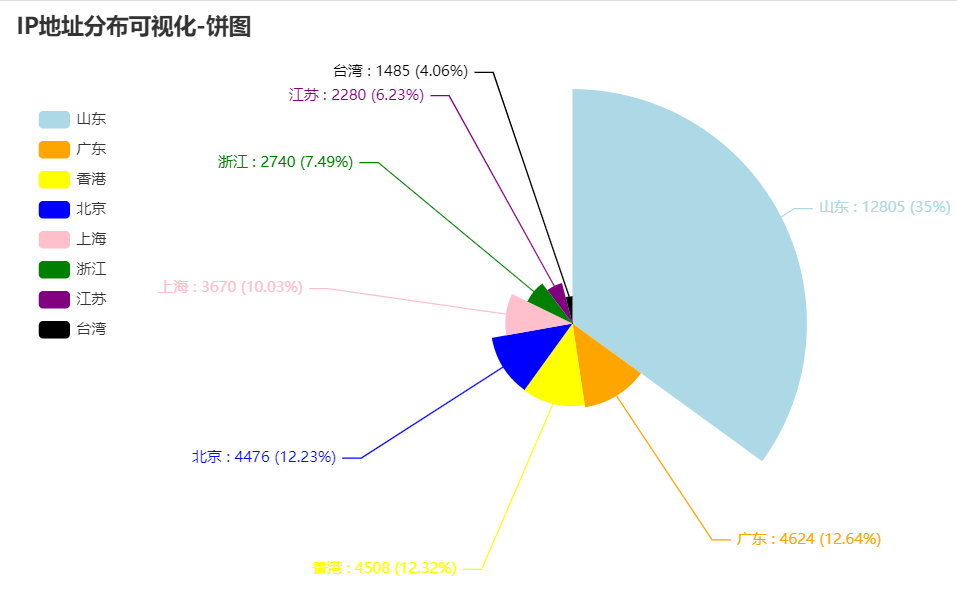
4.IP address distribution analysis - pie chart
What, you can't see from the map just now that Guangdong and Hong Kong account for a large proportion? Please look at this picture.
5.IP address distribution visualization - bar chart
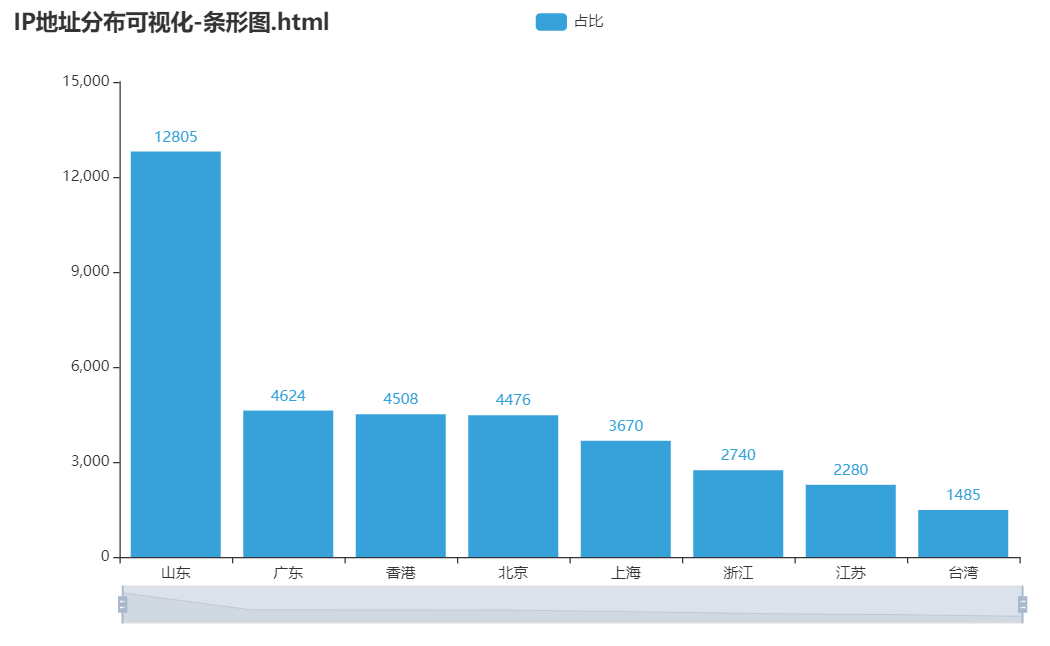
The bar chart can clearly show the number of various quantities.
6. Analysis on the proportion of IP address operators pie chart
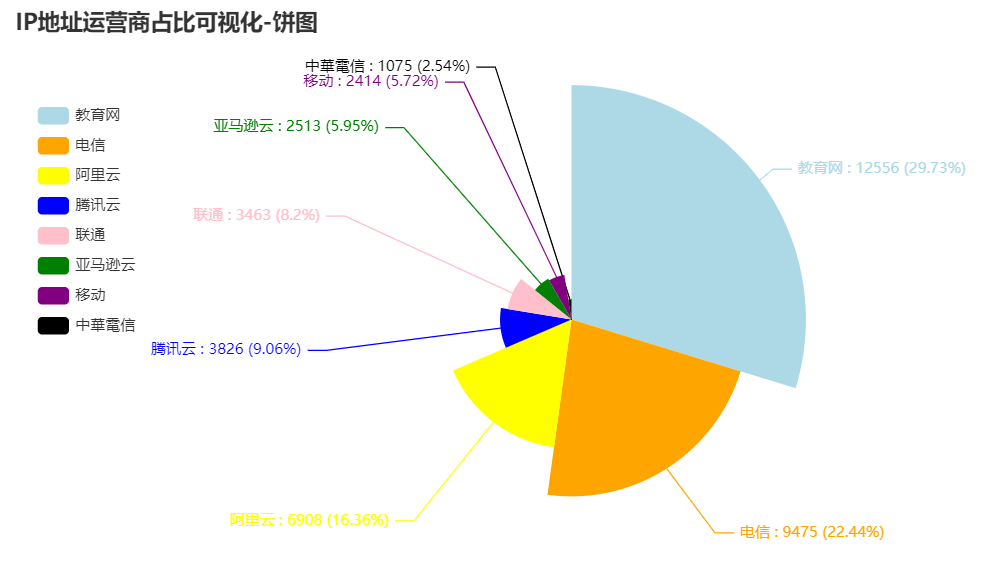
From the pie chart above, we can see that education network accounts for the largest proportion, followed by telecom and Alibaba cloud.
7. Visualization of IP address operator proportion - bar chart
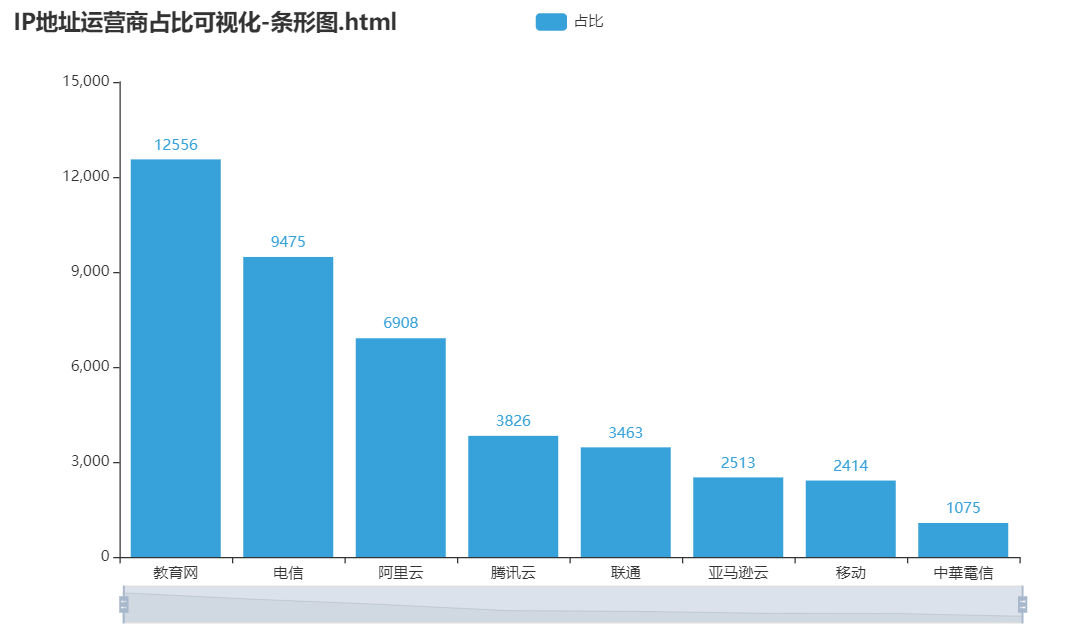
The bar chart represents the number by the length of the bar. This paper is used to analyze and display the number of IP operators.
4, Source code
1.get_ip_infos.py (IP address information crawler)
#coding:utf-8
import requests
import json
import time
import re

import xlwt

"""
resource_id Parameters are important
"""

class IP_ana:

    def read_txt(self,txt_file)->list:
        """
        Read from file IP Address, remove line breaks at the end
        :param txt_file:
        :return:
        """
        with open(txt_file,'r',encoding="utf-8")as f:
            data=[ip.strip() for ip in f.readlines()]
            return data

    def fmt_ip(self,ip)->str:
        """
        yes IP Format the address and remove the port number
        :param ip: Pending IP address
        :return: IPv4 Formatted IP address
        """
        regx="(([01]{0,1}\d{0,1}\d|2[0-4]\d|25[0-5])\.){3}([01]{0,1}\d{0,1}\d|2[0-4]\d|25[0-5])"
        if ":" in ip:
            aim_ip=ip.split(":")[0]
        else:
            aim_ip=ip
        if re.match(regx,aim_ip):
            return aim_ip
        else:
            return False

    def do_request(self,ip)->str:
        """
        Access to the interface
        :param ip: url Required parameters
        :return: Web page source code
        """
        try:
                full_url=f"https://sp1.baidu.com/8aQDcjqpAAV3otqbppnN2DJv/api.php?query={ip}&co=&resource_id=5809"
                headers={
                    "User-Agent": "Mozilla/5.0 (Windows NT 10.0; Win64; x64) AppleWebKit/537.36 (KHTML, like Gecko) Chrome/94.0.4606.81 Safari/537.36"
                }
                r=requests.get(full_url,headers=headers)
                if r.status_code==200:
                    html=r.text.encode('utf-8').decode('unicode_escape')
                    # print(html)
                    return html
        except:
            return False

    def get_ip_attribute(self,html)->dict:
        """
        obtain IP Place of ownership
        :param html:
        :return:
        """
        try:
            item={}
            _json=json.loads(html)
            data=_json.get("data")
            item['location'],item['ISP']=data[0].get("location").split(" ")
            return item
        except:
            return False

    def save_result(self,data)->None:
        """
        Store crawl results
        :param data:
        :return:
        """
        with open(aim_txt,'a',encoding='utf-8')as f:
            f.write(data+'\n')

    def write_to_excel(self,all_data)->None:
        """
        write in excel
        :param all_data:
        :return:
        """
        workbook = xlwt.Workbook()
        worksheet = workbook.add_sheet('sheet', cell_overwrite_ok=True)
        headers = ['IP', 'Place of ownership', 'ISP', ]
        worksheet.write(0, 0, headers[0])
        worksheet.write(0, 1, headers[1])
        worksheet.write(0, 2, headers[2])
        for index, data in enumerate(all_data):
            worksheet.write(index + 1, 0, data[0])
            worksheet.write(index + 1, 1, data[1])
            worksheet.write(index + 1, 2, data[2])
        workbook.save(excel_path)


if __name__ == '__main__':
    a=IP_ana()
    all_ips=a.read_txt("test_ip.txt")
    aim_txt="./2021-11-2_test_result.txt"
    excel_path = "./combine_result.xls"
    for ip in all_ips:
        ip_fmt=a.fmt_ip(ip)
        if ip_fmt:
            ip_infos=a.do_request(ip_fmt)
            if ip_infos:
                item=a.get_ip_attribute(ip_infos)
                if item:
                    data=ip_fmt+":\t"+item['location']+"\t"+item["ISP"]
                    print(data)
                    a.save_result(data)
                else:
                    print(ip_fmt + ":\t" + "Parsing failed!")
            else:
                print((ip_fmt + ":\t" + "Failed to get information!"))
        else:
            print((ip + ":\t" + "Not standard IPv4 Format!"))
    #Read txt and write to excel
    ip_data=a.read_txt(aim_txt)
    excel_data_list=[]
    for ip_data_ in ip_data:
        ip_data_list=[ip_data_.strip().split("\t")]
        excel_data_list.append(ip_data_list)
    a.write_to_excel(excel_data_list)
2.analysis_ip_infos.py (visual analysis of IP address data)
import pymysql
from pyecharts.charts import Map, Bar
from pyecharts.charts import Pie
from pyecharts import options as opts
from pyecharts.globals import ThemeType

"""
Map:
Pie chart:
Map:
"""

def get_data_from_mysql():
    """
    Get data from database
    :return:
    """
    try:
        conn=pymysql.connect(
            host='127.0.0.1',
            port=3306,
            user='root',
            password='root',
            db='ip_count',
            charset='utf8'
        )
        cursor=conn.cursor()
        sql="select * from ip_count"
        cursor.execute(sql)
        data=cursor.fetchall()
        return data
    except pymysql.Error:
        print("Database operation error!")
    finally:
        cursor.close()
        conn.close()


def sort_ip(data):
    sort_result={}
    sort_result["A class"]=0
    sort_result["B class"]=0
    sort_result["C class"]=0
    sort_result["D class"]=0
    sort_result["E class"]=0
    for ip in data:
        fisrt_num=ip.split('.')[0]
        if 0<=int(fisrt_num)<=127:
            sort_result["A class"]+=1
        elif  128<=int(fisrt_num)<=191:
            sort_result["B class"]+=1
        elif  192<=int(fisrt_num)<=223:
            sort_result["C class"]+=1
        elif  224<=int(fisrt_num)<=239:
            sort_result["D class"]+=1
        elif  240<=int(fisrt_num)<=247:
            sort_result["E class"]+=1
        else:
            print(ip)
    return sort_result

def sort_provinces(data):
    """
    Classify and sort the provincial information
    :param data:
    :return:
    """
    sort_result_item={}
    Province_34 = ['Beijing', 'Shanghai', 'Hainan', 'Guizhou', 'Hubei', 'Chongqing', 'Jiangsu', 'Anhui', 'Macao Special Administrative Region', 'Sichuan', 'Jiangxi', 'Zhejiang', 'Qinghai', 'Henan',
                   'Tianjin', 'Taiwan', 'Hunan', 'Shaanxi', 'Heilongjiang', 'Guangdong', 'Hong Kong', 'Hebei', 'Liaoning', 'Fujian', 'Guangxi', 'Tibet', 'Inner Mongolia', 'Xinjiang', 'Yunnan',
                   'Gansu', 'Ningxia', 'Shanxi', 'Shandong', 'Jilin']
    provinces=[line[1] for line in data]
    for line in provinces:
        if line !=None:
            for p in Province_34:
                if p in line:
                    if p in sort_result_item.keys():
                        sort_result_item[p]+=1
                    else:
                        sort_result_item[p]=0
    sort_result=sorted(sort_result_item.items(),key=lambda x:x[1],reverse=True)
    return sort_result

def sort_ISP_data(data):
    """
    yes ISP Sort information by category
    :param data:
    :return:
    """
    data=[line[2] for line in data if line[2]!=None]
    item={}
    for isp in data:
        if isp in item.keys():
            item[isp]+=1
        else:
            item[isp] = 0
    item_sorted=sorted(item.items(),key=lambda x:x[1],reverse=True)
    return item_sorted

def draw_map(data):
    """
    Map the classified province information
    :param data:
    :return:
    """
    area1=[d[0] for d in data]
    area2=[d[1] for d in data]
    aim_num=max(area2)
    num_max_pos = len(str(aim_num)) - 2
    mid_num = divmod(aim_num, int("1" + "0" * num_max_pos))
    res_num = str(mid_num[0] + 1) + "0" * (num_max_pos)
    map =\
        Map(init_opts=opts.InitOpts(width="1000px", height="600px"))\
            .add("",[list(z) for z in zip(area1, area2)], 'china')\
            .set_global_opts(title_opts=opts.TitleOpts(title="IP Address distribution visualization-Map")
    ,visualmap_opts = opts.VisualMapOpts(max_=res_num, split_number=8, is_piecewise=True,precision=0))
    map.render("./IP Address distribution visualization-Map.html")

def draw_line(data,type_):
    """
    take ISP And province information are drawn into a bar chart
    :param data:
    :param type_:
    :return:
    """
    bar = (
        Bar(init_opts=opts.InitOpts(theme=ThemeType.LIGHT)) #Use theme
            .add_xaxis([data[0] for data in data])
            .add_yaxis("Proportion",[data[1] for data in data])
            .set_global_opts(
            title_opts=opts.TitleOpts(title=f"IP address{type_}visualization-Bar chart.html"),
            datazoom_opts=opts.DataZoomOpts(),
        )
    )
    bar.render(f"IP address{type_}visualization-Bar chart.html")

def draw_pie(data,type_):
    """
    take ISP And province information are drawn into a pie chart
    :param data:
    :return:
    """
    c = (
        Pie()
            .add(f"IP address{type_}visualization", data,color = "green",rosetype = "radius")
            .set_colors(["lightblue", "orange", "yellow", "blue", "pink", "green", "purple", "black"])
            .set_global_opts(title_opts=opts.TitleOpts(title=f"IP address{type_}visualization-Pie chart"),legend_opts=opts.LegendOpts(
            orient="vertical", #Legend placed vertically
            pos_top="15%",# Legend position adjustment
            pos_left="2%"),
    )
            .set_series_opts(label_opts=opts.LabelOpts(formatter="{b} : {c} ({d}%)"))
            .render(f"IP address{type_}analysis-Pie chart.html")
    )

if __name__ == '__main__':
    data=get_data_from_mysql()
    ip_data=[line[0] for line in  data]
    sort_ip_type_data=[(k,v) for k,v in sort_ip(ip_data).items()]
    draw_pie(sort_ip_type_data,"classification")

    ip_sort_res=sort_provinces(data)
    draw_map(ip_sort_res)
    draw_pie(ip_sort_res[:8],"distribution")
    draw_line(ip_sort_res[:8],"distribution")

    isp_sort_res=sort_ISP_data(data)
    draw_pie(isp_sort_res[:8],"Proportion of operators")
    draw_line(isp_sort_res[:8],"Proportion of operators")
5, Summary
This time, Python's pyecarts is used to draw pie charts, bar charts and maps to visually display the distribution of IP addresses and operators. The amount of code is small, and pyecarts is encapsulated. Calling the interface function can be easily implemented. I hope you can do it yourself. What are the deficiencies in ideas and codes? You are welcome to correct and criticize! I think it's OK. I can praise it.