1: Introduction to Dashboard
Dashboard is a web-based Kubernetes user interface. You can use dashboard to deploy container applications to Kubernetes cluster, troubleshoot container applications, and manage cluster resources. You can use the dashboard to get the overview information of the applications running in the cluster, or you can create or modify Kubernetes resources (such as Deployment, Job, daemon, etc.). For example, you can elastically scale the Deployment, initiate a rolling upgrade, restart the Pod, or use the wizard to create a new application.
The Dashboard also displays the resource status information and all error messages in the Kubernetes cluster.
Download and related instructions can be viewed
Official address: https://github.com/kubernetes/dashboard
Native environment
master IP: 192.168.152.100
2: Dashboard download and installation
Command on the master node:
kubectl apply -f https://raw.githubusercontent.com/kubernetes/dashboard/v2.4.0/aio/deploy/recommended.yaml
At this time, the namespace of kubernetes dashboard has been automatically created, and the previous version was in the default Kube system namespace.
You can view the service of kubernetes dashboard space by yourself. Kubernetes dashboard already exists.
ubuntu@k8s-master:~$ kubectl get svc --namespace=kubernetes-dashboard
NAME                        TYPE        CLUSTER-IP      EXTERNAL-IP   PORT(S)    AGE
dashboard-metrics-scraper   ClusterIP   10.101.45.252   <none>        8000/TCP   10m
kubernetes-dashboard        ClusterIP   10.106.68.110   <none>        443/TCP    10m
3: Access Dashboard
Access authority official reference address: https://github.com/kubernetes/dashboard/blob/master/docs/user/accessing-dashboard/README.md#login-not-available
There are three kinds of Dashboard login connections: local http access and external https access.
- http://localhost/...
- http://127.0.0.1/...
- https://<domain_name>/...
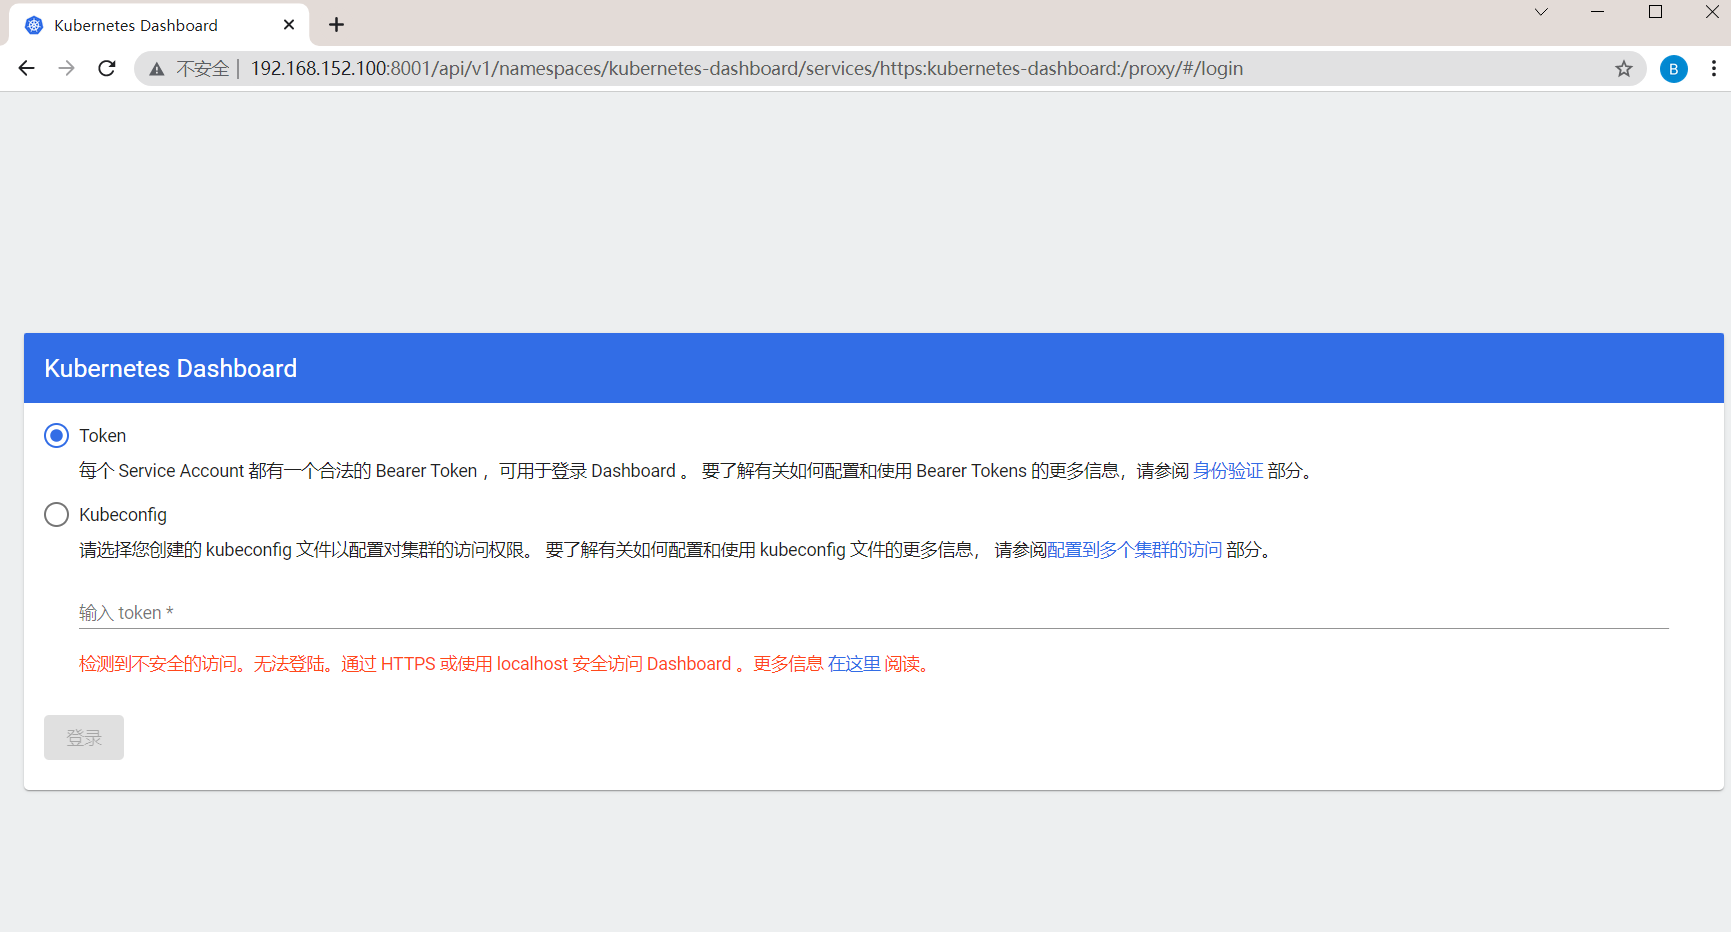
If you do not log in with the above connection, the following prompt will appear on the page and you cannot log in.
Insecure access detected. Unable to log in. Secure access to Dashboard via HTTPS or using localhost
1. Access to this machine
The master machine enters a command, and the command is suspended
kubectl proxy
Enter in the local browser (note that it must be http). Yes, yes, it is such a long connection:
http://localhost:8001/api/v1/namespaces/kubernetes-dashboard/services/https:kubernetes-dashboard:/proxy/
2. External machine access
Method 1: port forwarding mode:
Listen to all IP addresses and forward 8080 to 443 HTTPS port for access.
kubectl port-forward -n kubernetes-dashboard --address 0.0.0.0 service/kubernetes-dashboard 8080:443
At this time, enter it in the external machine browser (note that it must be https). Yes, yes, it can be accessed through such a short connection:
https://192.168.152.100:8080/
Method 2: NodePort:
Edit the kubernetes dashboard service in the command space kubernetes dashboard
kubectl -n kubernetes-dashboard edit service kubernetes-dashboard
After opening, change type: ClusterIP to type: NodePort
apiVersion: v1
kind: Service
...
...
  ports:
  - nodePort: 30169
    port: 443
    protocol: TCP
    targetPort: 8443
  selector:
    k8s-app: kubernetes-dashboard
  sessionAffinity: None
  type: NodePort	#Modify this line, which was originally type: ClusterIP
status:
  loadBalancer: {}
Review the port address of the kubernetes dashboard service in the command space kubernetes dashboard.
kubectl -n kubernetes-dashboard get service kubernetes-dashboard
As shown below, the external exposure port is automatically 30169
ubuntu@k8s-master:~$ kubectl -n kubernetes-dashboard get service kubernetes-dashboard
NAME                   TYPE       CLUSTER-IP      EXTERNAL-IP   PORT(S)         AGE
kubernetes-dashboard   NodePort   10.106.68.110   <none>        443:30169/TCP   112m
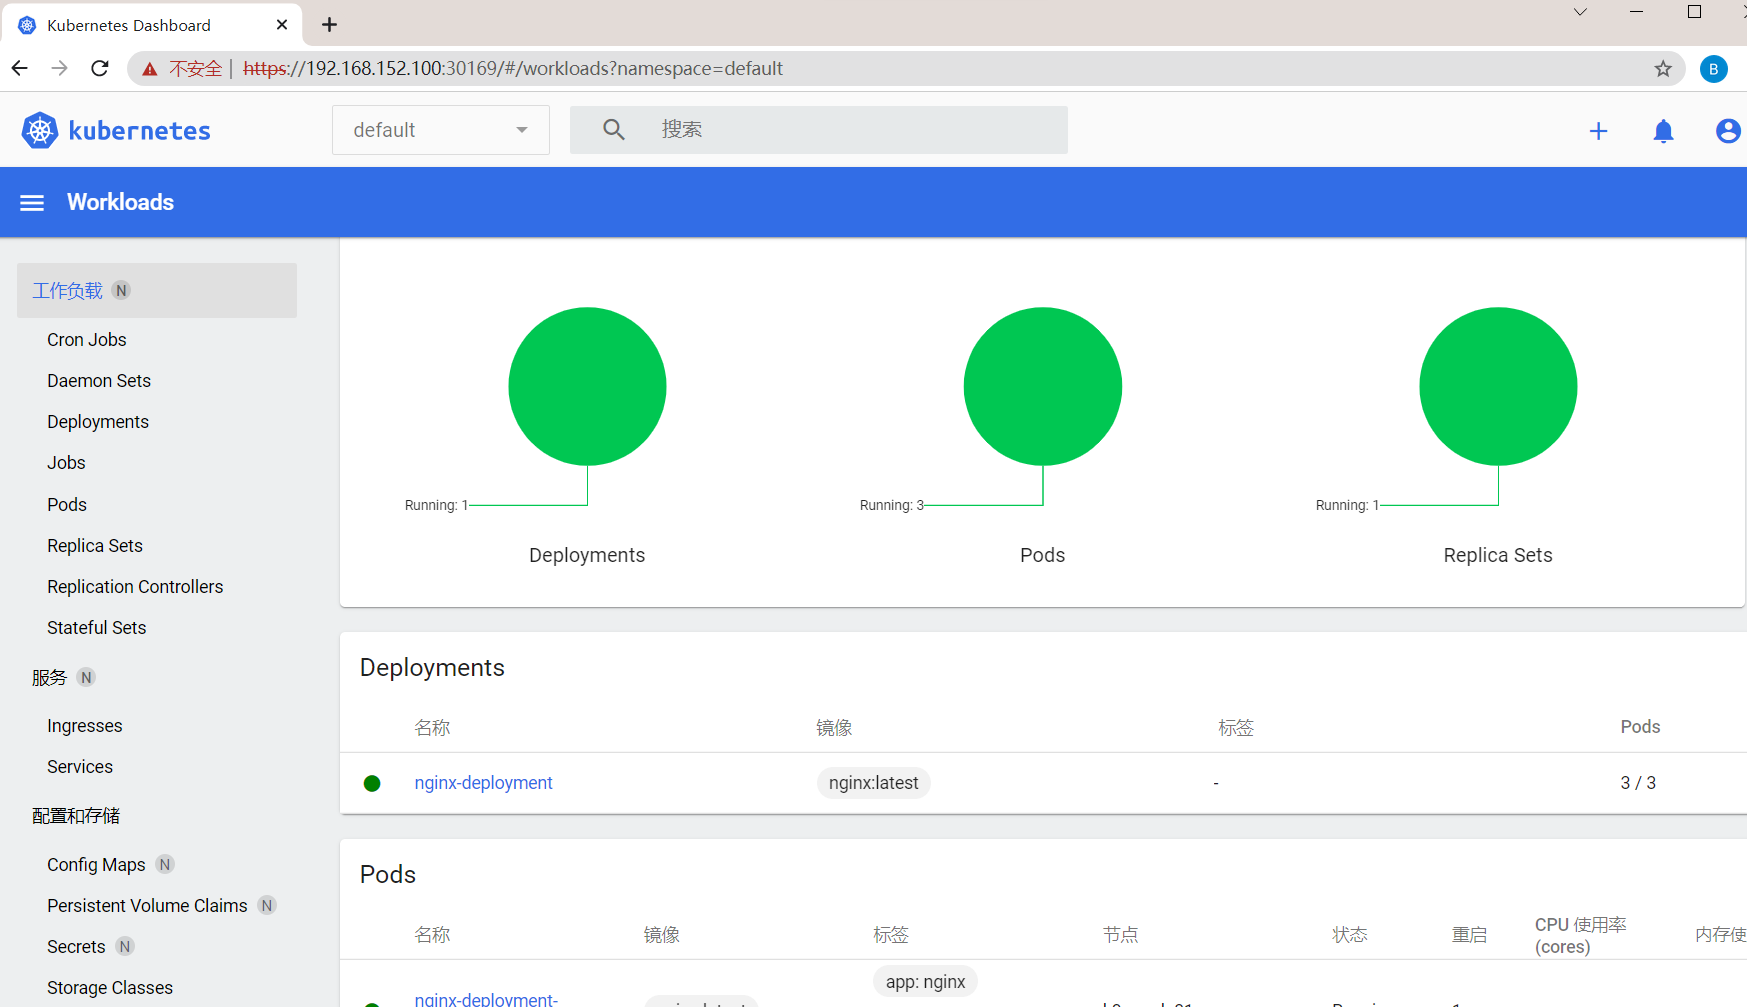
At this time, enter IP plus 30169 in the external machine browser (note that it must be https) to access:
https://192.168.152.100:30169/
Method 3: API Server:
Note: this method can only be used when installing user certificates in the browser. You can study it by yourself. We won't go into it here.
If the certificate is not installed, the message "insecure access detected. Unable to log in. Secure access to Dashboard via HTTPS or using localhost" is displayed
Set API server to receive requests from all hosts:
kubectl proxy --address='0.0.0.0' --accept-hosts='^*$'
The browser access commands are:
https://<master-ip>:<apiserver-port>/api/v1/namespaces/kubernetes-dashboard/services/https:kubernetes-dashboard:/proxy/
4: Configure login permissions
The Dashboard supports two authentication methods: Kubeconfig and token. Here, you can log in by token.
Official user configuration address: https://github.com/kubernetes/dashboard/blob/master/docs/user/access-control/creating-sample-user.md
Create service user Service Account and cluster role permission ClusterRoleBinding through yaml file
sudo vim account.yaml
content
# Creating a Service Account
apiVersion: v1
kind: ServiceAccount
metadata:
  name: admin-user
  namespace: kubernetes-dashboard

---
# Creating a ClusterRoleBinding
apiVersion: rbac.authorization.k8s.io/v1
kind: ClusterRoleBinding
metadata:
  name: admin-user
roleRef:
  apiGroup: rbac.authorization.k8s.io
  kind: ClusterRole
  name: cluster-admin
subjects:
- kind: ServiceAccount
  name: admin-user
  namespace: kubernetes-dashboard
kubectl apply makes it effective and generates roles
kubectl apply -f account.yaml
Get token
kubectl -n kubernetes-dashboard get secret $(kubectl -n kubernetes-dashboard get sa/admin-user -o jsonpath="{.secrets[0].name}") -o go-template="{{.data.token | base64decode}}"
The token obtained by this machine is similar to the following:
eyJhbGciOiJSUzI1NiIsImtpZCI6IlVMZ0sxSjFwRGVodFdkSnAyWkc0WHJVRUZEX0h6dlF0Mm12Z29UbnZlakUifQ.eyJpc3MiOiJrdWJlcm5ldGVzL3NlcnZpY2VhY2NvdW50Iiwia3ViZXJuZXRlcy5pby9zZXJ2aWNlYWNjb3VudC9uYW1lc3BhY2UiOiJrdWJlcm5ldGVzLWRhc2hib2FyZCIsImt1YmVybmV0ZXMuaW8vc2VydmljZWFjY291bnQvc2VjcmV0Lm5hbWUiOiJhZG1pbi11c2VyLXRva2VuLXh6emd0Iiwia3ViZXJuZXRlcy5pby9zZXJ2aWNlYWNjb3VudC9zZXJ2aWNlLWFjY291bnQubmFtZSI6ImFkbWluLXVzZXIiLCJrdWJlcm5ldGVzLmlvL3NlcnZpY2VhY2NvdW50L3NlcnZpY2UtYWNjb3VudC51aWQiOiJhMDczMzE2Ny05ZGViLTQ4N2EtYjFmMi1hMDljYTVlYmNhMDUiLCJzdWIiOiJzeXN0ZW06c2VydmljZWFjY291bnQ6a3ViZXJuZXRlcy1kYXNoYm9hcmQ6YWRtaW4tdXNlciJ9.kSl89EDfsJssCVh3PEiK4E0mH5zRkzy2CbVhsmGYv9XRDUsyaUhO2R4lYJ2K4PKfisnHRuHKPoLaPabDH5qvCX0Jw5f75YDwXua8edH7hqd3NfmAxjX3ipqTBR7z7vV8kI6qrfqstA2KV1SQ4R_n-iH6JAsQQYq8YjoLP6sNLmzwKBpbjUhuvFZw3pFSaf02MiHR_8pD0_MHYpjvIFUBSdVf5-YPn7qM6CWSqUp5vo6cYWUT63dokiWLw7hwwj4QXQbRc1qPmli9uFV3yUE9s_JJv5WelEdAwRlv5Aic5QzGd_N3-u67fBL_cvivbODKxK14TXLLznOqy_kasOrmHg
Fill the obtained token into the login address of the page
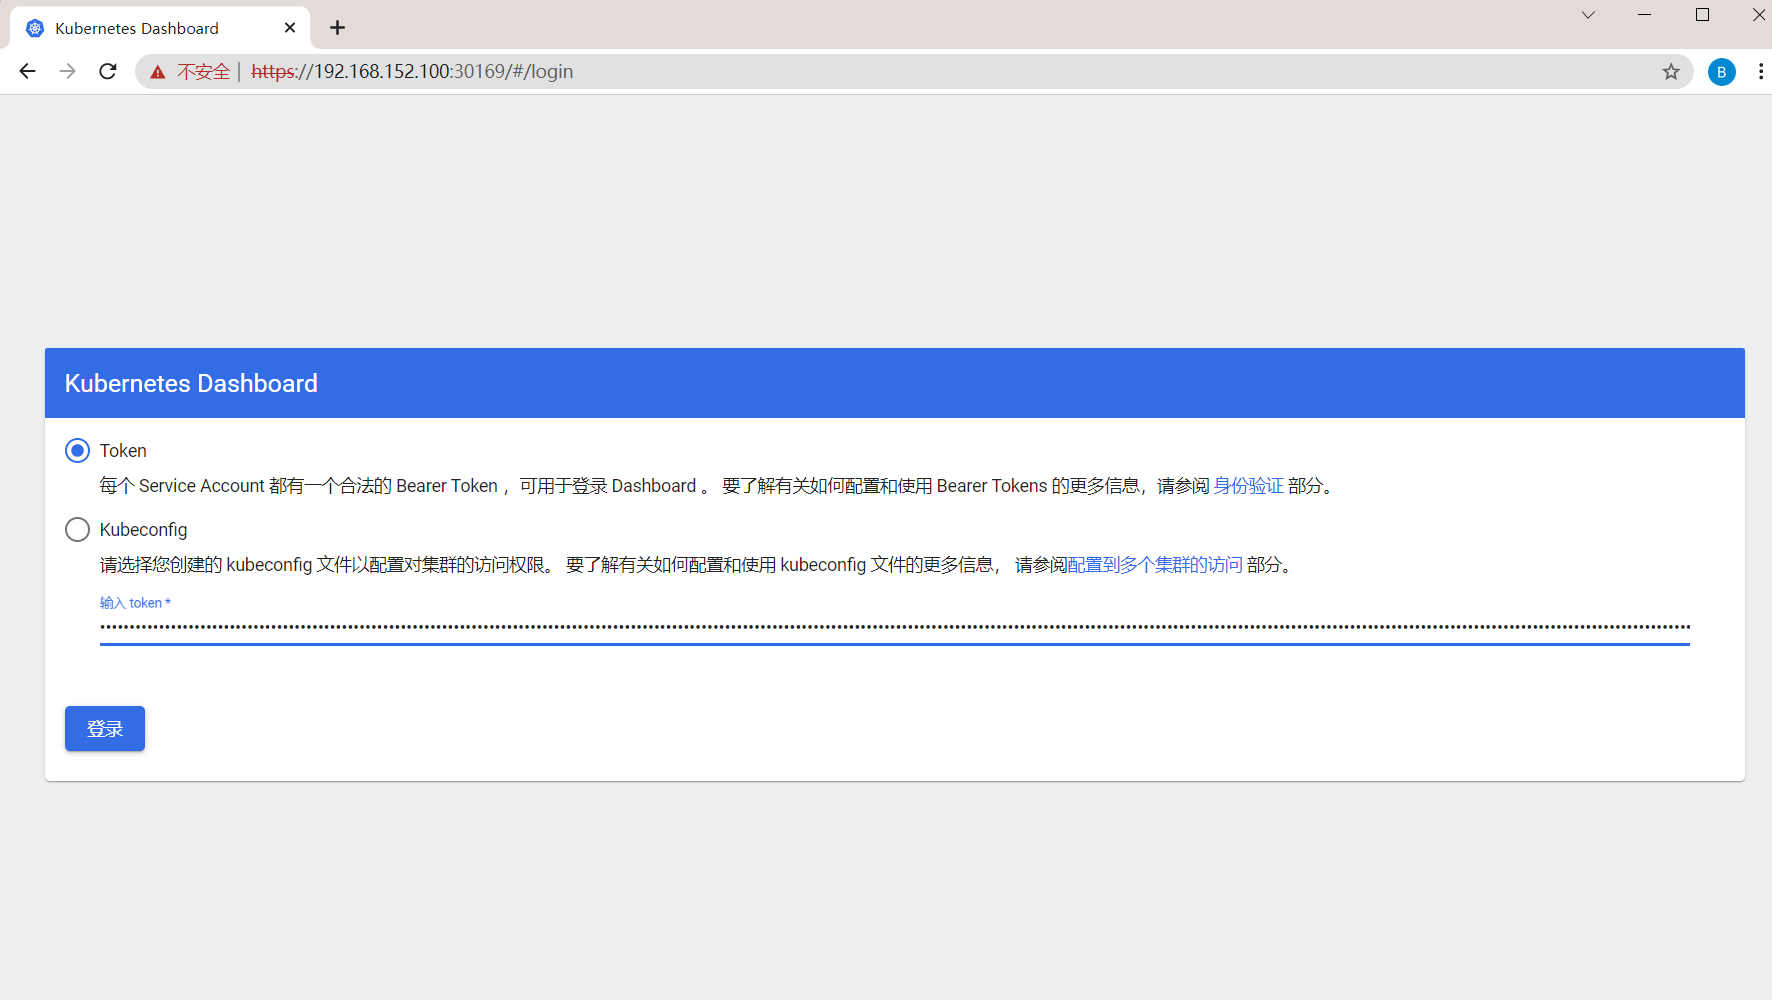
Login succeeded and Dashboard configuration is completed