1, Purpose and content of this paper
The main content of this paper is to build and use ab for interface pressure test and data analysis under windows environment for the first time
2, What is ab?
Apache bench is a web stress testing tool provided with Apache server, abbreviated as ab. AB itself is a command-line tool with low local requirements for initiating load. According to ab command, many concurrent access threads can be created to simulate multiple visitors accessing a URL address at the same time. Therefore, it can be used to test the load pressure of the target server or verify the operation of the interface in different concurrent scenarios during development. Generally speaking, AB has a small volume, Easy to use. It can provide basic data to analyze the performance of the interface under different pressures.
2, First use
1. Download and install Apache bench
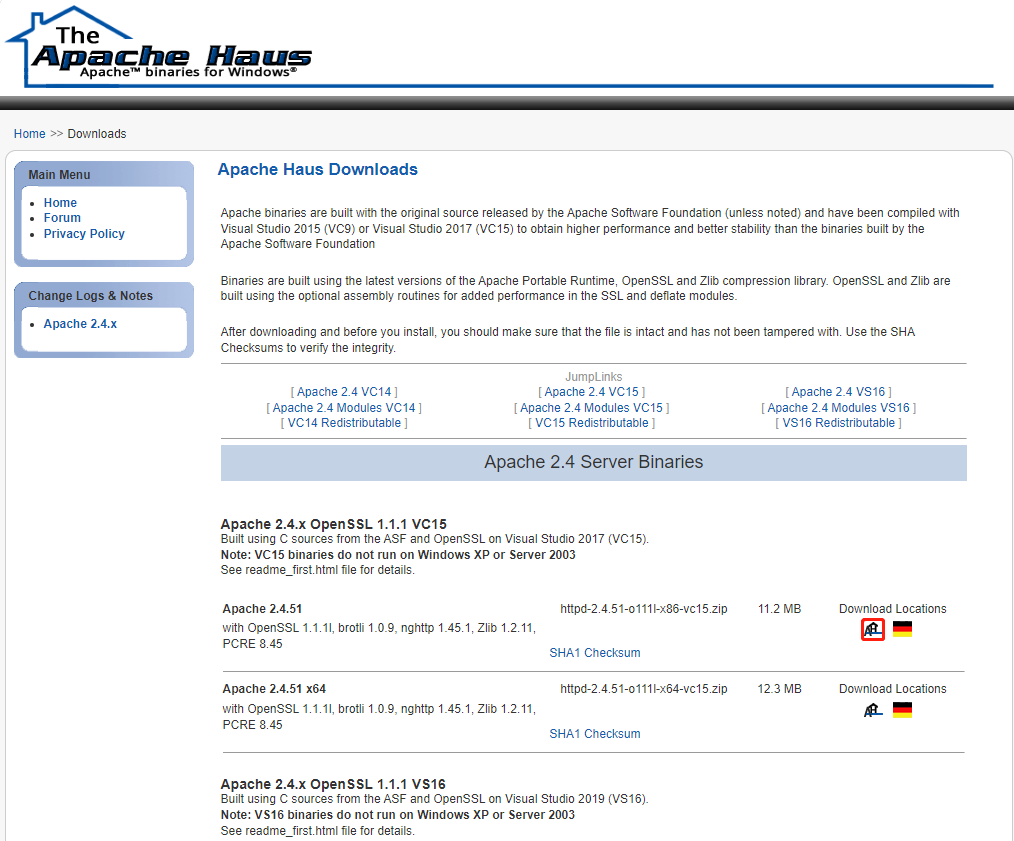
1. First, you need to download the Apache server from the official website at: Official website download address Here, I choose 2.4.51, as shown in the figure below. After downloading, unzip it, and we can get a folder named Apache24. The next step is to modify a configuration file.
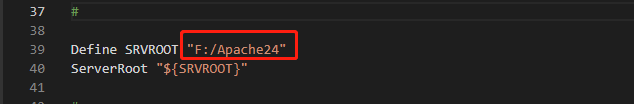
2. Modify the configuration file (Apache24\conf\httpd.conf), open this httpd.conf, modify the Define SRVROOT address to the actual local path, as shown in the figure, and change it to the actual storage location of the Apache24 folder. It should be noted that it is recommended that the path should not contain Chinese. When I try, because there is Chinese in the path, the follow-up service cannot be installed, so I can remove it.
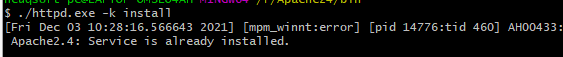
3. As an administrator, open a command window, switch the directory (Apache24\bin), and execute the command. The illustration is my machine, because it has been installed
./httpd.exe -k install
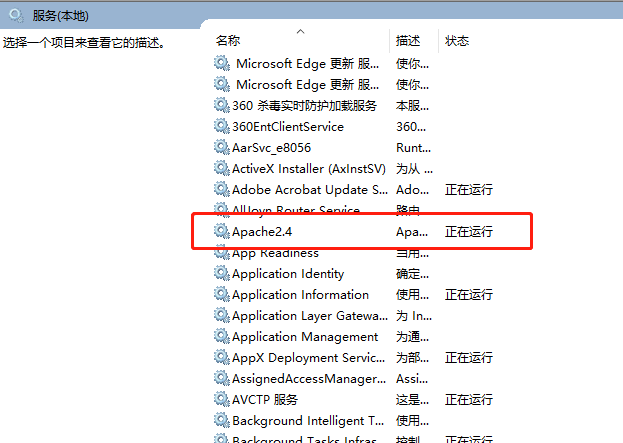
4. After the service is installed, you need to start the service, win+R, enter services.msc, enter, find the Apache 2.4 service, and start it.
The environment is now ready.
2. Detailed explanation of parameters
Open a CMD, switch to the directory (Apache24\bin), and execute the command. / ab.exe -h. you will get the following help:
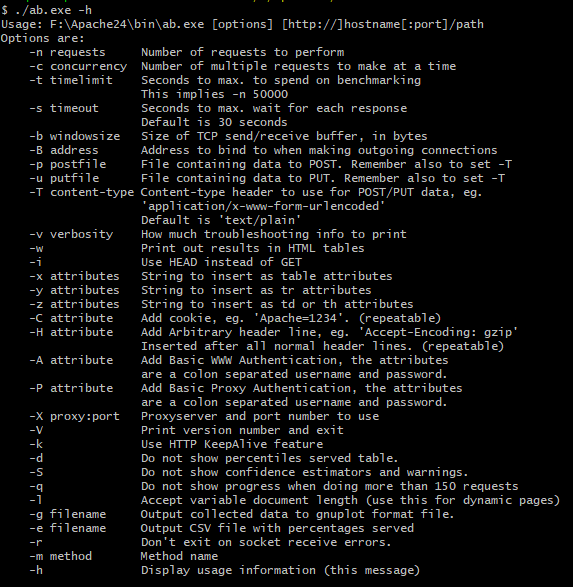
Here is a brief explanation of several parameters, which you can explore flexibly in the process of use
-n is requests, which is used to specify the total number of times the stress test is executed
-c is concurrency, which is used to specify the concurrency of stress test
-t is the timelimit, the maximum time to wait for a response (unit: seconds) (here I understand the longest baseline time, not the timeout limit that disconnects when the maximum time is exceeded)
-s is the timeout, and the corresponding maximum waiting time (unit: seconds, default: 30 seconds)
-p is the postfile, which is the file to be uploaded when sending the POST request. In addition, the - T parameter must be set
-H add any request header, for example: "content length: 0"
3. First GET request test
Launch the test command. Here is a note
It should be noted here that Complete requests cannot be less than Concurrency Level (- n cannot be less than - c). For the specific reason, leave a small question for you to think about and try (there will be a clear exception prompt if you try).
./ab.exe -n 10 -c 2 "http://www.apache.org/"
4. First POST request test
Launch the test command. The post request is slightly different. You need to define the request body in the file, parm.txt, followed by the format, - H is the header parameter
./ab.exe -n 10 -c 2 -p F:/Apache24/htdocs/parm.txt -T "application/json" -H "PK:9937" -r "*(Here is the address)"
3, Analysis of test results
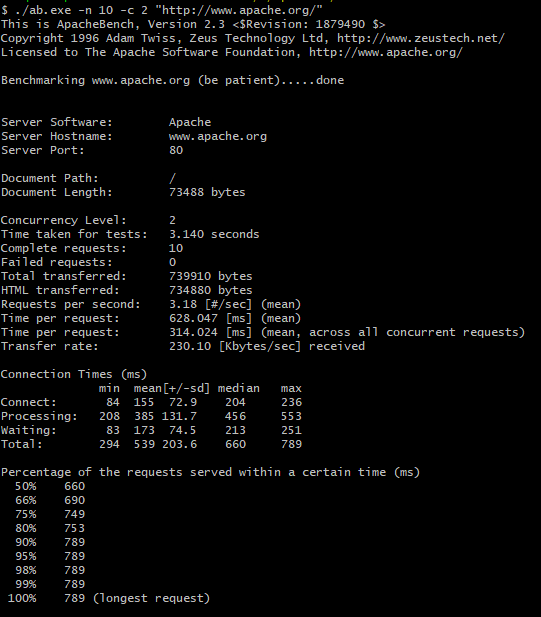
$ ./ab.exe -n 10 -c 2 "http://www.apache.org/"
This is ApacheBench, Version 2.3 <$Revision: 1879490 $>
Copyright 1996 Adam Twiss, Zeus Technology Ltd, http://www.zeustech.net/
Licensed to The Apache Software Foundation, http://www.apache.org/

Benchmarking www.apache.org (be patient).....done


Server Software:        Apache(Software information for the called server)
Server Hostname:        www.apache.org(Target host name)
Server Port:            80(Access destination port)

Document Path:          /(Specific request path or file path)
Document Length:        73488 bytes(Size of request file)

Concurrency Level:      2(Number of concurrent)
Time taken for tests:   3.140 seconds(Total time taken to execute the test call)
Complete requests:      10(Total number of requests initiated in this test)
Failed requests:        0 (Number of failed requests)
Total transferred:      739910 bytes (The total amount of data transmitted refers to ab Total data received from the server under test)
HTML transferred:       734880 bytes (Received from server html Total file size)
Requests per second:    3.18 [#/sec] (mean) (average number of requests completed per second, Complete requests/Time taken for tests, 10 / 3.140 = 3.18)
Time per request:       628.047 [ms] (mean) (In this case, the time that each user perceives the request, that is, the time that the server processes a batch of concurrent requests)
Time per request:       314.024 [ms] (mean, across all concurrent requests)(The average time per request in this concurrency case is theoretically this number*Concurrency number should be approximately equal to the previous value)
Transfer rate:          230.10 [Kbytes/sec] received(Network transmission speed)

Connection Times (ms)
              min  mean[+/-sd] median   max
Connect:       84  155  72.9    204     236
Processing:   208  385 131.7    456     553
Waiting:       83  173  74.5    213     251
Total:        294  539 203.6    660     789

The table is mainly for response time, that is, the first one Time per request Carry out subdivision and statistics. The response time of a request can be divided into network links( Connect),System processing( Processing)And waiting( Waiting)There are three parts in the table min Represents the minimum value; mean Represents the average value;[+/-sd]Represents the standard deviation( Standard Deviation) ,Also known as mean square deviation( mean square error),This concept has been learned in the mathematics class of middle school. It represents the degree of dispersion of data. The larger the value, the more dispersed the data is, and the more unstable the system response time is. median Represents the median; max Of course, it means the maximum value.
Note that in the table Total It does not mean that the data of the first three lines are added together, because the data of the first three lines are not collected in the same request. The network delay of a request may be the shortest, but the system processing time is the longest. Therefore Total It is counted in terms of the time required for the whole request. Here you can see that the slowest request took 789 ms,This data can be verified in the following table.
Percentage of the requests served within a certain time (ms)
  50%    660
  66%    690
  75%    749
  80%    753
  90%    789
  95%    789
  98%    789
  99%    789
 100%    789 (longest request)
The first row of this table indicates 50%All requests are at 660 ms It can be seen that this value is relatively close to the average system response time
 And so on, 90%The request is less than or equal to 789 ms Yes. We just saw that the request with the longest response time was 789 ms,So obviously all requests (100%)The time of is less than or equal to 789 milliseconds, that is, the data in the last row of the table must be the request with the longest time( longest request).
The above is the result of personal data collection practice. If there is any error, please correct it.