Tencent cloud Elasticsearch Service product provides a fully managed cloud service. Customers can create clusters with one click on Tencent cloud console, easily manage clusters, and highly flexible elastic configuration change mode. Therefore, with Tencent cloud ES, you can quickly deploy and expand your cluster on demand, simplify complex operation and maintenance, and quickly build various businesses such as log analysis, exception monitoring, website search, enterprise search, BI analysis, etc. At the same time, Tencent cloud ES team also provides highly professional platform management and control, kernel development and cluster operation and maintenance capabilities. From the perspective of cluster operation and maintenance, this article will share some commands commonly used in our daily work to help customers operate and maintain clusters, as well as the applicable scenarios of each command.
Cluster related commands
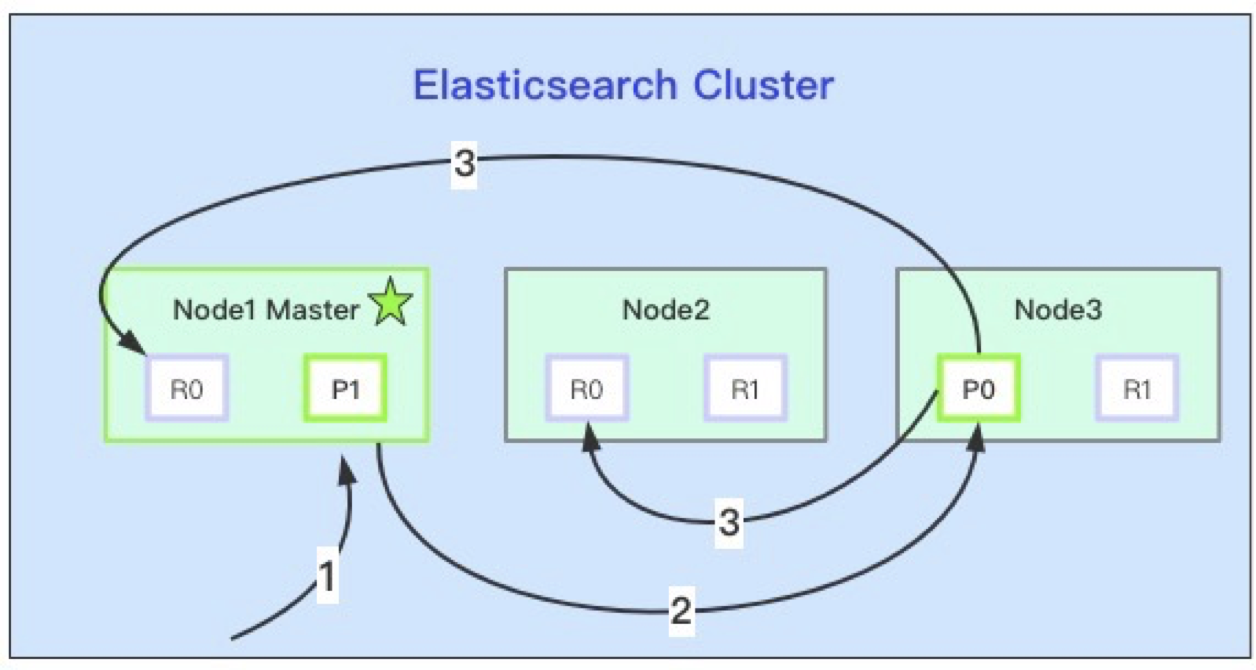
Before introducing the common commands of ES cluster, let's review the basic distributed principle of ES cluster. As can be seen from Figure 1 below, ES cluster is composed of multiple nodes, and a Master node will be selected from the nodes to manage and schedule the cluster; Some index data is stored on each node, and the index data is carried by fragments, that is, there are multiple indexes in the cluster, and there will be multiple fragments in each index. There are one or more segments in the fragment, and the specific doc data is stored in the segment.
As shown in Figure 1 below, when we write to the cluster through the Client, the node 1 where the request first arrives is called the coordination node. The coordination node 1 calculates the node 3 where the primary partition is located according to the request information and forwards the request to the node 3. After the primary partition is successfully written, the node 3 synchronously forwards the request to the nodes 1 and 2 where the replica partition is located, After the nodes where the replica shards are located are successfully written, node 3 returns a request to coordination node 1, and coordination node 1 returns the write success information to the Client.
Above, we briefly reviewed the distributed basic principle and read-write model of ES cluster. Let's introduce the common commands related to es cluster in detail.
1. View cluster health status
GET _cluster/health
Command Response:
{
"cluster_name" : "es-wr-test-cluster",
"status" : "green",
"timed_out" : false,
"number_of_nodes" : 6,
"number_of_data_nodes" : 3,
"active_primary_shards" : 300,
"active_shards" : 561,
"relocating_shards" : 0,
"initializing_shards" : 0,
"unassigned_shards" : 0,
"delayed_unassigned_shards" : 0,
"number_of_pending_tasks" : 0,
"number_of_in_flight_fetch" : 0,
"task_max_waiting_in_queue_millis" : 0,
"active_shards_percent_as_number" : 100.0
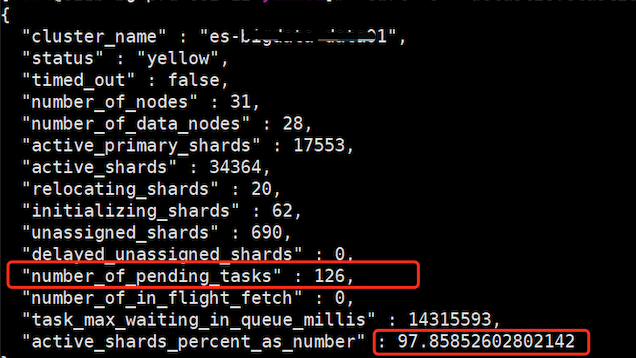
}We know that the cluster has three health states: red, yellow and green. Through this command, we can not only understand the cluster name cluster_name
, the health status of the cluster, and the number of nodes in the cluster_ of_ Nodes, number of data nodes_ of_ data_ Nodes, how many primary partitions are active_primary_shards and sharding relocating under relocation_ Shards, fragment initializing in initialization_ Shards, unassigned fragments that have not been allocated normally_ Shards and other information. If the cluster is in a non green state, we can also use active_shards_percent_as_number to view the progress of cluster recovery.
In addition, from number_ of_ pending_ The tasks parameter can also see the task accumulation of the current cluster. If number_ of_ pending_ The large number of tasks indicates that the Master is a little unable to handle tasks, and the pressure is high.
Figure 2 shows a log cluster health information of our Tencent cloud ES customers. From this figure, we can clearly see that the current status of the cluster is yellow, 690 replica fragments are not normally allocated, 126 task tasks are accumulated, and the current fragment recovery progress is 97.8%.
From the official documentation of the API, we can see that there is a level parameter, which is an optional parameter and provides three enumeration values: cluster, indexes and shards. The default is cluster. If we need to view the health information of the index or fragment dimension, we can use the following API.
GET /_cluster/health?level=indices
GET /_cluster/health?level=shards
It also supports viewing the health information of a specific index:
GET /_cluster/health/wr_index_1?level=indices
GET /_cluster/health/wr_index_1?level=shards
2. View task stacking details
GET /_cat/pending_tasks
Return Response:
insertOrder timeInQueue priority source
       1685       855ms HIGH     update-mapping [foo][t]
       1686       843ms HIGH     update-mapping [foo][t]
       1693       753ms HIGH     refresh-mapping [foo][[t]]
       1688       816ms HIGH     update-mapping [foo][t]
       1689       802ms HIGH     update-mapping [foo][t]
       1690       787ms HIGH     update-mapping [foo][t]
       1691       773ms HIGH     update-mapping [foo][t]
In the above API, we can use get_ Cluster / health to check whether the cluster is currently stacked. If there is accumulation, you can only see the amount of accumulation, not the tasks accumulated, but get/_ cat/pending_ The tasks API can directly view which tasks are executing. From the information returned by the API, we can see that there is a priority field to mark the priority of the task. Looking at the source code, we can see that the tasks processed by the Master mainly have six priorities. The priority from high to low is as follows:
IMMEDIATE > URGENT > HIGH > NORMAL > LOW > LANGUID.
Generally, the priority of creating an index is URGENT and the priority of updating mapping is HIGH. If the data is frequently updated mapping during HIGH pressure writing, it will lead to pending_ The accumulation of tasks is serious, causing great pressure on the Master.
In addition, with GET/_cat/pending_tasks has a similar API. Namely:
GET /_cluster/pending_tasks
Return Response:
{
   "tasks": [
      {
         "insert_order": 101,
         "priority": "URGENT",
         "source": "create-index [foo_9], cause [api]",
         "executing" : true,
         "time_in_queue_millis": 86,
         "time_in_queue": "86ms"
      },
      {
         "insert_order": 46,
         "priority": "HIGH",
         "source": "shard-started ([foo_2][1], node[tMTocMvQQgGCkj7QDHl3OA], [P], s[INITIALIZING]), reason [after recovery from shard_store]",
         "executing" : false,
         "time_in_queue_millis": 842,
         "time_in_queue": "842ms"
      },
      {
         "insert_order": 45,
         "priority": "HIGH",
         "source": "shard-started ([foo_2][0], node[tMTocMvQQgGCkj7QDHl3OA], [P], s[INITIALIZING]), reason [after recovery from shard_store]",
         "executing" : false,
         "time_in_queue_millis": 858,
         "time_in_queue": "858ms"
      }
  ]
}
From the API, you can more intuitively see whether the task is executing and the waiting time in the queue_ in_ queue_ Millis and other details.
3. View cluster metadata status information
GET /_cluster/state/<metrics>/<target>
Through this API, you can get rich metadata related information about the cluster dimension, such as the name, ip, tcp/http port number and node attribute information of all nodes in the cluster. You can also obtain the configured index template information, index fragment routing information, snapshot information, and so on. Because the metadata information returned by the API is large, the returned Response is not listed separately.
If you only want to view the metadata information, you can add the path of / metadata after the API:
GET /_cluster/state/metadata
Similarly, if you only want to view routing_table information, you can also add / routing directly after the API_ path of table:
GET /_cluster/state/routing_table
Through routing_ The specific index name get is added after the table path/_ cluster/state/routing_ table/wr_ index_ 1. We can clearly see the detailed routing information of each partition under the index, as shown in Figure 3.
Return Response:
{
  "cluster_name" : "es-wr-test-cluster",
  "cluster_uuid" : "2LLChSPGRgqZr1cz3b8cXw",
  "routing_table" : {
    "indices" : {
      "wr_index_1" : {
        "shards" : {
          "2" : [
            {
              "state" : "STARTED",
              "primary" : true,
              "node" : "hz6BqoupSuOUuWykrX5c2g",
              "relocating_node" : null,
              "shard" : 2,
              "index" : "wr_index_1",
              "allocation_id" : {
                "id" : "I57fOXAwRvWVv4BYchBW8g"
              }
            }
          ],
          "1" : [
            {
              "state" : "STARTED",
              "primary" : true,
              "node" : "CaQnhaYpQw6vbabGwKaPTw",
              "relocating_node" : null,
              "shard" : 1,
              "index" : "wr_index_1",
              "allocation_id" : {
                "id" : "XqFJWb8fRia00WE8U75jTg"
              }
            }
          ],
          "0" : [
            {
              "state" : "STARTED",
              "primary" : true,
              "node" : "yvtpqeypTke6aFxxwYSjjA",
              "relocating_node" : null,
              "shard" : 0,
              "index" : "wr_index_1",
              "allocation_id" : {
                "id" : "wPRDAv4cTkKQsEtXL8vLHQ"
              }
            }
          ]
        }
      }
    }
  }
}
In addition, we can also use routing directly_ Nodes to view the node routing information of the cluster, as shown in Figure 4:
GET /_cluster/state/routing_nodes
Partial return Response:
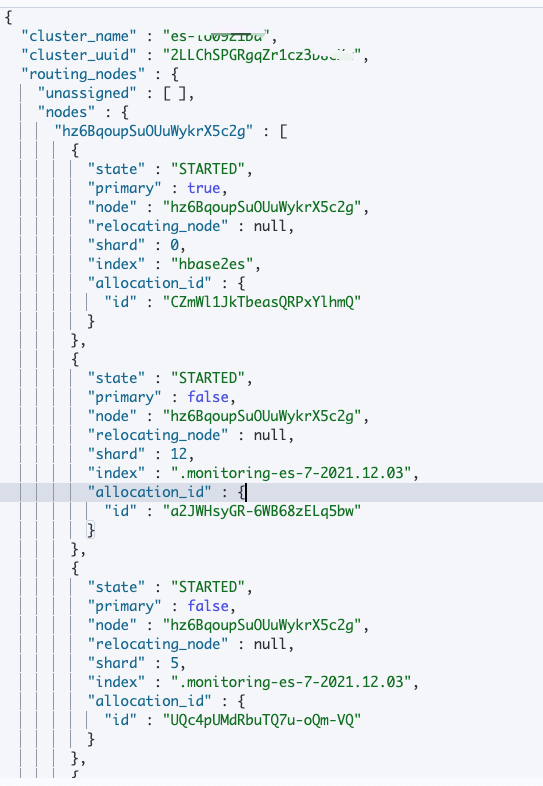
From the node's routing metadata information, we can see the index name allocated on each node, specific partition information, allocation status and other details.
4. View cluster indicator statistics
GET /_cluster/stats
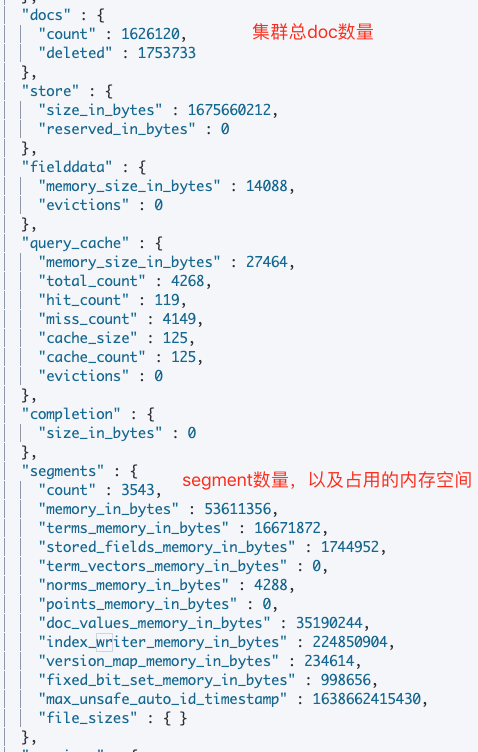
This API displays the related indicator information of cluster dimension statistics. For example, the number of index fragments, storage size, memory utilization, disk utilization and other information, as well as the number of cluster nodes, node roles, attributes, jvm version, memory utilization, cpu utilization and other monitoring information. The API also has a lot of return volume data. Only some information is listed here. As shown in Figure 4:
5. View cluster partition allocation details
GET _cluster/allocation/explain
This API is mainly used to view the specific reasons for the abnormal allocation of non green partitions in the cluster. It is very helpful for diagnosing the abnormal health status of the cluster. For example, in our test cluster, there are three data nodes, the test index wr_index_1 has three main partitions. Now we artificially set the replica to 3 to create the situation that the partition cannot be allocated, as shown in Figure 5.
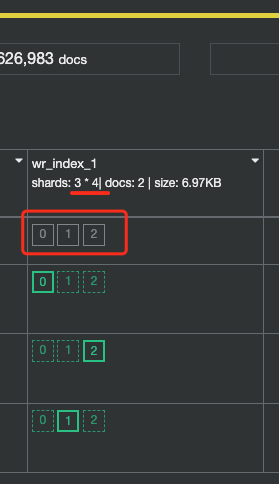
Then we perform get_ Cluster / allocation / explain API, view the specific reasons for allocation failure, and the return is as follows
Return Response:
{
  "index" : "wr_index_1",
  "shard" : 1,
  "primary" : false,
  "current_state" : "unassigned",
  "unassigned_info" : {
    "reason" : "REPLICA_ADDED",
    "at" : "2021-12-05T04:27:48.067Z",
    "last_allocation_status" : "no_attempt"
  },
  "can_allocate" : "no",
  "allocate_explanation" : "cannot allocate because allocation is not permitted to any of the nodes",
  "node_allocation_decisions" : [
    {
      "node_id" : "CaQnhaYpQw6vbabGwKaPTw",
      "node_name" : "16268031430xx00145532",
      "transport_address" : "xx.0.96.xx:9300",
      "node_attributes" : {
        "ml.machine_memory" : "50299387904",
        "rack" : "cvm_4_200003",
        "xpack.installed" : "true",
        "set" : "200003",
        "transform.node" : "true",
        "ip" : "xx.20.57.70",
        "temperature" : "hot",
        "ml.max_open_jobs" : "20",
        "region" : "4"
      },
      "node_decision" : "no",
      "deciders" : [
        {
          "decider" : "same_shard",
          "decision" : "NO",
          "explanation" : "a copy of this shard is already allocated to this node [[wr_index_1][1], node[CaQnhaYpQw6vbabGwKaPTw], [P], s[STARTED], a[id=XqFJWb8fRia00WE8U75jTg]]"
        }
      ]
    },
    {
      "node_id" : "hz6BqoupSuOUuWykrX5c2g",
      "node_name" : "16268031xx43000145432",
      "transport_address" : "xx.0.96.9:9300",
      "node_attributes" : {
        "ml.machine_memory" : "50299387904",
        "rack" : "cvm_4_200003",
        "xpack.installed" : "true",
        "set" : "200003",
        "transform.node" : "true",
        "ip" : "xx.20.56.176",
        "temperature" : "hot",
        "ml.max_open_jobs" : "20",
        "region" : "4"
      },
      "node_decision" : "no",
      "deciders" : [
        {
          "decider" : "same_shard",
          "decision" : "NO",
          "explanation" : "a copy of this shard is already allocated to this node [[wr_index_1][1], node[hz6BqoupSuOUuWykrX5c2g], [R], s[STARTED], a[id=Z5wU3KNHR6-e4Re0PJ4-yQ]]"
        }
      ]
    },
    {
      "node_id" : "yvtpqeypTke6aFxxwYSjjA",
      "node_name" : "162680314xx3000145332",
      "transport_address" : "xx.0.96.20:9300",
      "node_attributes" : {
        "ml.machine_memory" : "50299125760",
        "rack" : "cvm_4_200003",
        "xpack.installed" : "true",
        "set" : "200003",
        "transform.node" : "true",
        "ip" : "xx.20.53.190",
        "temperature" : "hot",
        "ml.max_open_jobs" : "20",
        "region" : "4"
      },
      "node_decision" : "no",
      "deciders" : [
        {
          "decider" : "same_shard",
          "decision" : "NO",
          "explanation" : "a copy of this shard is already allocated to this node [[wr_index_1][1], node[yvtpqeypTke6aFxxwYSjjA], [R], s[STARTED], a[id=LiNqe7G6SwK7q8JZsYphvw]]"
        }
      ]
    }
  ]
}
From the returned information, we can clearly see the index status current_ The state is unassigned. The reason why the partition is not normally allocated is: "REPLICA_ADDED". The reason given by each node is that the replica partition of the index already exists on this node, and two identical partitions cannot be allocated on the same node.
"explanation" : "a copy of this shard is already allocated to this node [[wr_index_1][1], node[yvtpqeypTke6aFxxwYSjjA], [R], s[STARTED], a[id=LiNqe7G6SwK7q8JZsYphvw]]"
We can also directly specify a specific index and partition number in the request body to view the reason why the partition is not normally allocated:
GET _cluster/allocation/explain
{
  "index": "wr_index_1",
  "shard": 0,
  "primary": true
}
If the cluster itself is in green status, that is, all index fragments have been allocated normally, then executing the API will return an error of 400:
Return Response:
{
  "error" : {
    "root_cause" : [
      {
        "type" : "illegal_argument_exception",
        "reason" : "unable to find any unassigned shards to explain [ClusterAllocationExplainRequest[useAnyUnassignedShard=true,includeYesDecisions?=false]"
      }
    ],
    "type" : "illegal_argument_exception",
    "reason" : "unable to find any unassigned shards to explain [ClusterAllocationExplainRequest[useAnyUnassignedShard=true,includeYesDecisions?=false]"
  },
  "status" : 400
}
6. Change partition allocation
POST /_cluster/reroute
This command allows us to manually change the allocation policy of some partitions in the cluster. For example, we can use this API to move some partitions from a specified node to other nodes to balance the number of partitions between nodes and disk utilization.
POST/_ In the commands parameter of the request body of the cluster / reroute API, several attributes supporting execution are defined, namely move, cancel and allocate_replica,allocate_stale_primary and allocate_empty_primary. As follows:
1) Move, move slice
The move attribute can move a normally allocated partition from one node to another. The request body of the move attribute receives the index name and the partition number to be moved, as well as the partition source node name and target node name. For example, the following command will test the index wr_ index_ The 0 partition of 1 is migrated from node 162680314310145332 to node 162680314310145432.
POST /_cluster/reroute
{
  "commands": [
    {
      "move": {
        "index": "wr_index_1",
        "shard": 0,
        "from_node": "1626803143110145332",
        "to_node": "1626803143110145432"
      }
    }
  ]
}
2) Cancel to cancel the relocation or restoration
This attribute can be restored or allocated in pieces. Receive the index name, the partition number to cancel the partition, and the name of the node to cancel the assignment. Usually, this attribute can only cancel the allocation or recovery of replica fragments. If you need to cancel the allocation of the primary partition, you need to include allow in the request_ Primary flag.
POST /_cluster/reroute
{
  "commands": [
    {
      "cancel": {
        "index": "wr_index_1",
        "shard": 0,
        "node": "1626803143110145332"
      }
    }
  ]
}
The value of node is not the fragment source node name, but the target node name.
3)allocate_stale_primary, assign old primary partition
This attribute is used when the primary partition cannot be allocated normally due to the old version. You can use allocate_ stale_ The primary attribute enables the primary partition in the stale to be allocated normally, but some data may be lost, so you need to set accept_ data_ Set the loss parameter to true.
cannot allocate because all found copies of the shard are either stale or corrupt
The specific API is as follows:
POST /_cluster/reroute
{
    "commands" : [
        {
          "allocate_stale_primary" : {
              "index" : "wr_index_1",
              "shard" : 0,
              "node" : "1596598365000222032",
              "accept_data_loss": true
          }
        }
    ]
}
When executing this command, you need to use get_ shard_ Stores? Pretty find the node where the main partition of the stale is located, find the relevant node, and then allocate_stale_primary, that is, it must be the node that has saved the stale fragment, not other nodes. Failure to do so will result in complete loss of data.
It should be noted that if the name is executed successfully and the node that saved the updated replica partition rejoins the cluster, the data on the updated replica partition may be deleted or overwritten.
4)allocate_empty_primary, allocate an empty primary partition
allocate_ empty_ The primary attribute is used to allocate a primary partition of empty data to a node. In the normal cluster operation and maintenance work, we often encounter the situation that some indexes cannot be allocated due to the failure to set a copy and the file damage. In this case, if the customer can receive a piece of data lost, it can slice a primary piece of empty data through the following API to restore green to the cluster. The parameter information received by this attribute is as follows:
POST _cluster/reroute
{
  "commands": [
    {
      "allocate_empty_primary": {
        "index": "wr_index_1",
        "shard": 0,
        "node": "1582165889001471732",
        "accept_data_loss": true
      }
    }
  ]
}
7. Viewing and setting cluster settings information
GET /_cluster/settings
When we need to know which settings are set in the cluster, we can use get/_ View the cluster / settingsapi. For example, after setting the concurrency and migration speed of the cluster, and then executing the view API, you can see the returned Response as follows:
{
  "persistent" : { },
  "transient" : {
    "cluster" : {
      "routing" : {
        "allocation" : {
          "node_concurrent_recoveries" : "8"
        }
      }
    },
    "indices" : {
      "recovery" : {
        "max_bytes_per_sec" : "80mb"
      }
    }
  }
}
Through this API, we can clearly see which cluster attribute information has been manually set.
If you need to modify some settings properties, you can use put uniformly/_ cluster/settingsAPI. Here we introduce several common property setting APIs:
1) Set the concurrency and speed of cluster partition relocation
PUT /_cluster/settings
{
    "persistent" : {
        "cluster.routing.allocation.node_concurrent_recoveries": "8",
        "cluster.routing.allocation.cluster_concurrent_rebalance": "8",
        "indices.recovery.max_bytes_per_sec": "80mb"
    },
    "transient" : {
        "cluster.routing.allocation.node_concurrent_recoveries": "8",
        "cluster.routing.allocation.cluster_concurrent_rebalance": "8",
        "indices.recovery.max_bytes_per_sec": "80mb"
    }
}
2) Set cluster disk usage watermark
PUT /_cluster/settings
{
  "persistent": {
    "cluster.routing.allocation.disk.watermark.high":"95%",
    "cluster.routing.allocation.disk.watermark.low":"93%"
  },
  "transient": {
    "cluster.routing.allocation.disk.watermark.high":"95%",
    "cluster.routing.allocation.disk.watermark.low":"93%"
  }
}
3) Expel data on a node
PUT _cluster/settings
{
  "persistent": {
    "cluster.routing.allocation.exclude._name": "161070127670100270532"
  },
  "transient": {
    "cluster.routing.allocation.exclude._name": "161070127670100270532"
  }
}
4) Set the minimum number of selected primary nodes in the cluster
PUT _cluster/settings
{
  "persistent": {
    "discovery.zen.minimum_master_nodes": 2
  },
  "transient": {
    "discovery.zen.minimum_master_nodes": 2
  }
}
5) Make the cluster read-only
PUT _cluster/settings
{
   "transient": {
       "cluster.blocks.read_only_allow_delete": true
   }
}
6) Enable / disable xpack cluster monitoring collection
PUT _cluster/settings
{
  "persistent": {
    "xpack.monitoring.collection.enabled": true,
    "xpack.monitoring.collection.interval": "10s" // Set acquisition cycle
  }
}
7) Turns cluster wildcard mode on / off
PUT _cluster/settings
{
"transient": {
  "action.destructive_requires_name": "false"
}
}
8) Set the total number of shards per node in the cluster
PUT _cluster/settings
{
  "transient": {
    "cluster.max_shards_per_node": 10000
  }
}
9) Set the cluster mapping update timeout
PUT _cluster/settings
{
  "transient": {
    "indices.mapping.dynamic_timeout": "20s"
  }
}
10) Turn cluster auto index creation on / off
PUT _cluster/settings
{
  "transient": {
    "action.auto_create_index": true
  }
}
8. View cluster task details
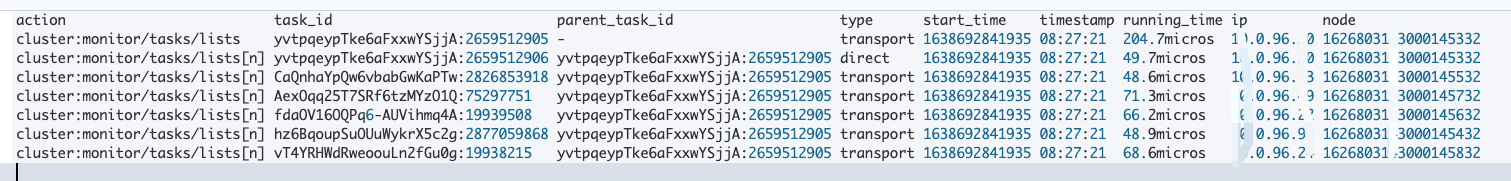
The tasks API can obtain the information about the tasks currently being executed on each node of the cluster.
GET /_tasks
GET /_tasks/<task_id>
For example, we can view the task information being executed on a node and use get_ Tasks? Nodes = 162680314300145732api, the returned Response is as follows:
{
  "nodes" : {
    "AexOqq25T7SRf6tzMYzO1Q" : {
      "name" : "1626803143000145732",
      "transport_address" : "xx.0.96.49:9300",
      "host" : "xx.0.96.49",
      "ip" : "xx.0.96.49:9300",
      "roles" : [
        "master",
        "ml",
        "remote_cluster_client"
      ],
      "attributes" : {
        "ml.machine_memory" : "16478932992",
        "rack" : "cvm_4_200003",
        "xpack.installed" : "true",
        "set" : "200003",
        "transform.node" : "false",
        "ip" : "xx.20.58.203",
        "temperature" : "hot",
        "ml.max_open_jobs" : "20",
        "region" : "4"
      },
      "tasks" : {
        "AexOqq25T7SRf6tzMYzO1Q:75293702" : {
          "node" : "AexOqq25T7SRf6tzMYzO1Q",
          "id" : 75293702,
          "type" : "transport",
          "action" : "cluster:monitor/tasks/lists[n]",
          "start_time_in_millis" : 1638692226488,
          "running_time_in_nanos" : 88582,
          "cancellable" : false,
          "parent_task_id" : "hz6BqoupSuOUuWykrX5c2g:2877050563",
          "headers" : { }
        }
      }
    }
  }
}
From the tasks parameter, you can see that a task is being executed, that is, the taskId is: AexOqq25T7SRf6tzMYzO1Q:75293702.
If we want to see the details of the taskId, we use API: GET/_tasks/AexOqq25T7SRf6tzMYzO1Q:75293702.
View the of this API Official documents , you can see that there is a detailed parameter, which is set to false by default. If we explicitly specify true, we can get more detailed information about the task currently executing.
GET _tasks?actions=*search&detailed=true
Cancel task: if we want to be able to manually terminate the execution of some tasks, we can use_ tasks/cancel. For example, if we want to cancel the execution of reindex tasks on node 1 and node 2, use the following API:
POST _tasks/_cancel?nodes=nodeId1,nodeId2&actions=*reindex
We can also pass_ cat/tasks to get and_ Tasks the same information.
GET _cat/tasks?v=true
Return the Response as shown in Figure 6:
Summary of common commands for cluster operation and maintenance
In this paper, from the perspective of cluster operation and maintenance, we introduce the cluster dimension related commands commonly used in our daily cluster operation and maintenance work. The following is summarized in table form:
command | API command description |
|---|---|
GET /_cluster/health | View cluster health status and other information |
GET /_cat/pending_tasks | View cluster task accumulation |
GET /_cluster/state/<metrics>/<target> | View the detailed metadata information of the cluster |
GET /_cluster/stats | View the statistics of each dimension of the cluster, including the utilization of node CPU, JVM, etc |
GET _cluster/allocation/explain | View cluster partition allocation details |
POST /_cluster/reroute | Change partition allocation policy |
GET /_cluster/settings | View cluster level settings information |
GET /_tasks | View the task information being executed in the cluster |