The following is the contribution of the apprentice in December
However, some apprentices are still reluctant to start and feel that single cells are too complex. In order to maximize the incentive for everyone to take action, we even promise that you just need to share and provide literature with data sets. We directly help write code for the apprentices to understand and interpret. Hand to hand teaching
Then, a little partner posted a pdf document on the exchange group, that is, the article published last week (December 2, 2021). Science online published a research paper by Kenneth D. Birnbaum team of New York University entitled ground tissue circuit regulations organ complexity in maize and Setaria, which uses Seurat's standard Dimensionality Reduction Clustering process, Therefore, 21 single cell subsets numbered 0-20 were obtained, as follows:

The 21 single-cell subsets numbered 0-20
It can be seen that after Seurat's standard Dimensionality Reduction Clustering and clustering process, researchers directly gave these cell subsets a biological name. Generally speaking, the naming of subsets requires specific marker genes, which comes from the booming articles in the field of life science in the past 100 years. But I read the article:
Specific marker genes
I feel that gene names are strange, just a number, and I don't know which team is standardizing and maintaining such gene names.
Now let's begin 10 minutes to reproduce the data processing of the corn single cell article of Science magazine
Its single cell data set is https://www.ncbi.nlm.nih.gov/geo/query/acc.cgi?acc=GSE173087 , you can see 9 samples:
GSM5259613 Zmroot_sc_read1/2_rep1
GSM5259614 Zmroot_sc_read1/2_rep2
GSM5259615 Zmroot_sc_read1/2_rep3
GSM5603496 Zmroot_sc_read1/2_rep4
GSM5603497 Zmroot_sc_read1/2_rep5
GSM5603498 Zmroot_sc_read1/2_rep6
GSM5603499 Zmroot_sc_read1/2_rep7
GSM5603500 Zmroot_sc_read1/2_rep8
GSM5603501 Zmroot_sc_read1/2_rep9
The following 17.4 Mb file stores less than 5000 single cells:
GSE173087_Maize_rootsc_counts.txt.gz
You need to simply download it, then copy and paste my 30 lines of code to run it:
library(Seurat)

library(data.table)
# Read 17.4 Mb file
ct=fread( 'GSE173087_Maize_rootsc_counts.txt.gz',data.table = F)
ct[1:4,1:4]
rownames(ct)=ct[,1]
ct=ct[,-1]
## Initialize the Seurat object with the raw (non-normalized data).
maize <- CreateSeuratObject(counts = ct,
                           project = "maize",
                           min.cells = 3,
                           min.features = 200)
maize
## Normalizing the data
maize <- NormalizeData(maize, normalization.method = "LogNormalize",
                      scale.factor = 10000)

maize <- NormalizeData(maize)

## Identify the 2000 most highly variable genes
maize <- FindVariableFeatures(maize, selection.method = "vst", nfeatures = 2000)

## In addition we scale the data
all.genes <- rownames(maize)
maize <- ScaleData(maize, features = all.genes)

maize <- RunPCA(maize, features = VariableFeatures(object = maize),
               verbose = FALSE)
maize <- FindNeighbors(maize, dims = 1:10, verbose = FALSE)
maize <- FindClusters(maize, resolution = 0.5, verbose = FALSE)
maize <- RunUMAP(maize, dims = 1:10, umap.method = "uwot", metric = "cosine")
table(maize$seurat_clusters)
phe=maize@meta.data
save(phe,file = 'phe-by-basic-seurat.Rdata')

# maize.markers <- FindAllMarkers(maize, only.pos = TRUE, min.pct = 0.25,  logfc.threshold = 0.25, verbose = FALSE)
DimPlot(maize, reduction = "umap", group.by = 'seurat_clusters',
        label = TRUE, pt.size = 0.5)
The code above is actually Seurat's standard dimensionality reduction clustering process. It can be seen that it is a single-cell subgroup numbered 0-18:
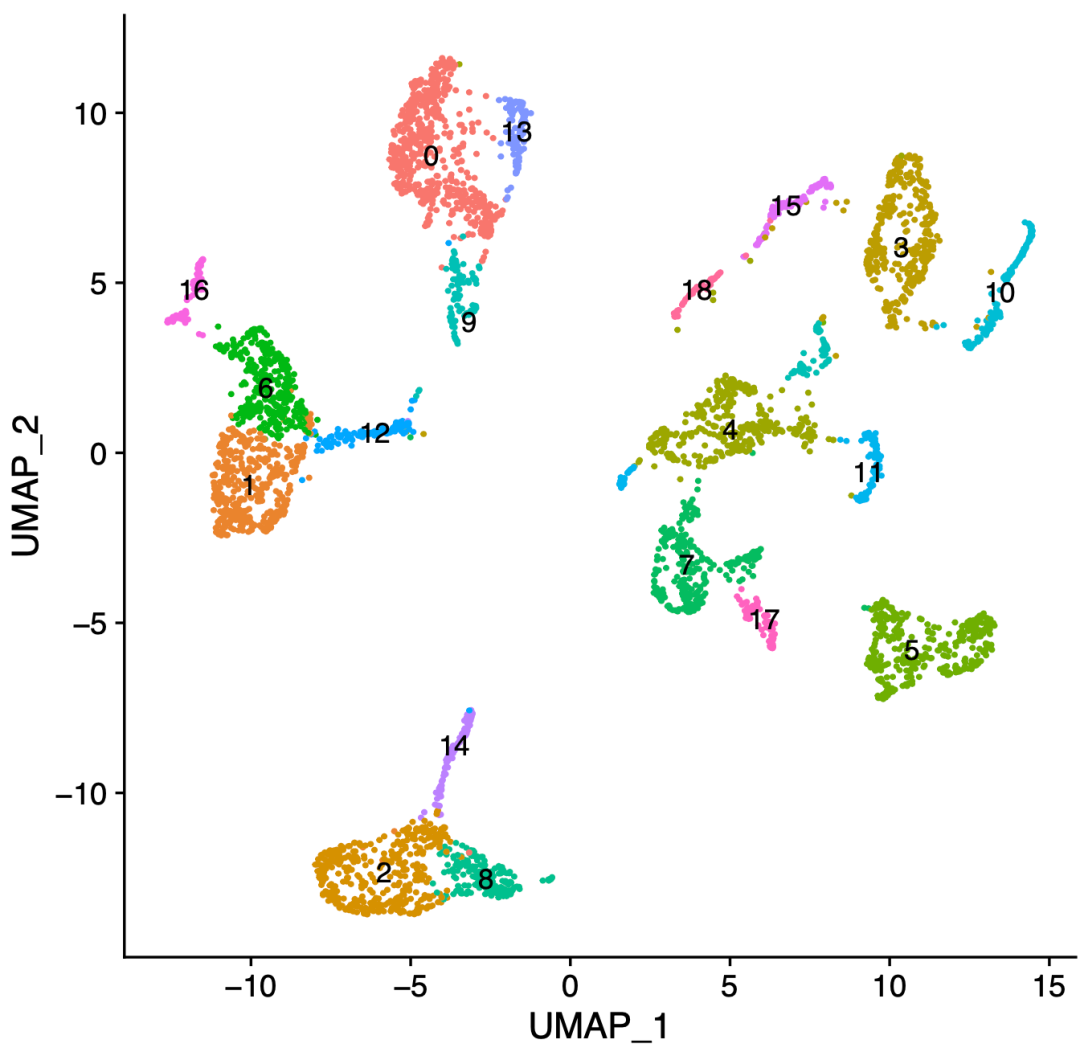
Single cell subsets numbered 0-18
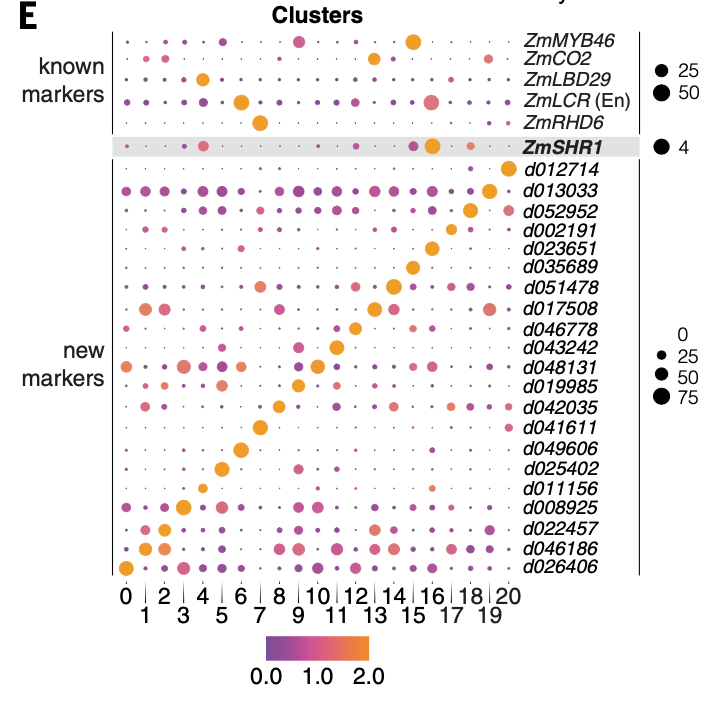
Next, we need to visualize the known marker genes, and the code is super simple:
head(rownames(maize))
cg= c( 'ZmMYB46','ZmCO2','ZmLBD29','ZmLCR','ZmRHD6')
cg=c('d012714','d013033','d052952','d002191','d023651',
     'd035689','d051478','d017508','d046778','d043242',
     'd048131','d019985','d042035','d041611','d049606',
     'd025402','d011156','d008925','d022457','d046186','d026406')
library(ggplot2)
p1=DotPlot(maize, features =paste0('Zm00001',cg) ,
        group.by = 'seurat_clusters')  + coord_flip()
p2=DimPlot(maize, reduction = "umap",
        label = TRUE, pt.size = 0.5) + NoLegend()
ggsave(p1,filename = 'markers.pdf')
ggsave(p2,filename = 'umap.pdf')
library(patchwork)
p1+p2
ggsave( filename = 'markers-and-umap.pdf',width = 15)

if(F){
  ## Assigning cell type identity to clusters
  new.cluster.ids <- c("Naive CD4 T", "CD14+ Mono", "Memory CD4 T", "B", "CD8 T",
                       "FCGR3A+ Mono", "NK", "DC", "Platelet")
  names(new.cluster.ids) <- levels(maize)
  maize <- RenameIdents(maize, new.cluster.ids)
}
The diagram is as follows:
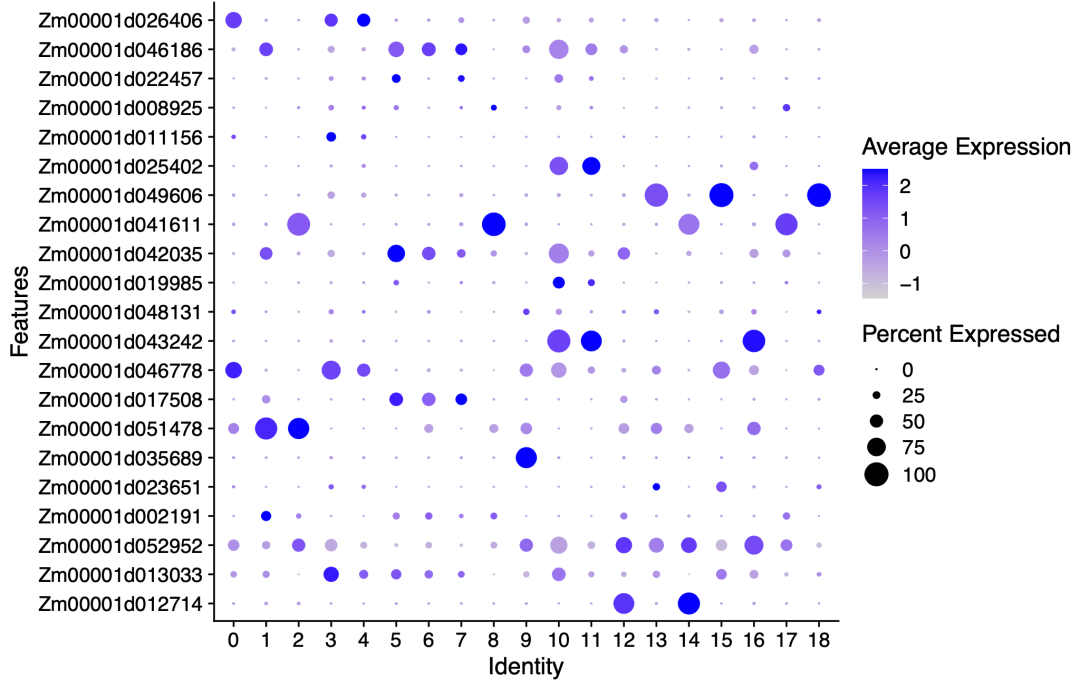
Strange genetic names
You can see that these gene names are prefixed with Zm00001. I don't know why this special version of the database of Maize Species!
See here if you can't complete the two core charts of our tutorial in 10 minutes
You don't know the R language, how to install the R package mentioned in my tutorial, and how to copy and paste the running code.
Of course, drawing does not mean the end. We did come up with an important chart for the data processing of the corn single cell article of Science magazine in 10 minutes, but our understanding of the Science literature has not increased at all.
We look forward to you joining our single-cell communication group. As long as you find the single-cell article you are interested in and are willing to share it, we will write code for you to analyze it!
You share, I analyze, strong alliance!
Nine o'clock every night for 100 times! Welcome small partners interested in single cells to join us to discuss learning and improvement! (the membership password is 1024)
Although the above codes can be run by copying and pasting, if you want to better complete the above diagram, you usually need to master five R packages: scanner, monocle, Seurat, scran and m3drop. You need to master their objects: Some single-cell transcriptome R-package objects And the analysis process is similar:
- step1: create object
- Step 2: quality control
- Step 3: standardization and normalization of expression
- step4: remove interference factors (integration of multiple samples)
- step5: judge important genes
- step6: multiple dimensionality reduction algorithms
- step7: visual dimension reduction results
- step8: multiple clustering algorithms
- step9: find the marker gene of each cell subgroup after clustering
- step10: continue classification