1, Prometheus deployment
Environmental preparation
hostnamectl set-hostname prometheus
systemctl stop firewalld
systemctl disable firewalld
setenforce 0
vim /etc/resolv.conf
nameserver 114.114.114.114
ntpdate ntp1.aliyun.com 					#Time synchronization must be done, otherwise there will be problems
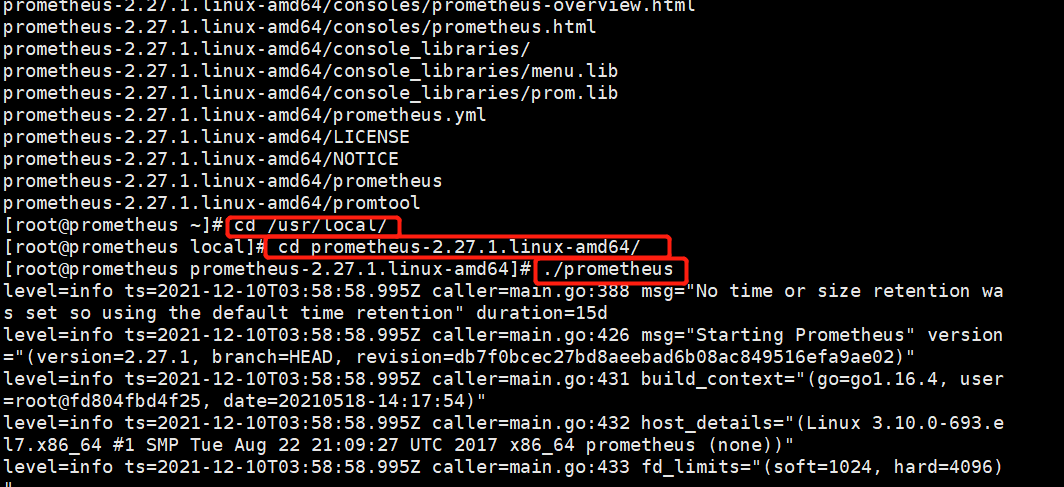
Unpack and start service
#Drag the installation package in and unzip the specified directory
tar zxvf prometheus-2.27.1.linux-amd64.tar.gz -C /usr/local/
cd /usr/local/
cd prometheus-2.27.1.linux-amd64/
./prometheus
Open another terminal and check whether the port has been opened
[root@prometheus ~]#netstat -antp | grep 9090
tcp6       0      0 :::9090                 :::*                    LISTEN      2463/./prometheus
tcp6       0      0 ::1:9090                ::1:53170               ESTABLISHED 2463/./prometheus
tcp6       0      0 ::1:53170               ::1:9090                ESTABLISHED 2463/./prometheus

Visit the web page 192.168 74.135:9090 (expression browser)
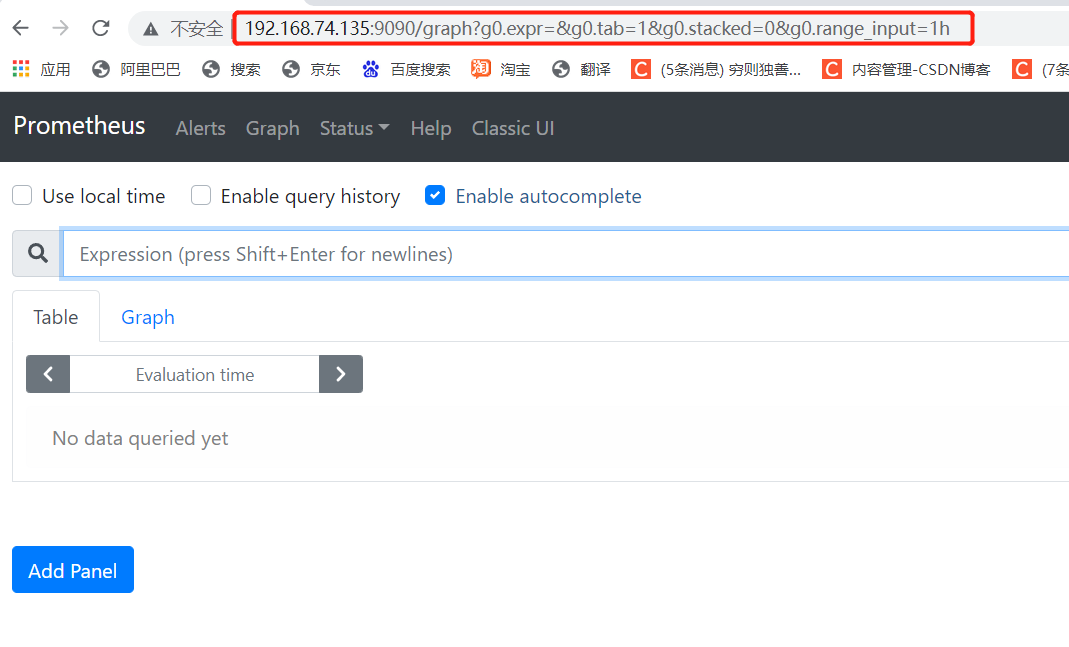
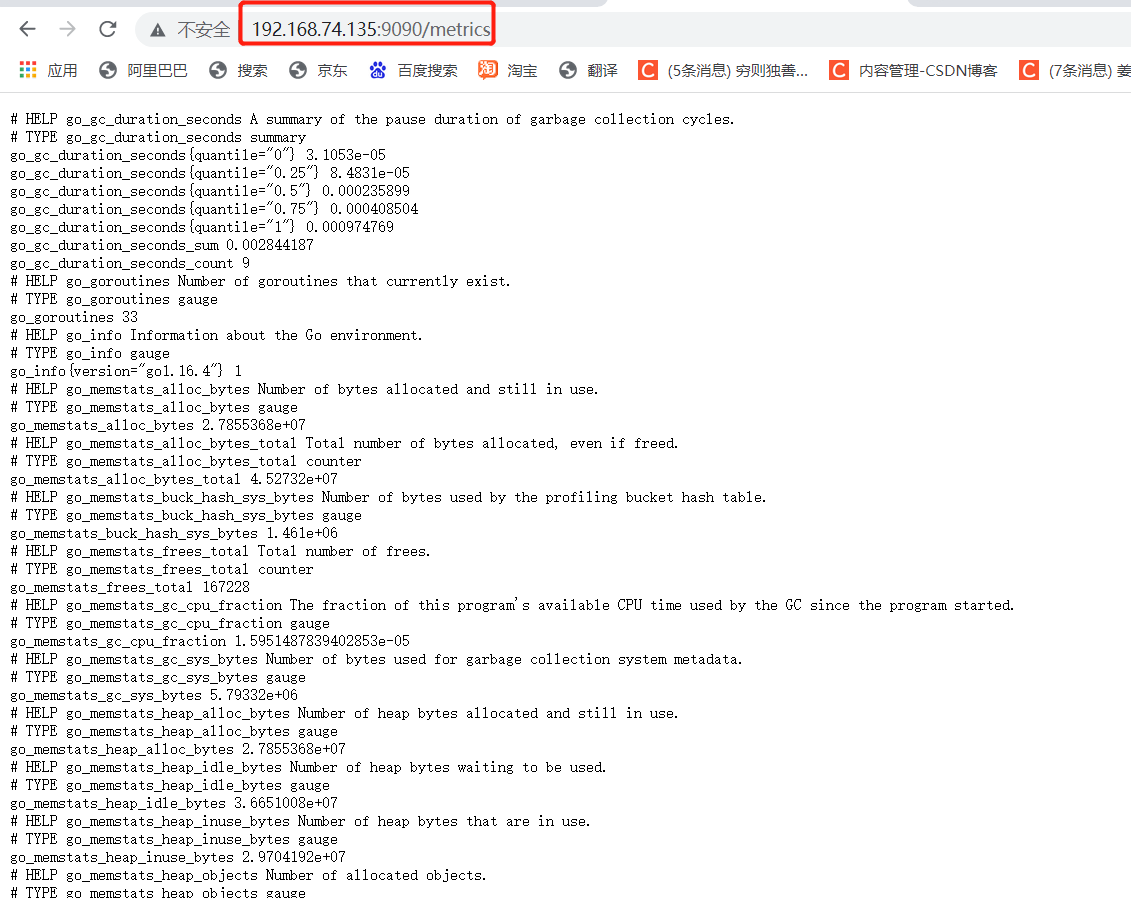
Visit 192.168 74.135:9090/metrics view the internal key indicators of prometheus
2, Deploy and monitor other nodes
| host name | address | Required installation package |
|---|---|---|
| prometheus | 192.168.74.135 | prometheus-2.27.1.linux-amd64.tar.gz |
| server1 | 192.168.74.122 | node_exporter-1.1.2.linuz-amd64.tar.gz |
| server2 | 192.168.74.128 | node_exporter-1.1.2.linuz-amd64.tar.gz |
| server3 | 192.168.74.131 | node_exporter-1.1.2.linuz-amd64.tar.gz |
Since the primary server has been configured, it will not be reconfigured
1. Main configuration file analysis
cd prometheus-2.27.1.linux-amd64/
vim prometheus.yml
my global config
global:													#Global component
  scrape_interval:     15s # Set the scrape interval to every 15 seconds. Default is every 1 minute.  												#How often do I grab indicators? 1 minute is not set by default
  evaluation_interval: 15s # Evaluate rules every 15 seconds. The default is every 1 minute.
  														#Evaluation cycle of built-in alarm rules
 #scrape_timeout is set to the global default (10s).

# Alertmanager configuration		 					#Docked altermanager (third party alarm module)
alerting:
  alertmanagers:
  - static_configs:
    - targets:
      - alertmanager:9093

# Load rules once and periodically evaluate them according to the global 'evaluation_interval'.
rule_files:		 										#Alarm rules; Alarm rules can be written using yml rules
- "first_rules.yml"
- "second_rules.yml"

# A scrape configuration containing exactly one endpoint to scrape:
# Here it's Prometheus itself.
scrape_configs:		 									#data acquisition module
# The job name is added as a label `job=<job_name>` to any timeseries scraped from this config.		##The source of the captured indicator data collection is the job_name
  	- job_name: 'prometheus'		 					#For the label of indicators and Prometheus SQL (query statement): for example, prometheus{target='values'}

  	 # metrics_path defaults to '/metrics' 		  		#The path to collect data; Show how to use metrics mode
    	 # scheme defaults to 'http'.		 			#The default fetching method is http

   	 static_configs:		 							#For the static configuration of Prometheus, the listening port is the specific data collection location. The default port is 9090
   	 - targets: ['localhost:9090']
2. server node configuration
Upload compressed package loading node_exporter
tar zxvf node_exporter-1.1.2.linux-amd64.tar.gz
cd node_exporter-1.1.2.linux-amd64/
cp node_exporter /usr/local/bin/
Open service
./node_exporter
netstat -antp | grep 9100
./node_exporter --help		 						#You can view command options
 Service management mode utilfile(File reading tool)
[Unit]
Description=node_exporter
Documentation=https:/prometheus.io/
After=network.targets
[serveice]
Type=simple
User=prometheus
ExecStart=/usr/local/bin/node_exporter \
    --collector.ntp \
    --collector.mountstats \
    --collector.systemd \
    --collertor.tcpstat
ExecReload=/bin/kill -HUP $MAINPID
TimeoutStopSec=20s
Restart=always
[Install]
WantedBy=multi-user.target

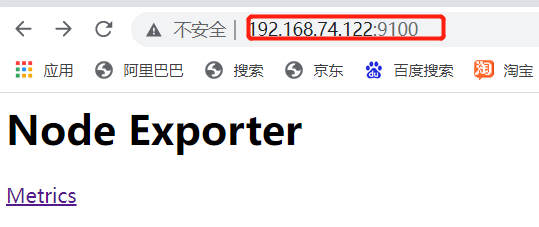
- Visit the save server node to view the captured content
- Access master node to view content
3. Join slave node monitoring
Required at 192.168 74.135 the prometheus server stops prometheus, modifies the configuration file and adds static targets before the server node can join
cd /usr/local/prometheus-2.27.1.linux-amd64/
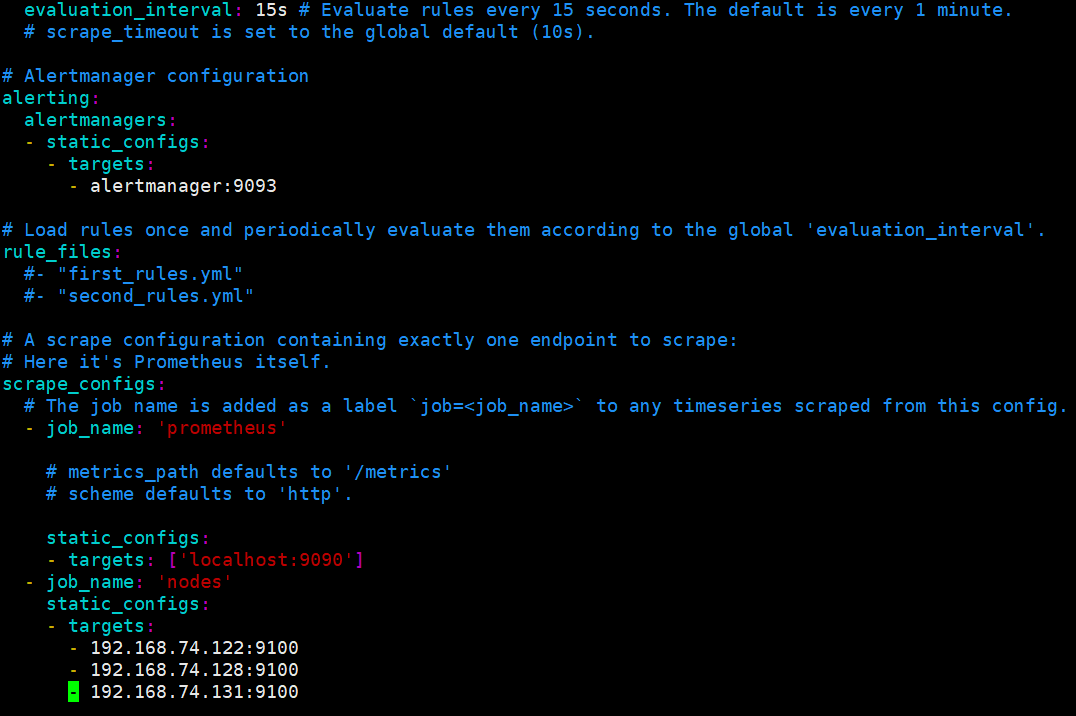
vim prometheus.yml #Add the following at the end of the configuration file
- job_name: 'nodes'
static_configs:
- targets:
- 192.168.74.122:9100
- 192.168.74.128:9100
- 192.168.74.131:9100
./prometheus #Start service
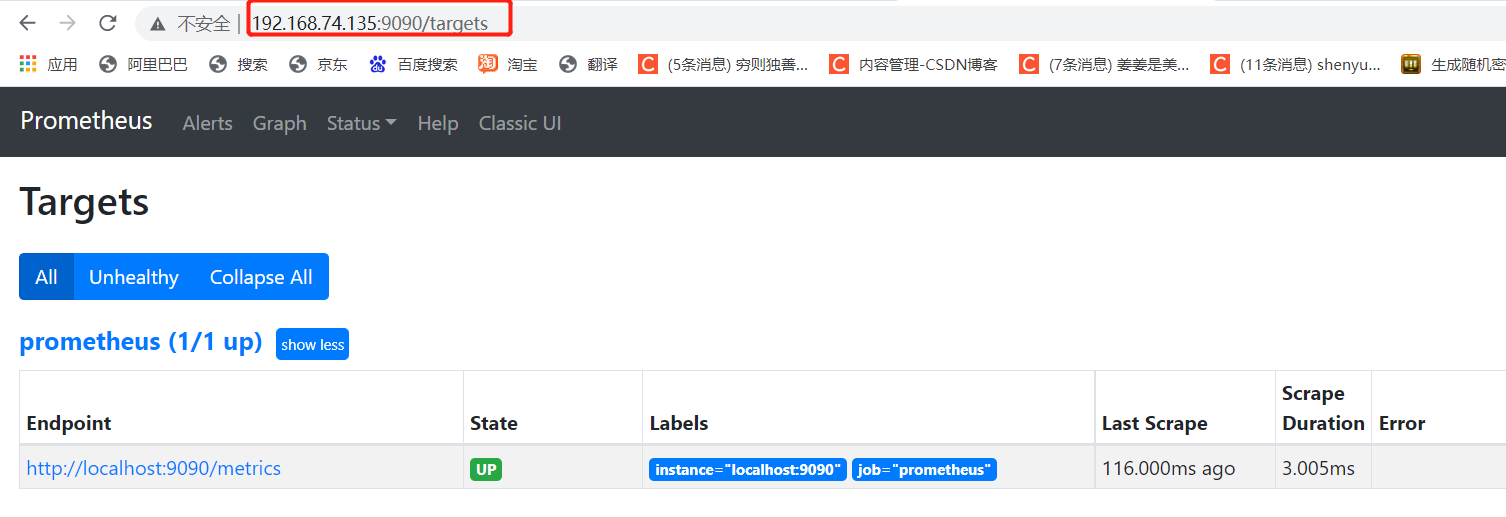
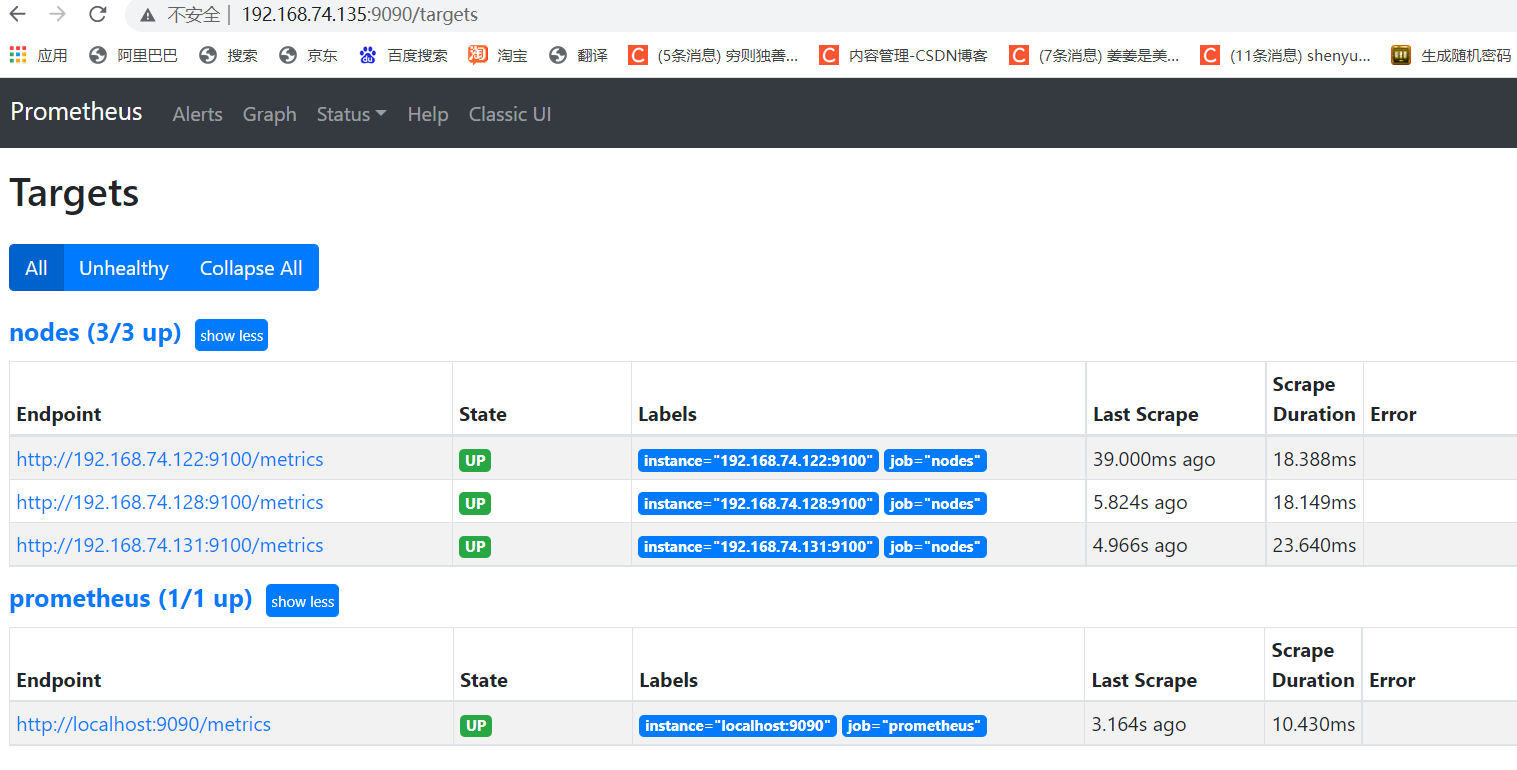
4. Verify whether the join is successful
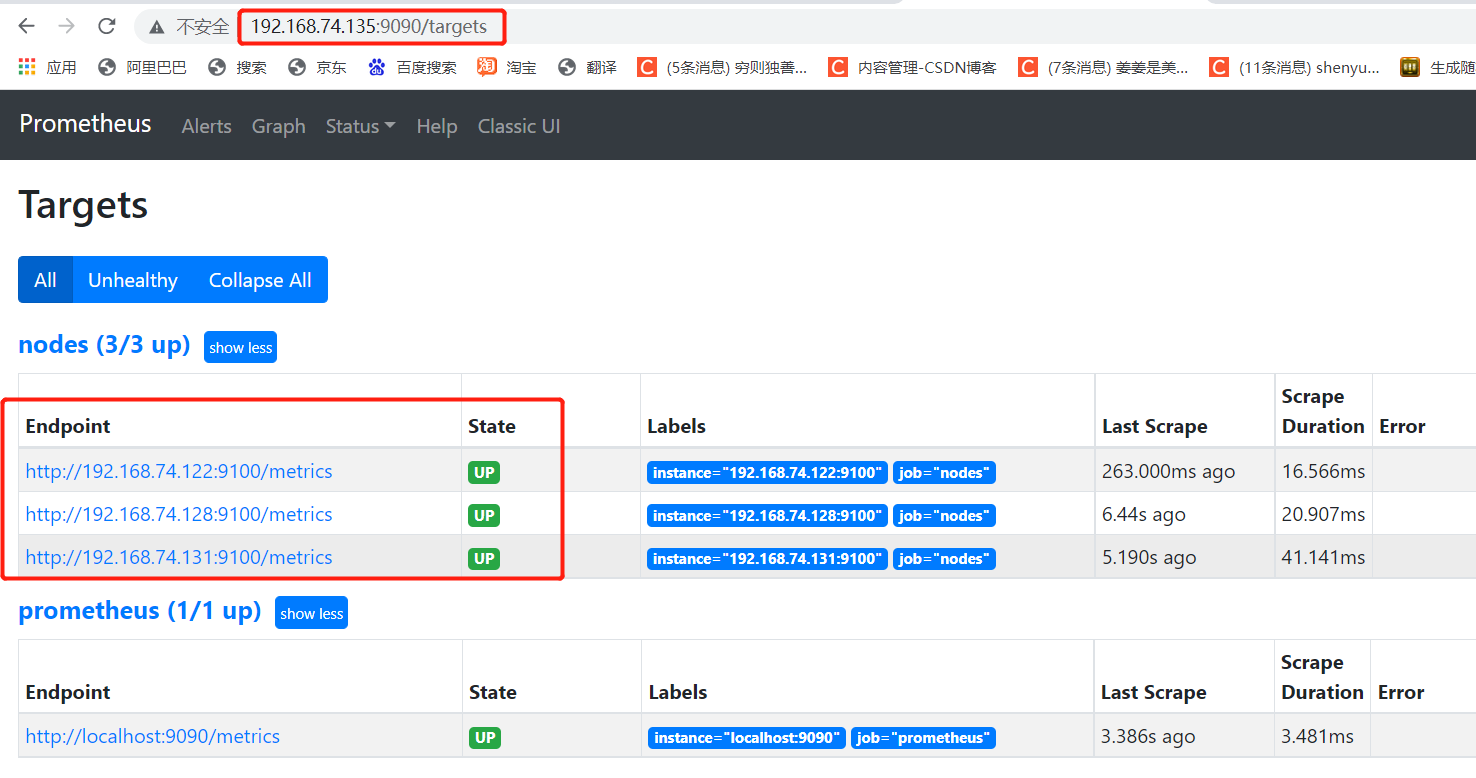
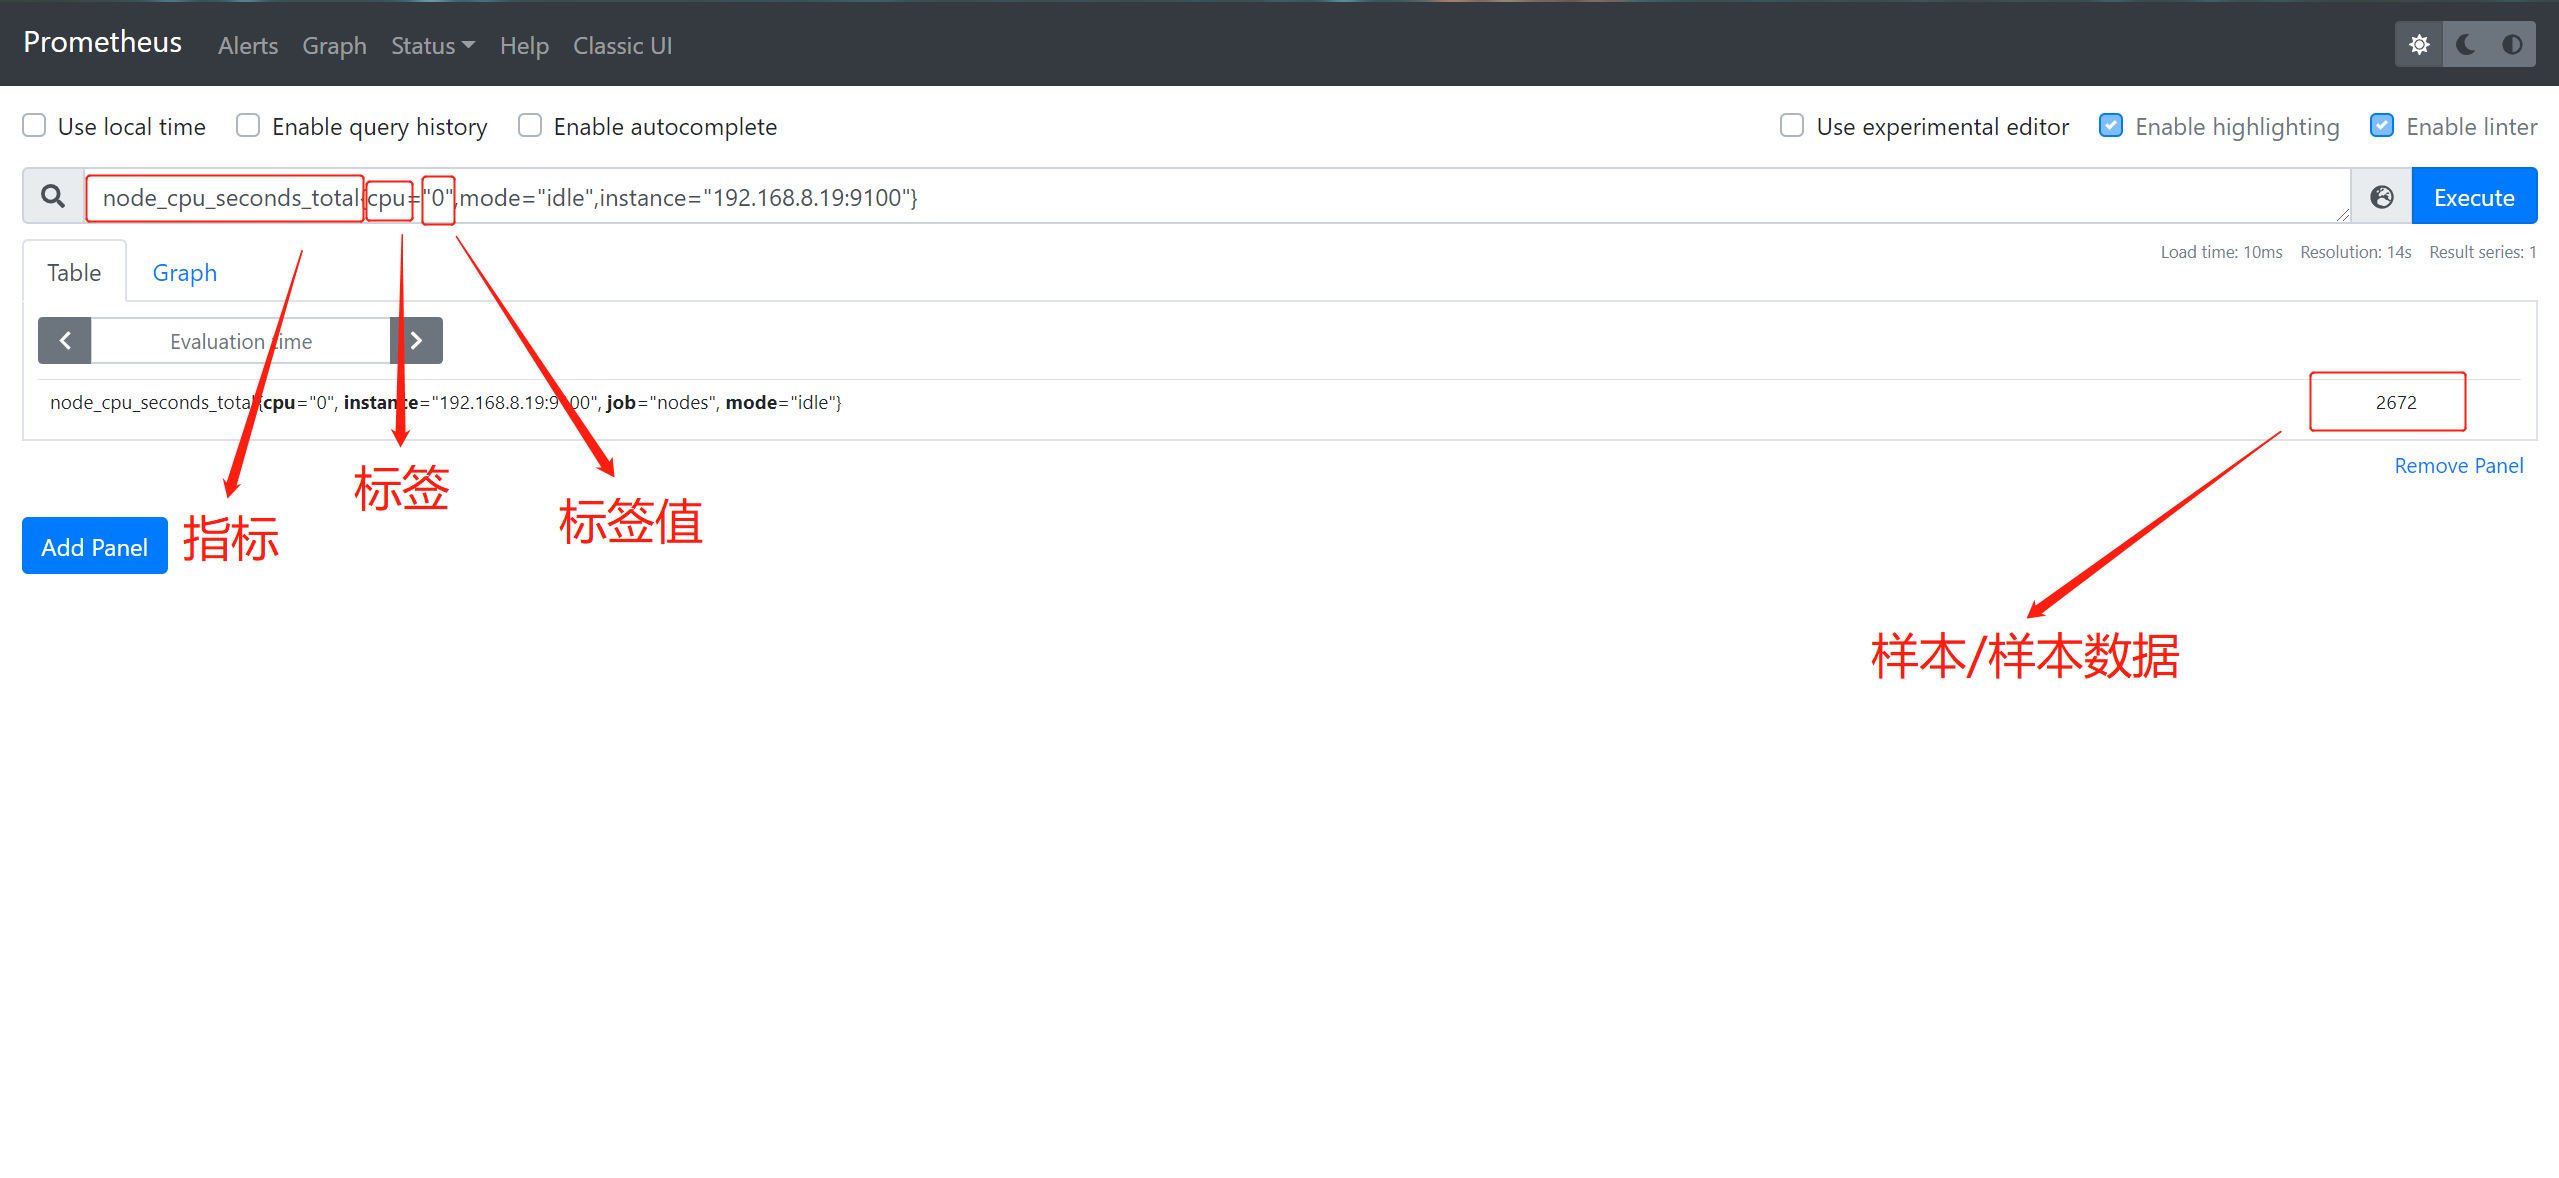
3, Expression browser
1. General use of expression browser
Data filtering can be performed on the Prometheus UI console
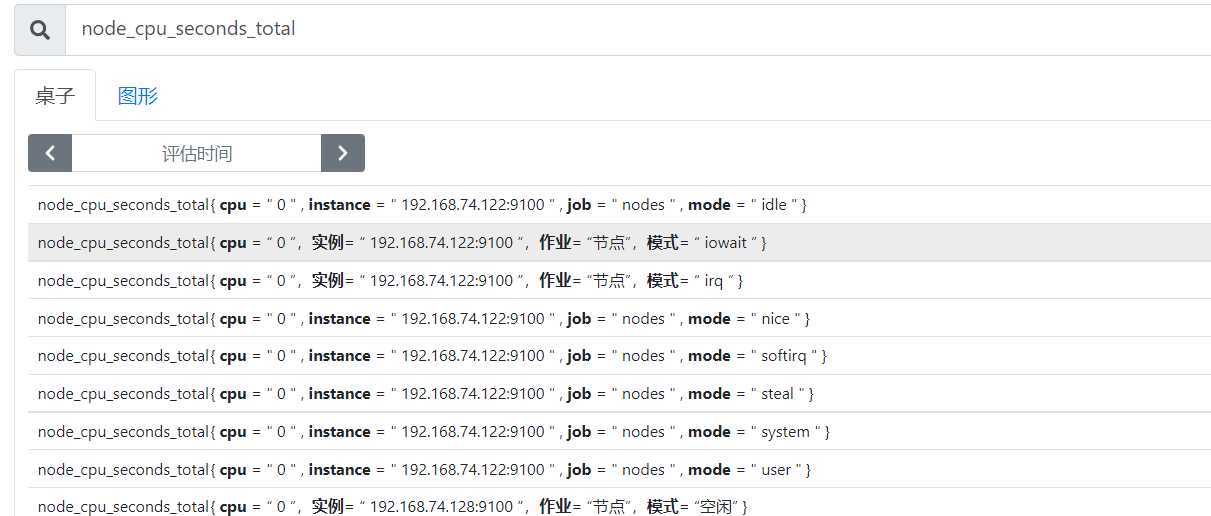
- View total CPU usage
node_cpu_seconds_total
- Calculate the CPU idle rate in the past 5 minutes
irate(node_cpu_seconds_total{mode="idle"}[5m])
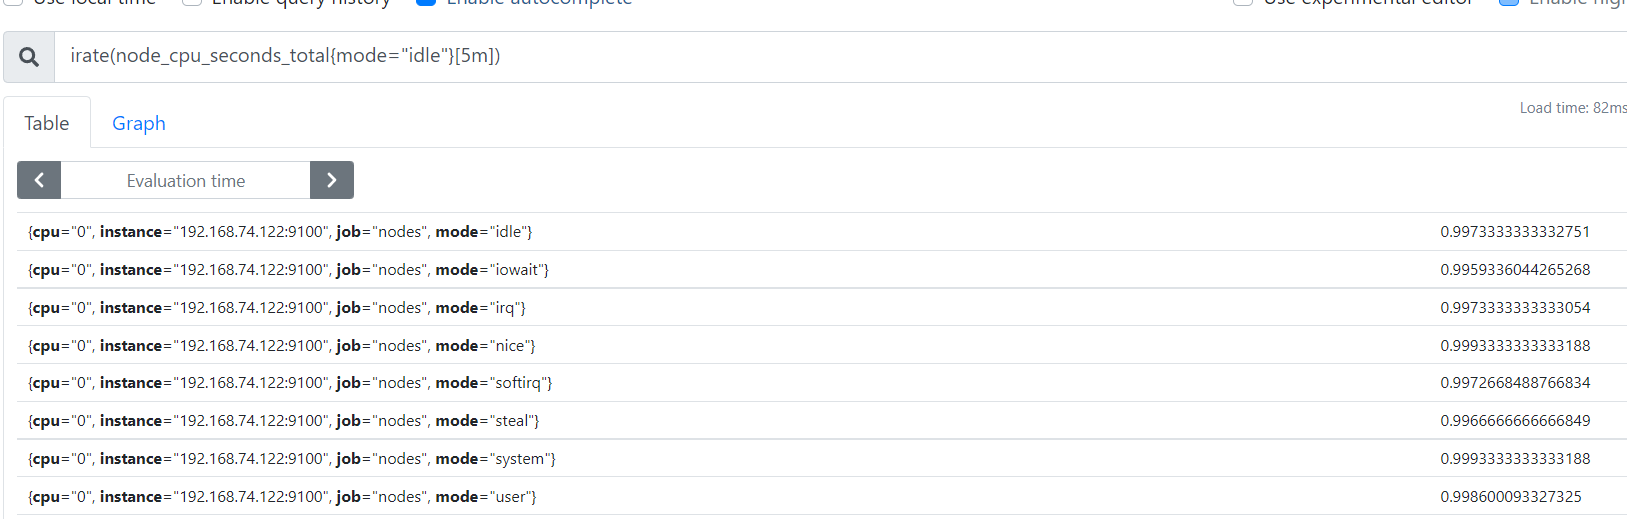
- Resolution:
irate: rate calculation function (very sensitive)
node_cpu_seconds_total: total CPU usage of node (indicator)
mode = "idle" idle indicator (label)
5m: sample values of all CPU idle numbers in the past 5 minutes, and rate calculation is performed for each value
{mode = "idle"}: the whole is called label filter
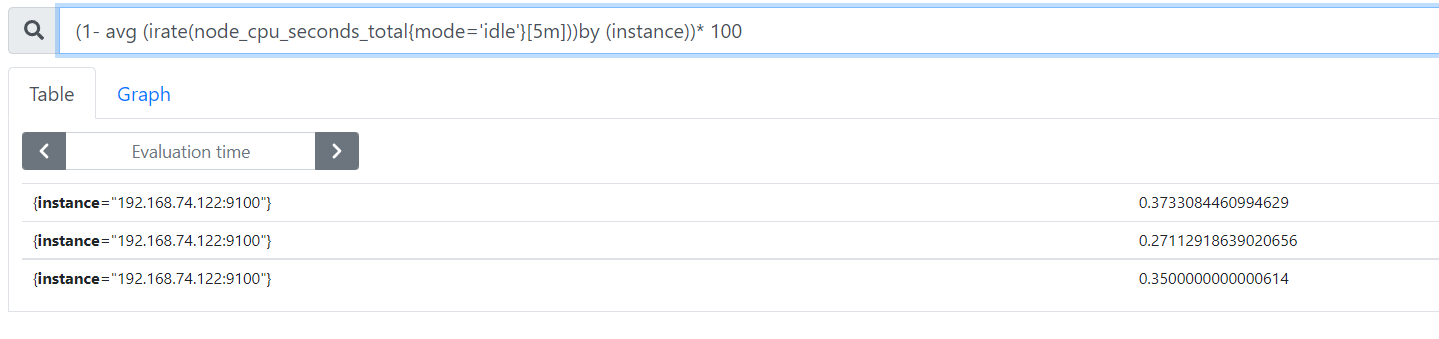
- Average CPU usage per host within 5 groups
(1- avg (irate(node_cpu_seconds_total{mode='idle'}[5m]))by (instance))* 100
Resolution:
avg: Average
avg (irate(node_cpu_seconds_total{mode = 'idle'} [5m]): it can be understood as the percentage of CPU idle
by (instance): indicates all nodes
(1- avg (irate(node_cpu_seconds_total{mode = 'idle'} [5m]) by (instance)) * 100: average CPU utilization in 5 minutes
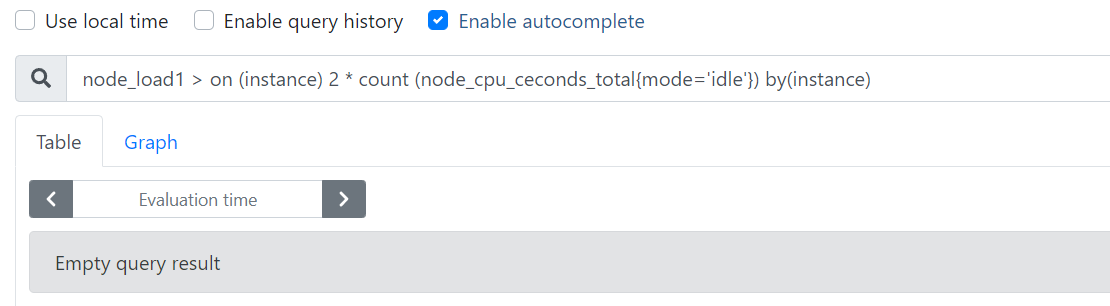
- Query the time series when the average load in one minute exceeds twice the number of host CPU s
node_load1 > on (instance) 2 * count (node_cpu_ceconds_total{mode='idle'}) by(instance)
2. Memory utilization
node_memory_MemTotal_bytes
node_memory_MemFree_bytes
node_memory_Buffers_bytes
node_memory_Cached_bytes
#Calculate usage
 Available space: the sum of the last three indicators above
 Used space: total space minus available space
 Usage: used space divided by total space
4, Service discovery
1. Prometheus service discovery
- ① File based service discovery:
Define a group of resource "child" configuration files in yaml format, which only stores the targets information that the party needs to collect. In this way, it can be dynamically obtained by pro without restart - ② DNS based service discovery:
SRV form - ③ API based service discovery:
Kubernetes, Consul, Azure, retag
target re marking
metric re marking - ④ K8S based service discovery
2. prometheus service discovery mechanism
- ① The data capture of Prometheus Server works in the Pull model. Therefore, it must know the location of each Target in advance before it can capture data from the corresponding Exporter or Instrumentation
- ② For a small system environment, the problem can be solved by specifying each Target through static_configurations, which is also the simplest configuration method. Each Target is identified by a network endpoint (ip:port);
- ③ For medium and large-scale system environments or cloud computing environments with strong dynamics, static configuration is obviously difficult to apply; therefore, Prometheus has specially designed a set of service discovery mechanisms to be based on the service registry (Service Bus) Automatically discover, detect and classify targets that can be monitored, and update the life cycle of Target indicator capture that has changed
- ④ During each scene_interval, Prometheus will check the executed jobs (jobs); these jobs will first generate a target list according to the discovery configuration specified on the Job, which is the service discovery process; service discovery will return a target list containing a group of labels called metadata, which are marked with "meta_" Is a prefix;
- ⑤ Service discovery will also set other tags with "prefix and suffix, b including" scheme "," address "and" metrics path_ ", according to the target configuration, The target supporting protocol (http or https, the default is http), the address of the target and the URI path of the index (the default is / metrics) are saved respectively;
- ⑥ If there are any parameters in the URI path, their prefix will be set to "parameter". These target lists and labels will be returned to Prometheus, and some of them can also be overwritten in the configuration;
- ⑦ The configuration tag will be reused in the captured life cycle to generate other tags. For example, the default value of the instance tag on the indicator comes from the value of the address tag;
- ⑧ Prometheus provides an opportunity to relabel the discovered targets. It is defined in the relabel_config configuration of the job configuration section and is commonly used to achieve the following functions
3. Static configuration discovery
#Modify the configuration file on the prometheus server to specify the port of targets, which has been configured above
vim prometheus.yml
  - job_name: 'nodes'
    static_configs:
    - targets:
      - 192.168.8.19:9100
      - 192.168.8.18:9100
      - 192.168.8.17:9100
4. Dynamic discovery
4.1 document based service discovery
- File based service discovery is only slightly better than statically configured service discovery. It does not depend on any platform or third-party services, so it is also the simplest and most common implementation.
- prometheus server regularly loads target information from the file (pro server pull indicator discovery mechanism - job_name obtains the object target I want to pull). The file can only use json and yaml formats, which contains the defined target list and optional label information
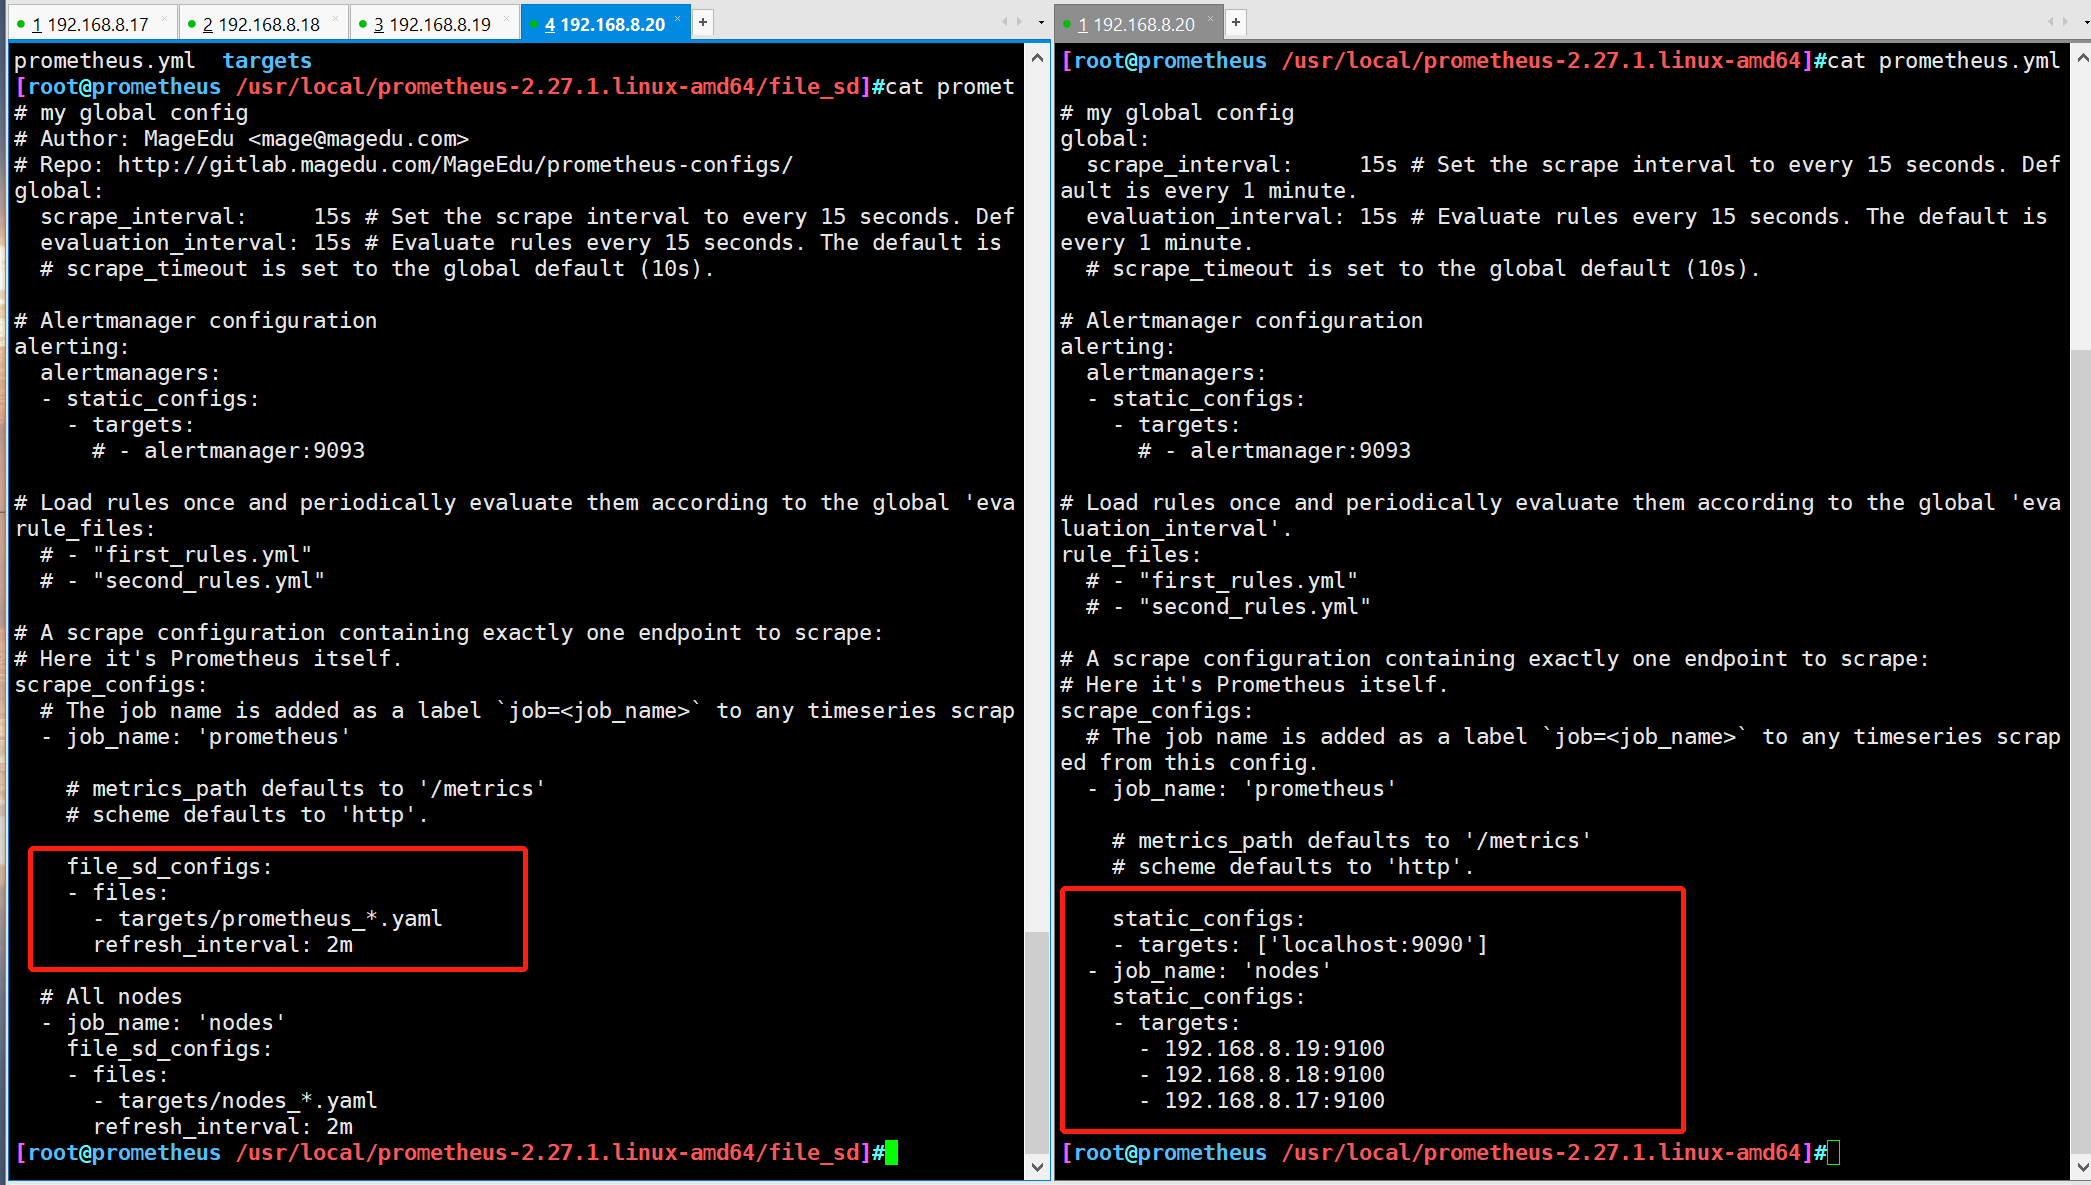
- The following first configuration can convert the default static configuration of prometheus into the configuration required for file based service discovery
(prometheus will periodically read and reload the configuration in this file to achieve dynamic discovery and update operations)
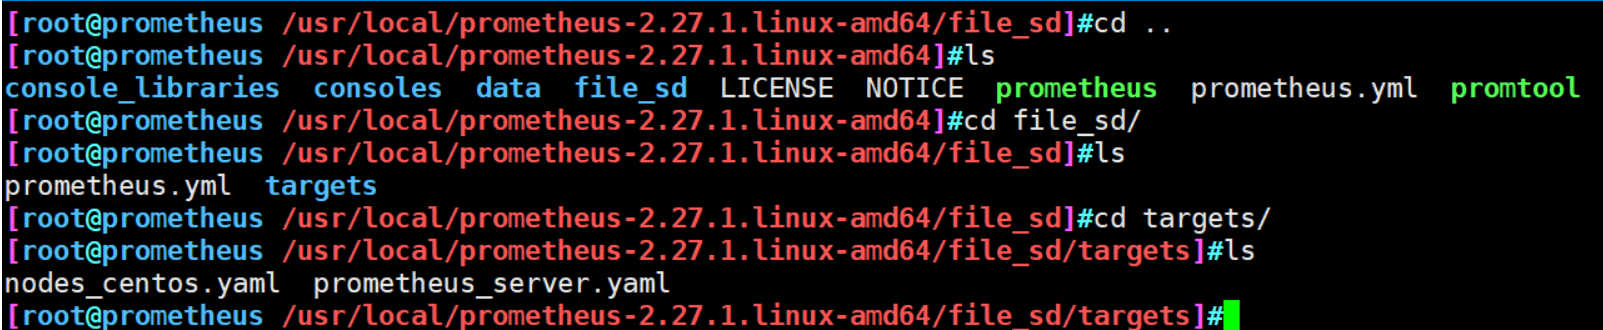
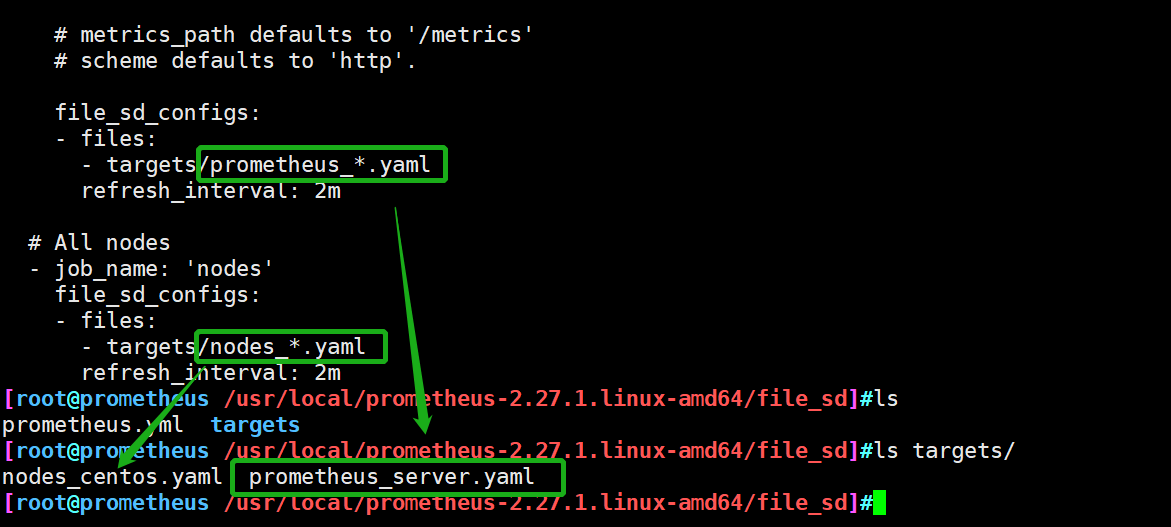
① Environmental preparation
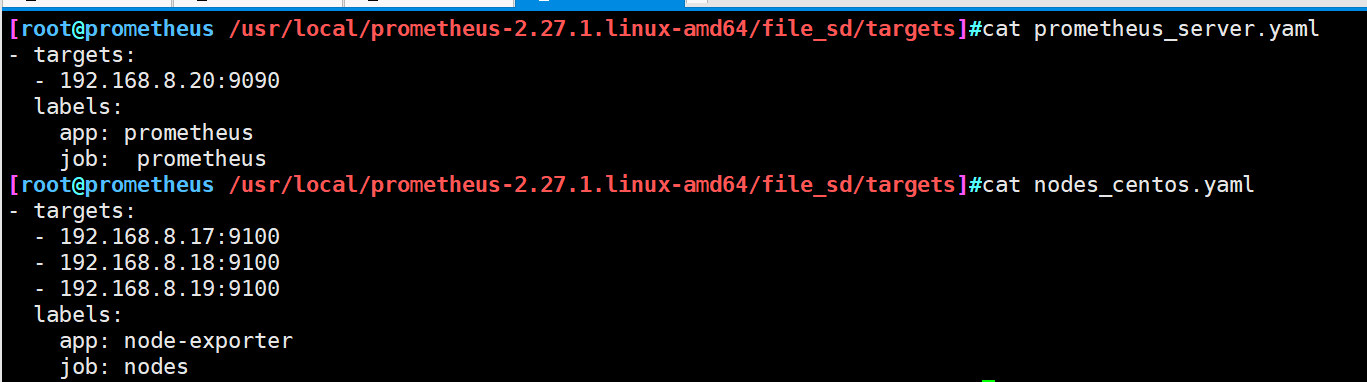
cd /usr/local/prometheus-2.27.1.linux-amd64/
mkdir file_sd
cd file_sd
mkdir targets
#Upload the modified Prometheus.yml to the file_sd directory
cd targets
#Upload nodes_centos.yaml and Prometheus_server.yaml to the targets directory
-
Matching file resolution
-
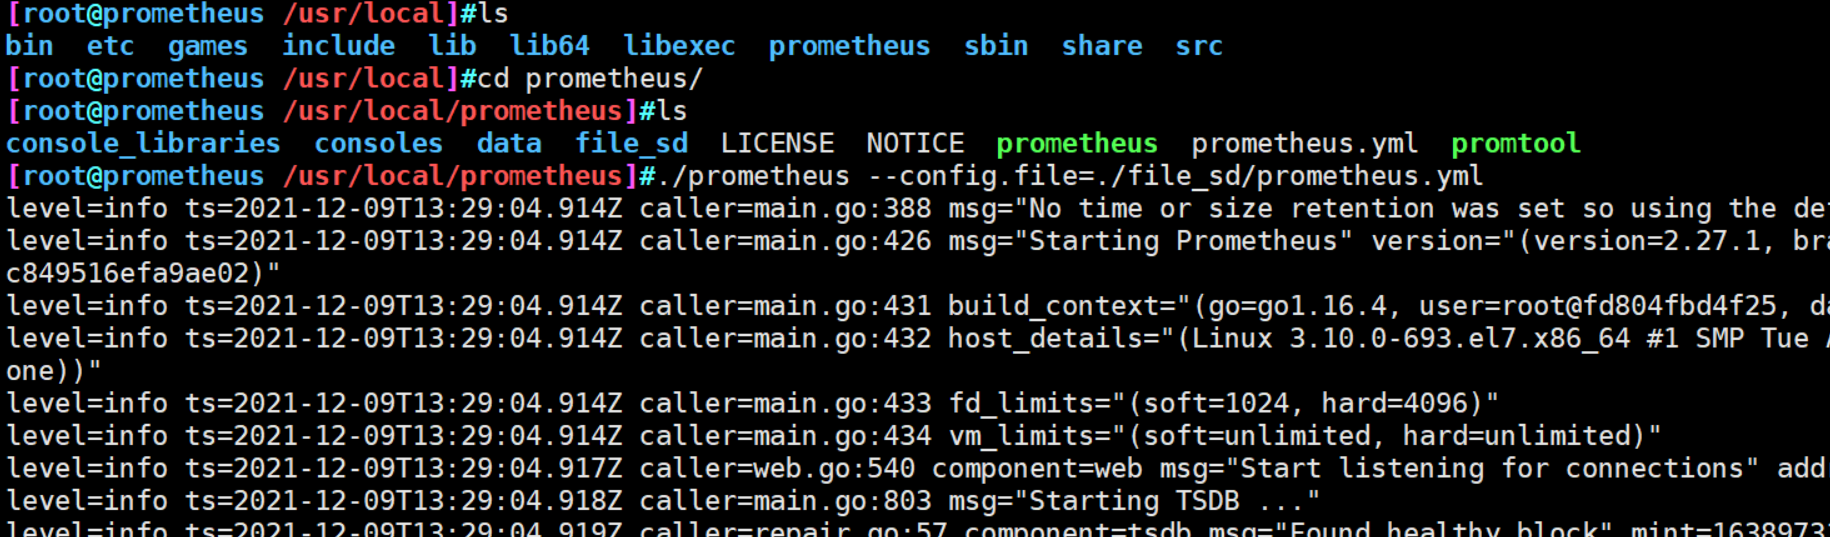
② Specify profile startup
./prometheus --config.file=./file_sd/prometheus.yml
③ Open three slave nodes
./node_exporter
④ Browser login view http://192.168.74.135:9090/targets
⑤ Restart a terminal, add a node information, and check whether the node information is added
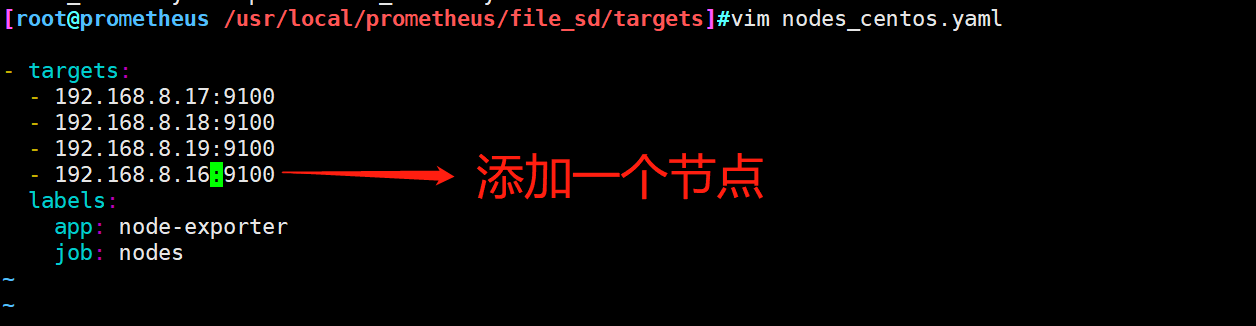
4.2 role of document discovery
If you add a node or Prometheus server node, you only need to change the nodes_centos.yaml prometheus_server.yaml two files add address on the line, do not need to stop the service
5. Automatic discovery based on DNS
- DNS based service discovery periodically queries a group of DNS domain names to find the target to be monitored. The DNS server used in the query is controlled by / etc / resolv Conf file assignment
- The discovery mechanism relies on A, AAAA and SRv resource records, and only supports this kind of method, but does not support the advanced DNS discovery method in RFC6763
Ps:
##SRV: SRv records are used to indicate the services provided under a domain name. example:
http._tcp.example.com.SRV 10 5 80. www.example.comSRv Meaning of the following items:
10-priority,similar MX record
5-weight
80-port
www.example.com -The host name of the actual service. meanwhile SRv You can specify which port corresponds to service
#Based on the SRv record in the Dws service, th prometheus finds that the corresponding port on the specified target corresponds to exporter or instrumentation
6. Discovery based on consumer
6.1 general
-
An open source tool developed based on golana, mainly for distributed and service-oriented systems, it provides the functions of service registration, service discovery and configuration management, and provides the functions of service registration / discovery, health check, Key/value storage, multi data center and distributed consistency assurance
-
Principle:
By defining the json file, the services that can be used for data collection are registered in the consumer for automatic discovery. At the same time, prametheus is used as the client to obtain the services registered on the consumer, so as to obtain data
6.2 deployment and installation
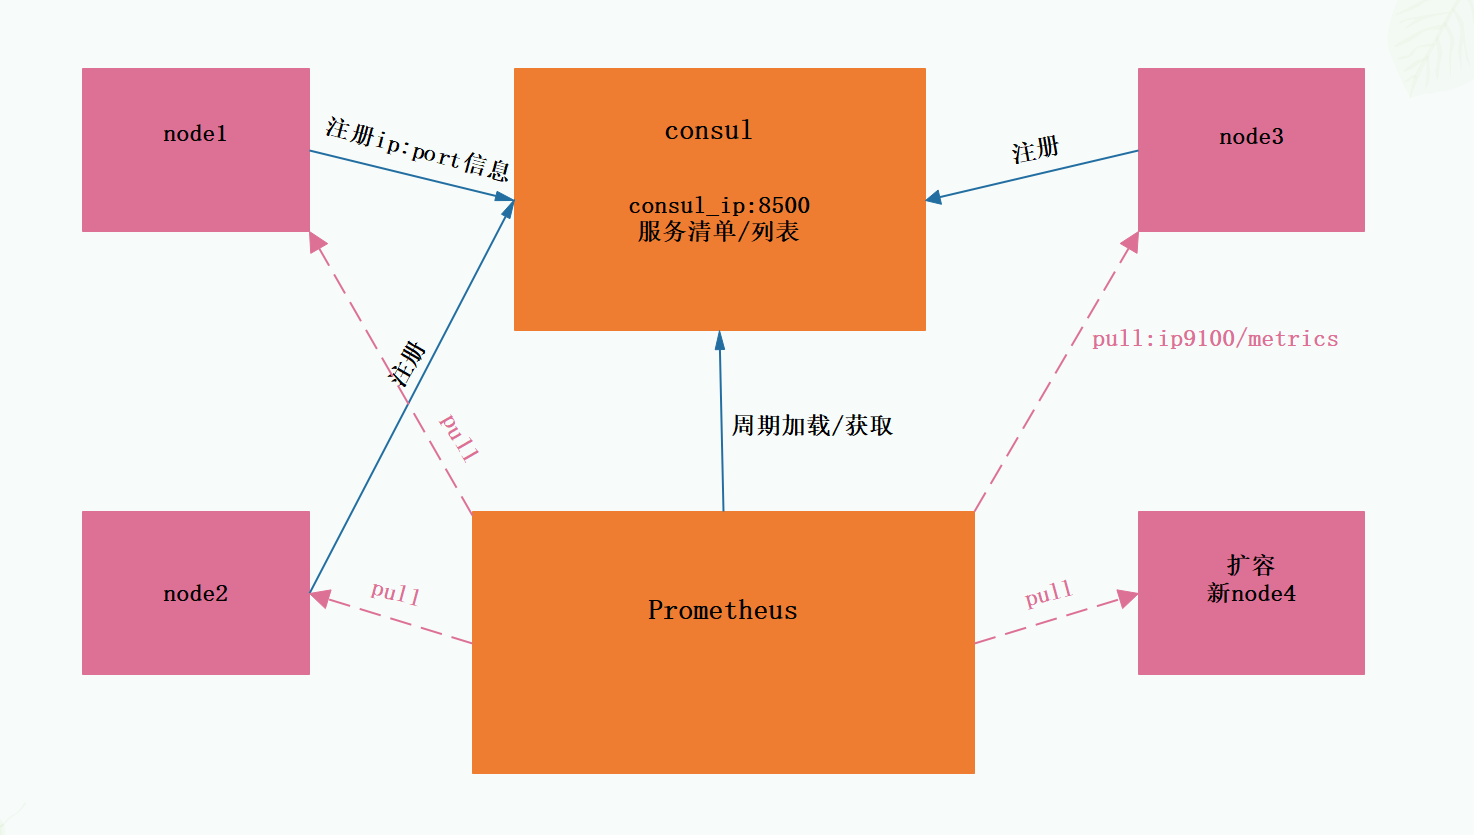
prometheus automatically discovers the host list configuration through consumer
Idea:
prometheus servers The JSON file contains its host information. The host information contains the corresponding tag tags: "prometheus". This configuration file is loaded by consumer and will be displayed on the 8500 port. prometheus also defines two job s in the yml file: "prometheus" and "nodes", which are associated with the location of consumer 192.168 At 74.135:8500, prometheus will regularly go to the consumer 8500 to find the node labeled prometheus. You can get the host information on the 8500. After finding it, you can go directly to http://192.168.74.135:9090/metrics Collect information on the ui and display it through the ui expression browser
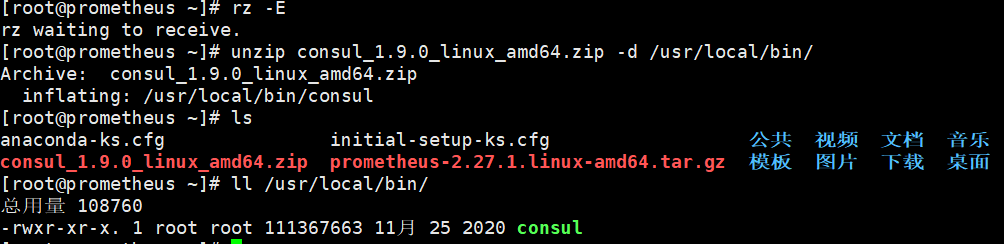
① Install consumer_ 1.9. 0 version
[root@prometheus ~]#wget http://101.34.22.188/consul/consul_1.9.0_linux_amd64.zip &> /dev/null
[root@prometheus ~]#ls
consul_1.9.0_linux_amd64.zip
[root@prometheus ~]#unzip consul_1.9.0_linux_amd64.zip -d /usr/local/bin/
Archive:  consul_1.9.0_linux_amd64.zip
  inflating: /usr/local/bin/consul
- ② Start developer mode
The consumer developer mode can quickly start a single node consumer service with complete functions to facilitate development and testing
[root@prometheus ~]#mkdir -pv /consul/data
mkdir: Directory created "/consul"
mkdir: Directory created "/consul/data"
[root@prometheus ~]#mkdir /etc/consul
[root@prometheus ~]#cd /etc/consul/
[root@prometheus /etc/consul]#consul agent -dev -ui -data-dir=/consul/data/ -config-dir=/etc/consul/ -client=0.0.0.0
......
#Parameter analysis
consul agent 		#Use agent to open
-dev    			#Developer mode
-ui 				#Enable ui interface
-data-dir 			#Location of data files
-config-dir 		#Configuration file location for consumer
-client 			#Listening clients are all
-③ Edit Prometheus servers. In the / etc / consumer directory JSON configuration file
[root@prometheus ~]#vim /etc/consul/prometheus-servers.json

{
  "services": [
    {
      "id": "prometheus-server-node01",
      "name": "prom-server-node01",
      "address": "192.168.74.135",
      "port": 9090,
      "tags": ["prometheus"],
      "checks": [{
        "http": "http://192.168.74.135:9090/metrics",
        "interval": "5s"
      }]
    }
  ]
}

[root@prometheus ~]#consul reload
Configuration reload triggered
[root@prometheus ~]#netstat -antp |grep consul
tcp        0      0 127.0.0.1:8300          0.0.0.0:*               LISTEN      64781/consul
tcp        0      0 127.0.0.1:8301          0.0.0.0:*               LISTEN      64781/consul
tcp        0      0 127.0.0.1:8302          0.0.0.0:*               LISTEN      64781/consul
tcp        0      0 127.0.0.1:45987         127.0.0.1:8300          ESTABLISHED 64781/consul
tcp        0      0 127.0.0.1:8300          127.0.0.1:45987         ESTABLISHED 64781/consul
tcp6       0      0 :::8600                 :::*                    LISTEN      64781/consul
tcp6       0      0 :::8500                 :::*                    LISTEN      64781/consul
tcp6       0      0 :::8502                 :::*                    LISTEN      64781/consul
- ④ Terminate the Prometheus service first and modify the configuration file
[root@prometheus ~]#ps aux|grep prometheus
root 63526 0.3 2.4 1114924 94196 pts/1 Sl+ 12:10 0:22 ./prometheus --config.file=./file_sd/prometheus.yml
root 64823 0.0 0.0 112728 976 pts/2 S+ 14:04 0:00 grep --color=auto prometheus
[root@prometheus ~]#kill -9 63526
[root@prometheus ~]#ps aux|grep prometheus
root 64826 0.0 0.0 112728 976 pts/2 S+ 14:04 0:00 grep --color=auto prometheus
[root@prometheus ~]#cd /usr/local/prometheus-2.27.1.linux-amd64/
[root@prometheus /usr/local/prometheus-2.27.1.linux-amd64]#mkdir consul_sd
[root@prometheus /usr/local/prometheus-2.27.1.linux-amd64]#ls
console_libraries consoles consul_sd data file_sd LICENSE nohup.out NOTICE prometheus prometheus.yml promtool
[root@prometheus /usr/local/prometheus-2.27.1.linux-amd64]#cd consul_sd/
[root@prometheus /usr/local/prometheus-2.27.1.linux-amd64/consul_sd]#wget http://101.34.22.188/consul/prometheus/prometheus.yml
[root@prometheus /usr/local/prometheus-2.27.1.linux-amd64/consul_sd]#cat prometheus.yml
# my global config
# Author: MageEdu <mage@magedu.com>
# Repo: http://gitlab.magedu.com/MageEdu/prometheus-configs/
global:
scrape_interval: 15s # Set the scrape interval to every 15 seconds. Default is every 1 minute.
evaluation_interval: 15s # Evaluate rules every 15 seconds. The default is every 1 minute.
# scrape_timeout is set to the global default (10s).
# Alertmanager configuration
alerting:
alertmanagers:
- static_configs:
- targets:
# - alertmanager:9093
# Load rules once and periodically evaluate them according to the global 'evaluation_interval'.
rule_files:
# - "first_rules.yml"
# - "second_rules.yml"
# A scrape configuration containing exactly one endpoint to scrape:
# Here it's Prometheus itself.
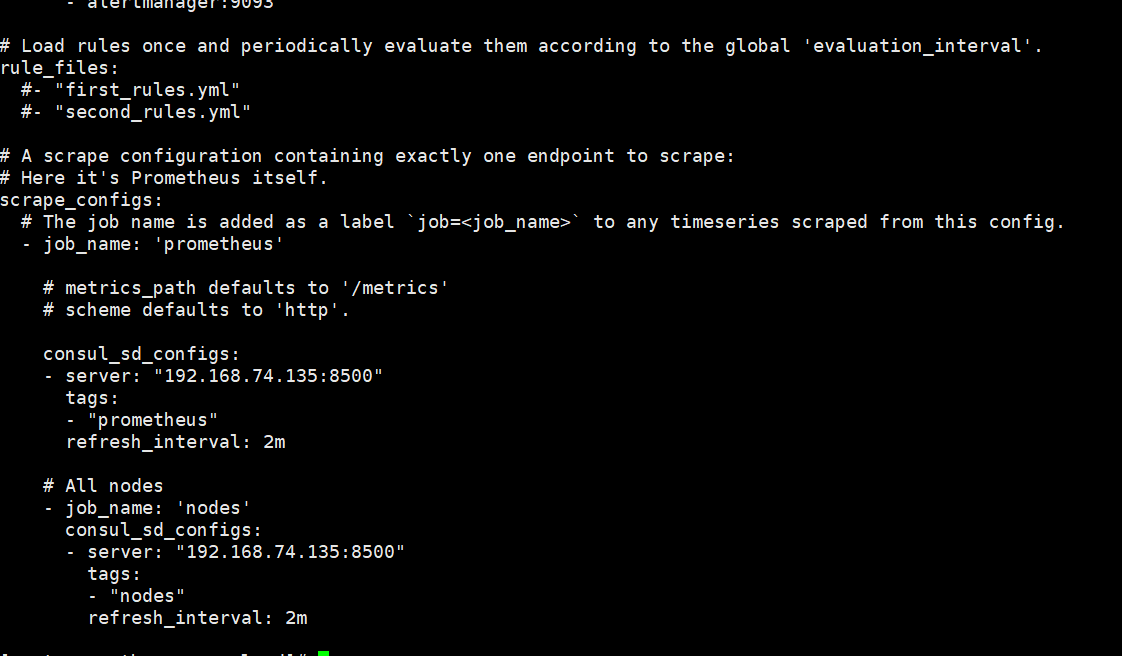
scrape_configs:
# The job name is added as a label `job=<job_name>` to any timeseries scraped from this config.
- job_name: 'prometheus'
# metrics_path defaults to '/metrics'
# scheme defaults to 'http'.
consul_sd_configs:
- server: "192.168.10.20:8500"
tags:
- "prometheus"
refresh_interval: 2m
# All nodes
- job_name: 'nodes'
consul_sd_configs:
- server: "192.168.10.20:8500"
tags:
- "nodes"
refresh_interval: 2m
#Pay attention to modifying the IP address
#Specify the location of the configuration file and run Prometheus. You can nohup& Background operation
[root@prometheus /usr/local/prometheus-2.27.1.linux-amd64]#./prometheus --config.file=./consul_sd/prometheus.yml
......
- ⑤ Access with browser http://192.168.8.20:8500 Check whether the node is joined
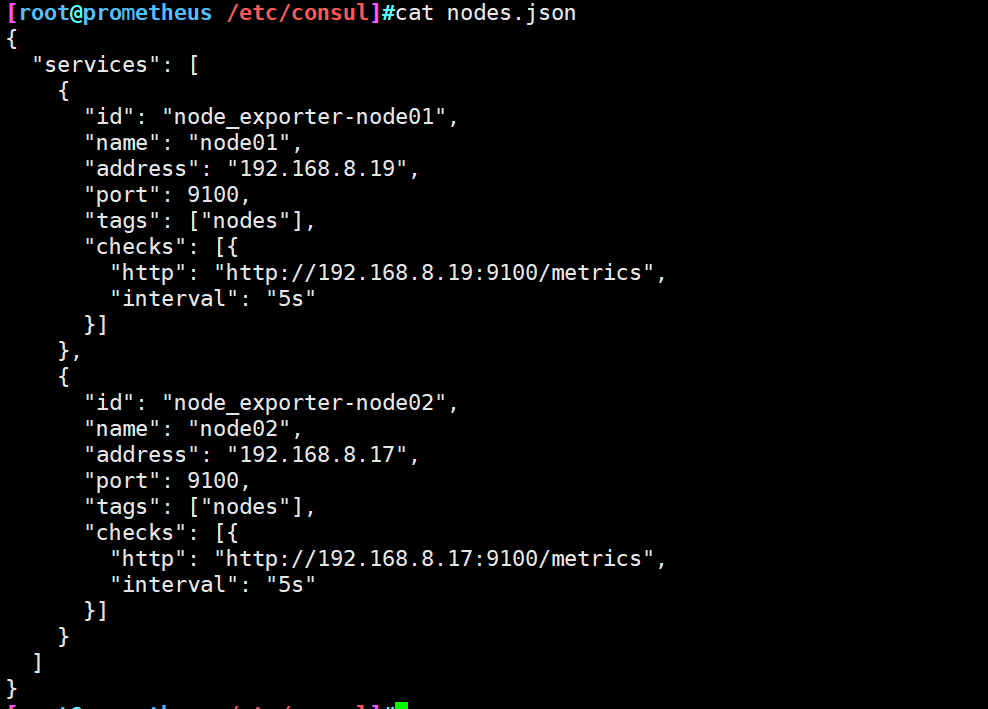
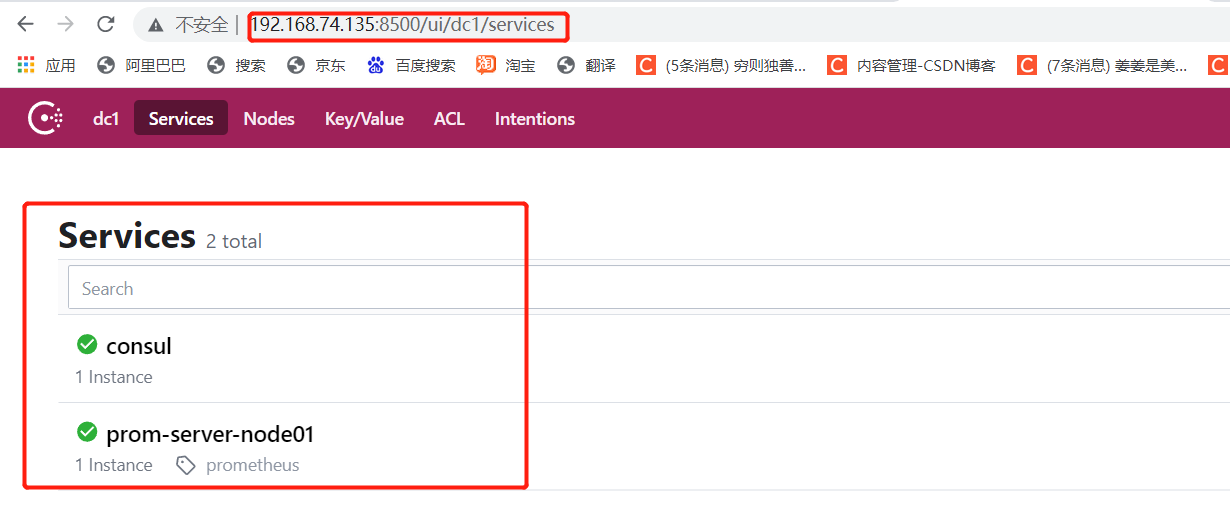
[root@prometheus /etc/consul]#wget http://101.34.22.188/consul/prometheus/nodes.json
......
[root@prometheus /etc/consul]#cat nodes.json
{
  "services": [
    {
      "id": "node_exporter-node01",
      "name": "node01",
      "address": "192.168.74.131",
      "port": 9100,
      "tags": ["nodes"],
      "checks": [{
        "http": "http://192.168.74.131:9100/metrics",
        "interval": "5s"
      }]
    },
    {
      "id": "node_exporter-node02",
      "name": "node02",
      "address": "192.168.74.122",
      "port": 9100,
      "tags": ["nodes"],
      "checks": [{
        "http": "http://192.168.74.122:9100/metrics",
        "interval": "5s"
      }]
    }
  ]
}

[root@prometheus /etc/consul]#consul reload
Configuration reload triggered
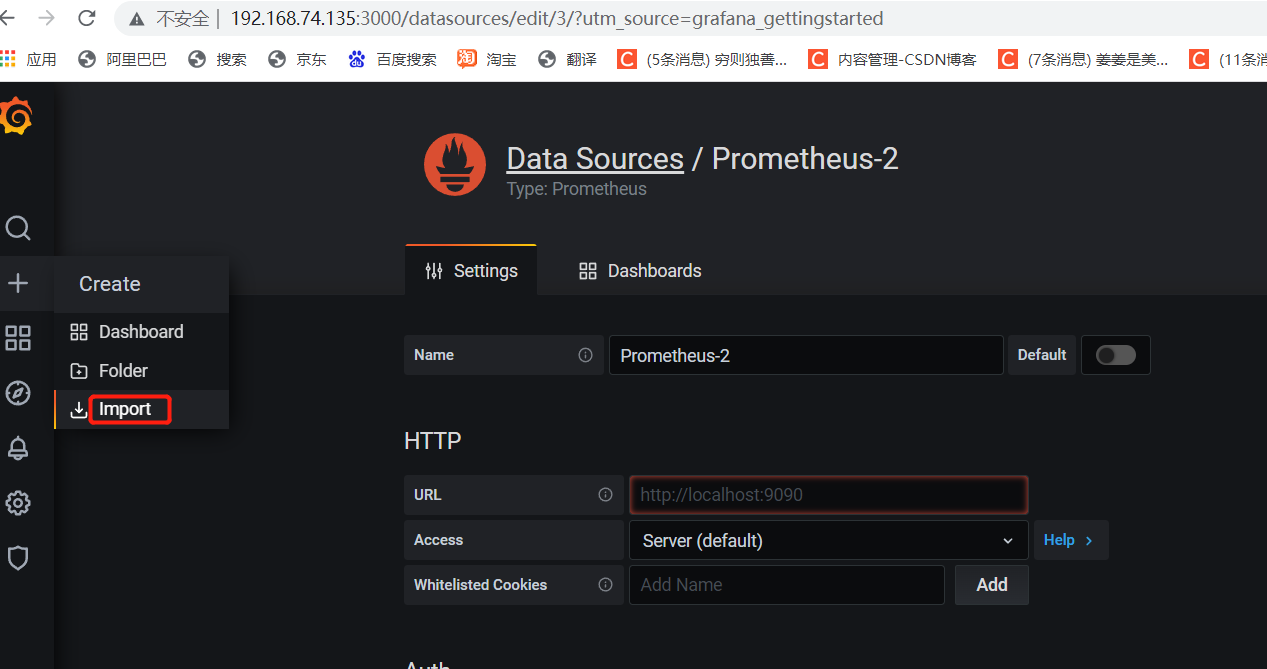
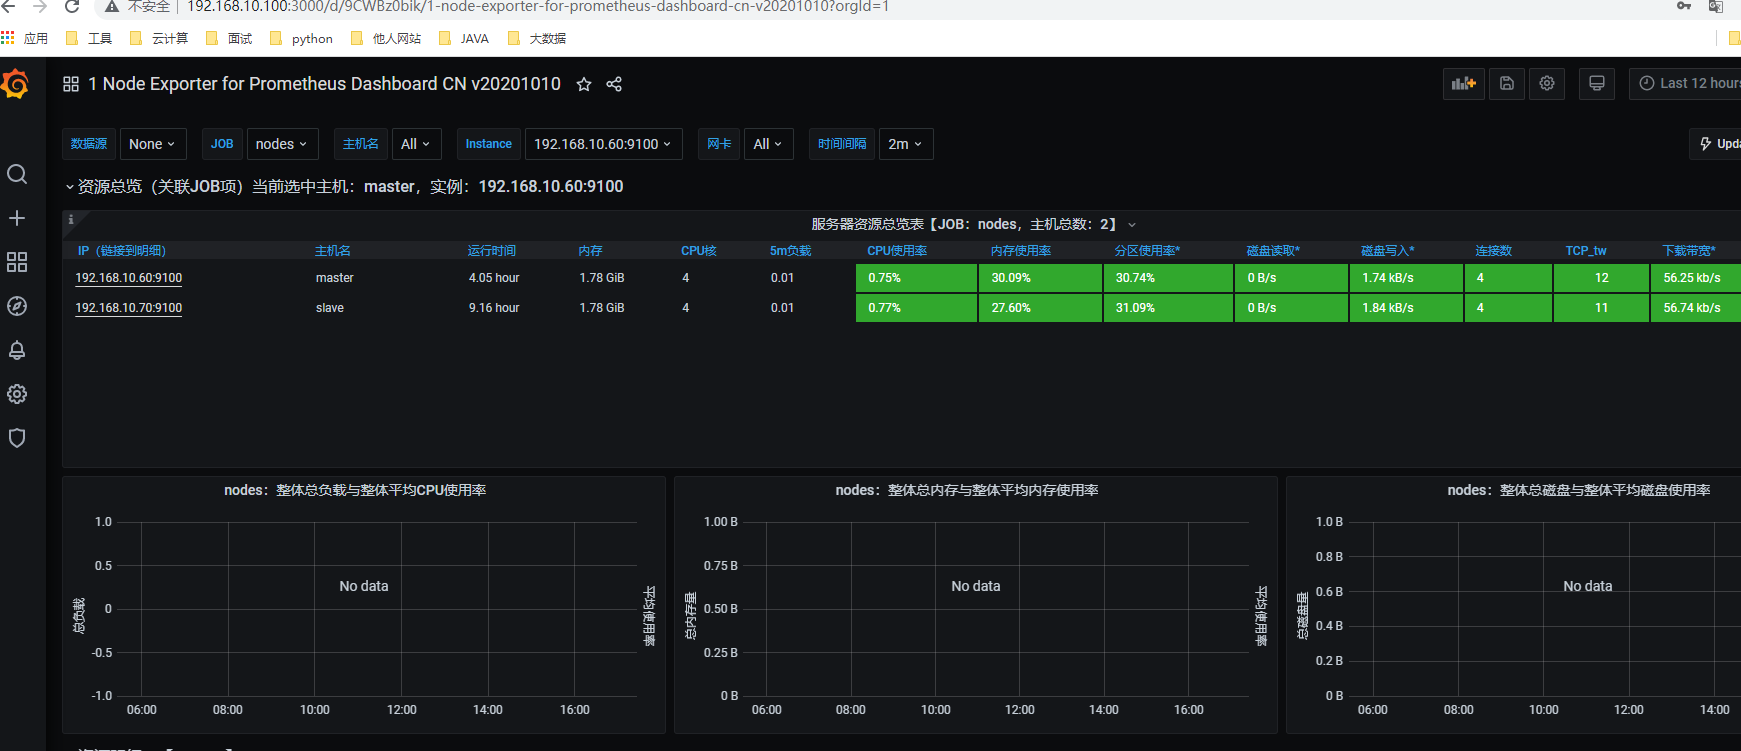
7.Grafana deployment and template display
7.1Grafana overview
-
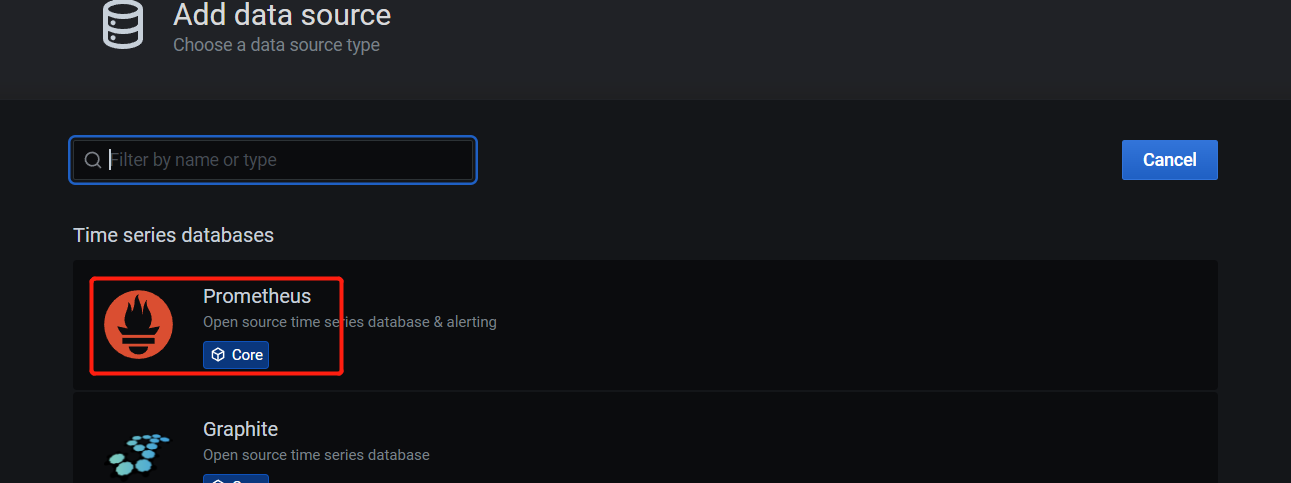
grafana is a general visualization tool developed based on go language. It supports loading and displaying data from different data sources. It can be used as part of its data source. The storage system is as follows:
① TSDB: Prometheus, InfluxDB, OpenTSDB and graph
② Log and document storage: Loki and Elasticsearch
③ Distributed request tracking: Zipkin, Jaeger, and Tenpo
④ SQLDB: MySQL, PostgreSQL and Microsoft SQL Server -
grafana foundation listens to port 3000 of TCP protocol by default, supports the integration of other authentication services, and can output built-in indicators through / metrics
Supported presentation methods:
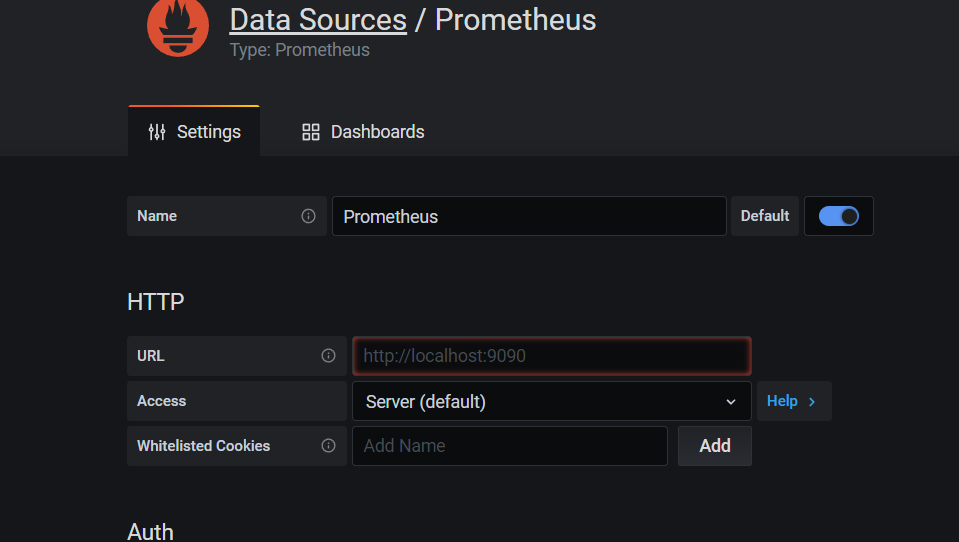
① Data Source: provides a storage system for displaying data
② Dashboard: a visual panel for organizing and managing data
③ Team and users: provide management capability for enterprise organization level
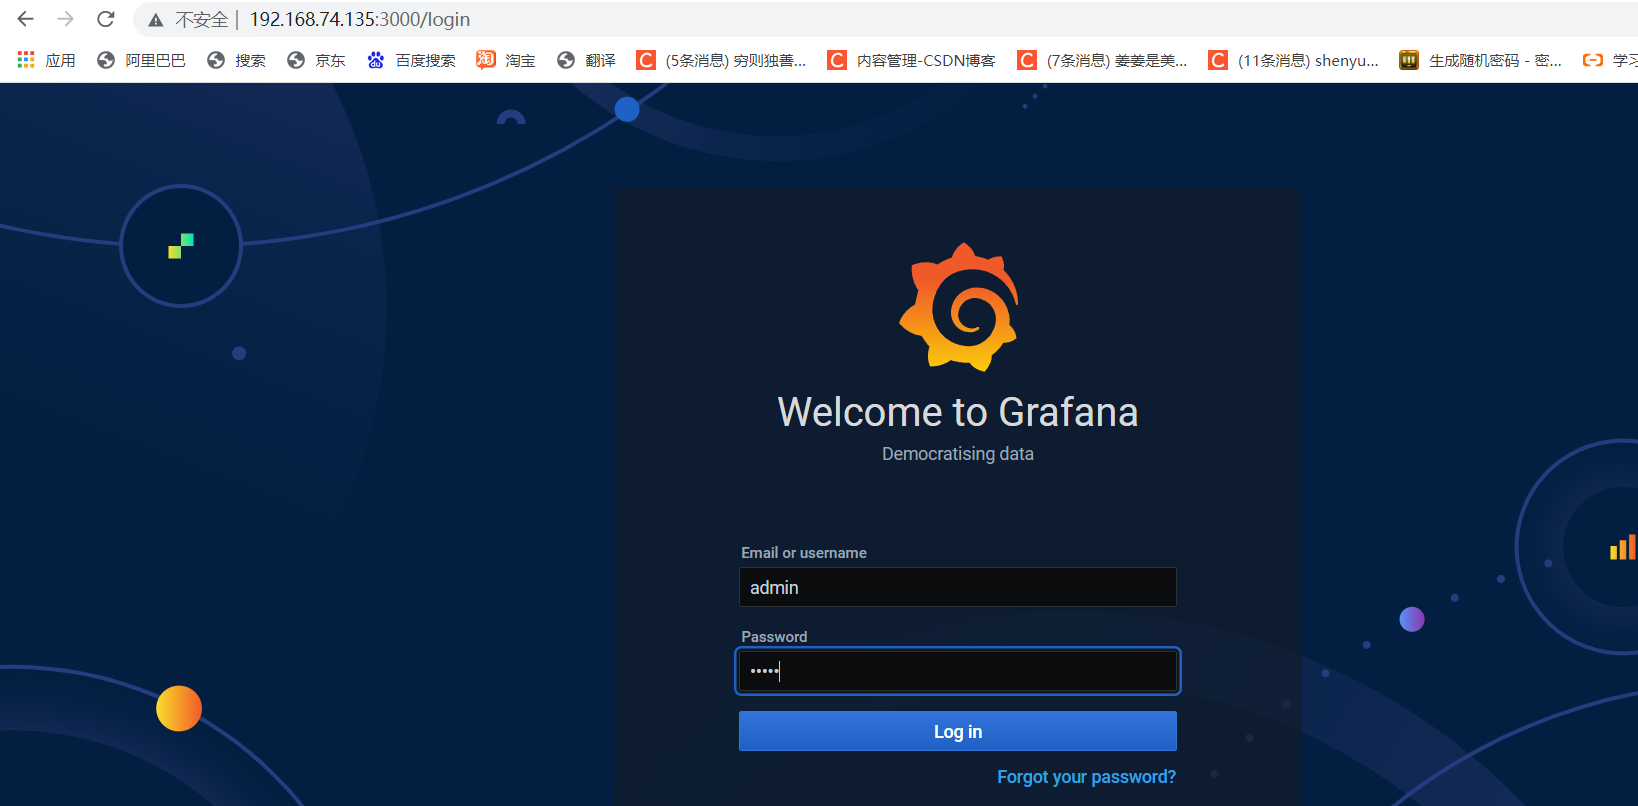
7.2 installation
wget http://101.34.22.188/grafana/grafana-7.3.6-1.x86_64.rpm
yum install -y grafana-7.3.6-1.x86_64.rpm
systemctl enable grafana-server	&& systemctl start grafana-server
netstat -nuptl|grep 3000
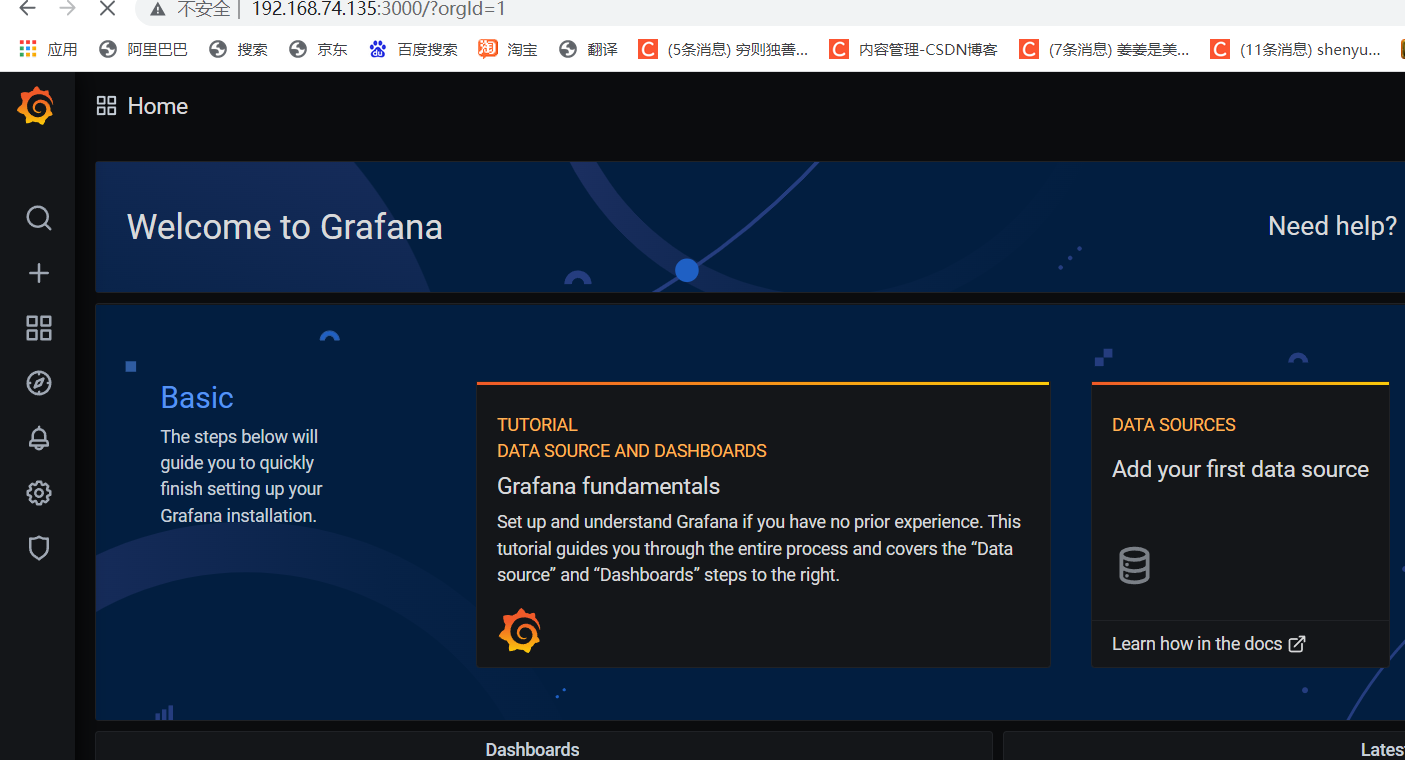
Browser access http://IP:3000 , default account password: admin admin