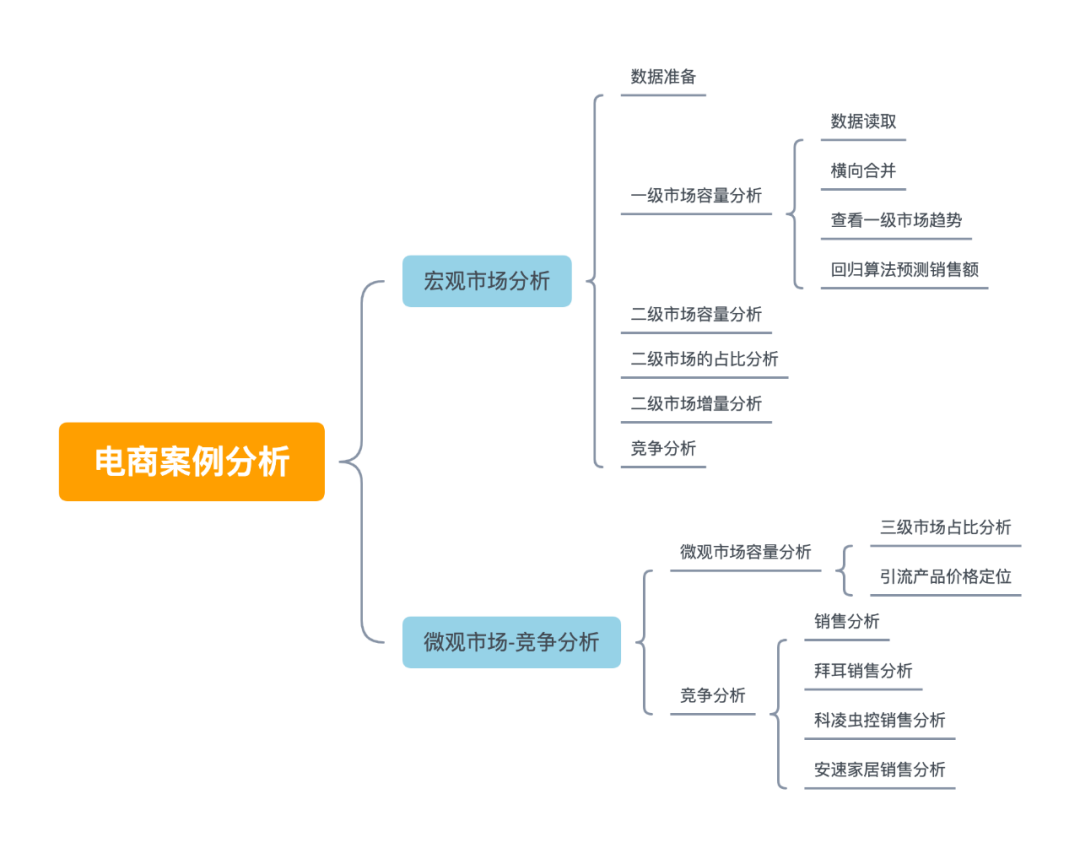
Introduction: today I will bring you an e-commerce data analysis case. I sorted it out and shared it with you in the form of notes. The background of the case is that the overall sales of an e-commerce have been rising for several consecutive years, but the growth rate has slowed down in recent years. It is necessary to find effective growth points to improve market competitiveness. The article is long, it is recommended to collect ~
img
Fundamentals of e-commerce analysis
Before the official start, we have prepared some common basic e-commerce analysis basic knowledge for you. Xiaobai is friendly to data analysis. The e-commerce analysis leaders can check it as appropriate. If there is anything bad written, we hope the leaders can correct it and make common progress!
Refer to self-knowledge here: e-commerce data analysis index [1]
E-commerce analysis index
1, Flow index
Page views (PV): the total number of pages visited by users.
Number of visitors (UV): independent visitors. One computer is an independent number of visitors. It can be divided into new visit users and return visit users.
Current number of people online: refers to the number of UV s online within 15 minutes.
Average online time: refers to the average length of time each UV visits a web page. Dwell time = the time when the visitor opens the first page of the website – the time when the last page of the website is opened.
Average visits: the average number of pages viewed by users each time.
Average daily flow: average daily flow.
Jump out rate: the number of visits left after browsing only one page divided by the total number of visits to the page. It is divided into: home page jump out rate, key page jump out rate, specific product page jump out rate, etc. This indicator can reflect the popularity of a page content. If the jump out rate is high, it indicates that the page needs to be adjusted and optimized. The high jump out rate is not terrible. The terrible thing is that you don't know the reason why users jump out.
2, Transformation index
With traffic, we want users to act according to the designed requirements, such as registering, collecting, placing orders, paying, participating in our marketing activities, etc. These actions are transformation.
Conversion rate: refers to the proportion of visits with related actions in the total visits. Conversion rate is the core indicator of e-commerce operation and the indicator used to judge the marketing effect.
Registration conversion rate: number of registered users / number of new users.
Customer service conversion rate: number of users consulting customer service personnel / total number of visits.
Collection conversion rate: the number of users who add the product to the collection or follow / the total number of visits to the product.
Add conversion rate: the number of users who added the product to the shopping cart / the total number of visits to the product.
Transaction conversion rate: number of transaction users / total visits. The transaction conversion rate can be subdivided into channel conversion rate, event conversion rate, brand conversion rate, etc.
3, Operational indicators
Transaction indicators: transaction amount, transaction quantity and transaction users
Order indicators: order amount, order quantity, order users, valid orders and invalid orders
Return indicators: return amount, return quantity, number of return users, amount return rate, quantity return rate, and order return rate
Efficiency indicators: customer unit price, piece unit price, joint rate and dynamic sales rate
Purchase indicator: purchase amount and purchase quantity
Inventory indicators: inventory amount, inventory quantity, inventory days, inventory turnover rate and sold out rate
Supply chain indicators: delivery amount, delivery quantity, order fulfillment rate, order response time and average delivery time
4, Membership indicators
There are some differences in the concept of membership between traditional retail and e-commerce. In the traditional retail industry, users need to spend a certain amount of money to be eligible to become members, so the members of traditional retail must be customers. In e-commerce, ordinary users become members as long as they register successfully. The second is the difference of timeliness. Most traditional retail member management has invalid provisions, that is, if members cannot consume a certain amount within a certain period of time, they will lose their membership. Members of e-commerce have no such restrictions, but set different levels for users with different consumption amounts.
Number of registered members: refers to the total number of members who have registered on the website. Generally speaking, this definition does not make much sense, because there are users who only register and do not buy and users who have bought things but have not used them for a long time. Therefore, it is more accurate to define this indicator as members with purchase records in a year.
Number of active members: refers to the total number of members who have consumed or logged in within a period of time.
Active member ratio: the proportion of active members in the total number of members.
Member repurchase rate: refers to the number of members who have purchased for the second time or more in a certain period, accounting for the total number of members who have purchased.
Number of tie purchases: the average number of purchases per member in a certain period.
Member repurchase rate: refers to the rate of active members who have purchased in the next period at the end of the previous period.
Member retention rate: the percentage of members who have logged in or consumed in a specific time period at a time node. E-commerce generally uses consumption data, while games and social fields use login data.
5, Financial indicators
New customer cost: if the company spent 1 million to obtain 10000 new customers, the new customer cost is 100 yuan / person. The new customer cost is generally calculated according to the channel, which can also distinguish different channel quality.
Single person cost: marketing cost / number of visitors. Visitors here do not distinguish whether they are new visitors, whether they buy, whether they register, etc.
Single order cost: marketing cost / number of orders generated
Cost to sales ratio: marketing cost / order amount. Its reciprocal is ROI.
What are the core indicators
For companies in different industries, different natures and different stages, the indicators concerned are also different, so the so-called core indicators are not invariable.
For a new e-commerce, it is most important to accumulate data and find the correct operation direction. Therefore, the most concerned indicator at this stage is the traffic indicator, including: number of visitors, source of visitors, number of registered users, browsing volume, browsing depth, product browsing ranking, product jump out rate, customer evaluation index, etc.
For e-commerce that has been operating for some time, improving sales through data analysis has become the most important goal. The most concerned indicators at this stage mainly include traffic and sales indicators: number of visitors, number of views, conversion rate, number of new members, member turnover rate, customer unit price, dynamic sales rate, inventory days, ROI, sales, etc.
For e-commerce with a certain scale, it is crucial to use data to improve the overall operation level. Their key indicators are the number of visitors, views, conversion rate, repurchase rate, turnover rate, retention rate, customer unit price, profit margin, ROI, new customer cost, inventory days, order satisfaction rate, sales, etc.
E-commerce case analysis
Let's move on to the topic of today's case study.
General idea
1. Understand the current situation of the industry and the company
-
Industry status and trends, such as what businesses are involved
-
Company's position in the market
2. Communicate clear needs
-
Brainstorm and tap needs or bottlenecks
-
Many times of communication, the most valuable analysis
3. Finally, it is verified with data
Import related modules
import numpy as np
import pandas as pd
import matplotlib.pyplot as plt
import seaborn as sns
import datetime
sns.set()
pd.set_option('float_format', lambda x: '%.2f' % x)

#Display Chinese
plt.rcParams['font.family'] = ['Arial Unicode MS']
plt.rcParams['axes.unicode_minus']=False
Macro market analysis
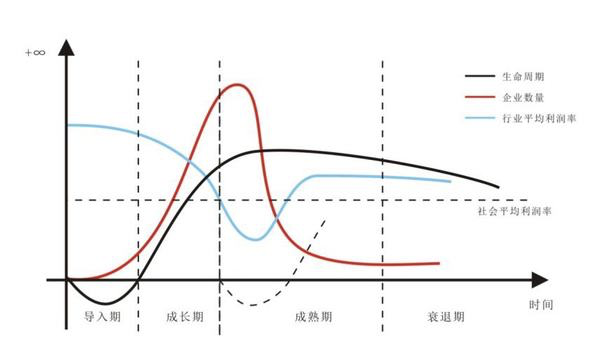
Product life cycle (PLC for short) is the market life of a product, that is, the whole process from a new product entering the market to being eliminated by the market.
Feinong believes that product life refers to the marketing life in the market. Like human life, products have to go through the cycle of formation, growth, maturity and recession. As far as the product is concerned, it is going through a stage of start, growth, maturity and decline.
Pictures from the Internet
1. Initial period
The scale of the enterprise may be very small. There are different views on how the enterprises in the industry develop, and the product type, characteristics, performance and target market are constantly developing and changing. The market is full of various newly invented products or services, and the management adopts strategies to support the listing of products. The product design is not yet mature, the development of industrial products is relatively slow, the profit margin is low, and the market growth rate is high.
Strategy: track opponents, participate or wait and see.
2. Growth period
The industry has been formed and developed rapidly, and most enterprises continue to exist in the industry due to high growth rate. Management needs to ensure that production is fully expanded to achieve the target market share. It needs a lot of funds to achieve high growth rate and production expansion plan, and there is a shortage of cash. Use patents or reduce costs to set entry barriers (internal economies of scale) to prevent competitors from entering the industry.
Strategy: increase investment, increase market share and prevent new entrants.
3. Maturity
The growth rate has dropped to a more normal level and is relatively stable. The sales volume change and profit growth of each year are small, and the competition is more intense. In the later stage, some enterprises quit the industry due to dissatisfaction with the return on investment. A small number of enterprises dominate the industry and need to monitor potential merger opportunities (beer industry), explore new markets (export of Chinese tractors), develop new technologies and develop new products with different characteristics and functions. Strategic management is crucial
Strategy: improve efficiency, cost control, enter and control market segmentation. Merger and expansion, research and development of new products.
4. Recession period
The industry has excess productivity, the market is flooded with substitutes after the technology is imitated, the market growth rate decreases seriously, the variety of products decreases, and the level of industry activity decreases with the withdrawal of companies from the industry. The industry may no longer exist or be incorporated into another industry. The existence period of the industry is longer than any single product. It is important to make full use of strategic management
Strategy: exit in time.
Data preparation
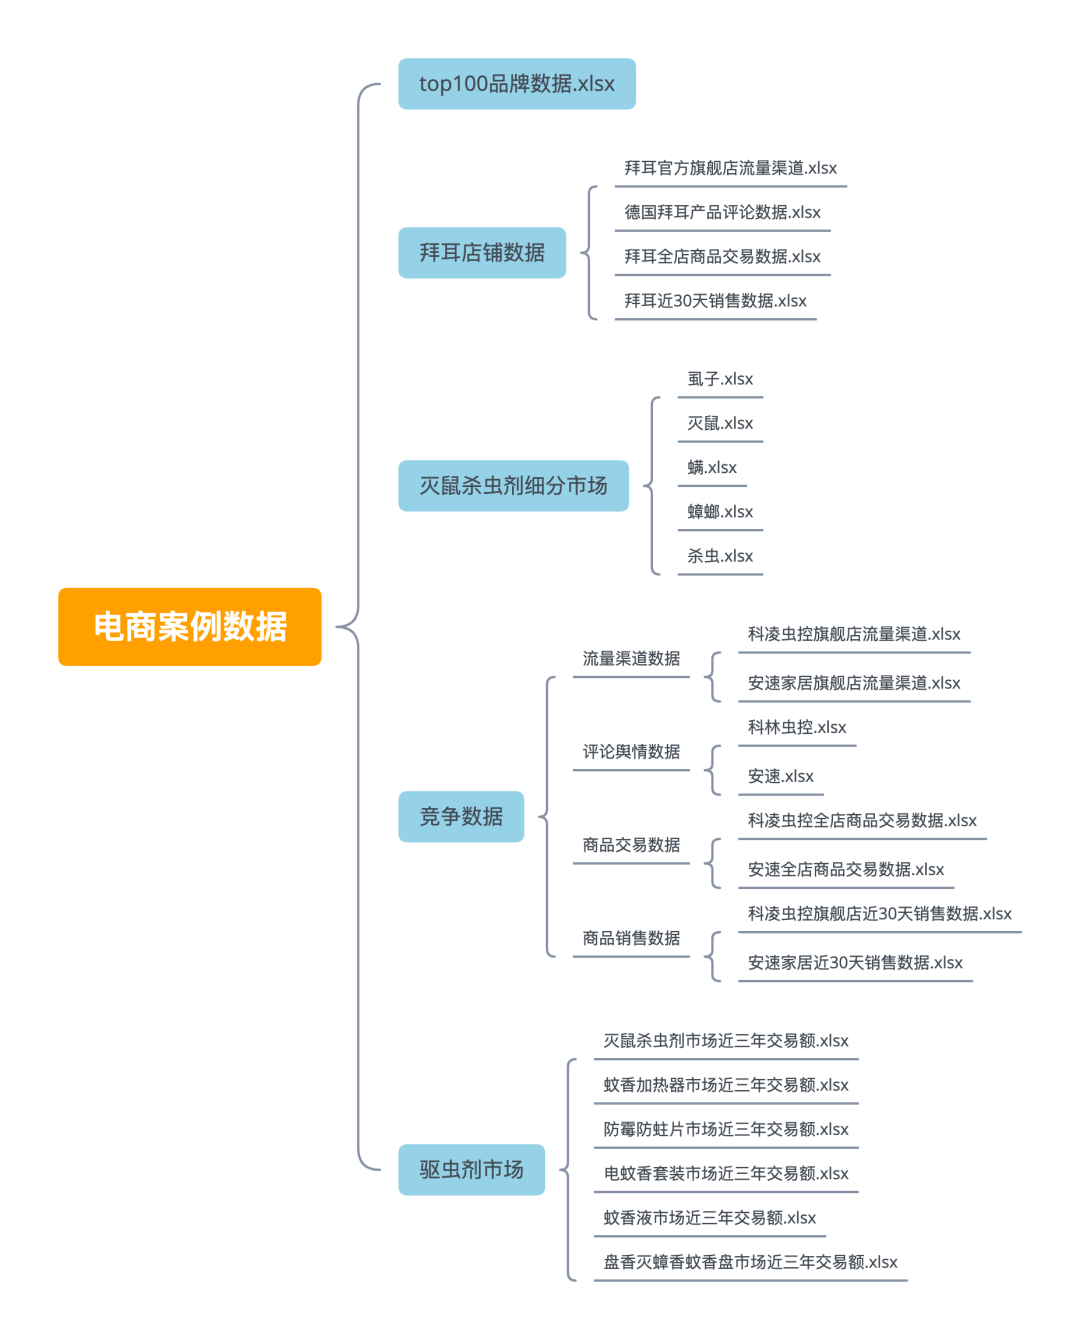
There is a large amount of data in this case, which will be displayed in the way of mind mapping according to classification. If you need data, you can contact the original author Yun Duojun to obtain it. Note that the data can only be used for communication and learning, not for commercial purposes. Thank you for your cooperation and understanding!
img
Primary market capacity analysis
data fetch
wxtz=pd.read_excel('./baier/E-commerce case data/Insect repellent market/Trading volume of electric mosquito repellent incense set market in recent three years.xlsx')
ff=pd.read_excel('./baier/E-commerce case data/Insect repellent market/Trading volume of mould proof and mothproof film market in recent three years.xlsx')
mssc=pd.read_excel('./baier/E-commerce case data/Insect repellent market/Transaction volume of rodenticide market in recent three years.xlsx')
wx=pd.read_excel('./baier/E-commerce case data/Insect repellent market/Trading volume of Pan Xiang cockroach killing mosquito repellent incense market in recent three years.xlsx')
jrp=pd.read_excel('./baier/E-commerce case data/Insect repellent market/Transaction volume of mosquito repellent incense heater market in recent three years.xlsx')
wxp=pd.read_excel('./baier/E-commerce case data/Insect repellent market/Transaction volume of mosquito repellent incense market in recent three years.xlsx')
wxy=pd.read_excel('./baier/E-commerce case data/Insect repellent market/Transaction volume of mosquito repellent incense liquid market in recent three years.xlsx')
Horizontal merge
The transaction volume from the secondary market to the market is summarized by month to form the primary market to transaction data, which is used to analyze the trend of the whole primary market (macro market) to market capacity
table = wxy
for i in [wxp,wxtz,ff,mssc,wx,jrp]:
    table = pd.merge(table,i,how='inner',on='time')
table.columns=['time','Electric mosquito repellent incense set','Mould proof and moth proof tablet','Rodenticide','Pan Xiang cockroach killing incense mosquito repellent incense pan','Mosquito repellent incense heater','Mosquito repellent incense tablets','Mosquito repellent incense liquid']
table.head()

img
View primary market trends
Generally, various summary analysis should be carried out according to the time dimension for subsequent analysis. It is best to set the time field as the index of the table.
table.set_index('time',inplace=True)
table['Total sales in primary market']=table.sum(axis=1)
table.head()
# table. Total sales in primary market plot()

img
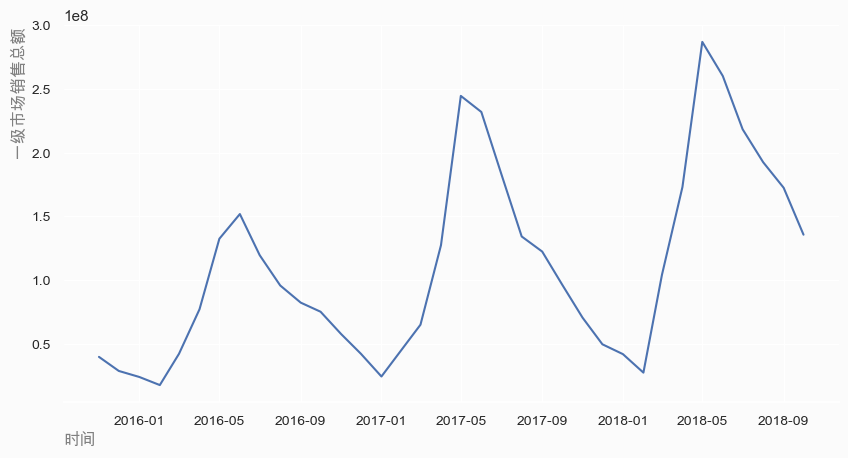
Take the time index as the horizontal axis and the total sales of the primary market as the vertical axis, draw a line chart to view the sales trend of the primary market. As can be seen from the figure, the trend of total sales is cyclical.
img
Forecast sales by regression algorithm
Here are two points to note:
-
Generally, it is required to analyze the macro market capacity for 5 years.
-
It is found that the annual data is irregular, missing in November and December 2018, and only in November and December 2015.
-
Next, we use regression to make a simple prediction on the data of November and December of 18 years.
First, forecast the sales in November 18, and extract the sales from November 2015 to 2017.
table_02 = pd.concat([table['2015-11'],table['2016-11'],table['2017-11']],axis=0)
table_02

img
Make regression analysis for the secondary market (once for each field in the table above).
from sklearn.linear_model import LinearRegression
y_11 = []
x_train=np.array([2015,2016,2017]).reshape(-1,1)

for i in table_02.columns:
    y_train=table_02[i].values
    clf = LinearRegression()
    clf.fit(x_train,y_train)
    y_pred = clf.predict(np.array([[2018]]).round(1))
    y_11.append(round(y_pred[0],2))
y_11
[5543203.83,
 776627.04,
 38692.61,
 6678677.55,
 71752495.99,
 1801318.82,
 193874.39,
 86784890.23]
Add the above results to the data table of 15 to 17 years.
date = datetime.datetime.strptime('2018-11-1','%Y-%m-%d')
y_11 = pd.Series(y_11,index=['Electric mosquito repellent incense set','Mould proof and moth proof tablet','Rodenticide','Pan Xiang cockroach killing incense mosquito repellent incense pan',
                             'Mosquito repellent incense heater','Mosquito repellent incense tablets','Mosquito repellent incense liquid','Total sales in primary market']
                ,name=date)
table_02.loc[date,:]=y_11
table_02

img
Similarly, the sales volume of each pesticide in December 2018 is predicted.

img
It can be seen from the forecast results that the total market sales in November and December 2018 will further increase compared with the previous three years.
Secondary market capacity analysis
Merge the original data and the predicted sales data, and then continue the analysis.
table_04 = pd.concat([table,table_02,table_03],axis=0)
#Sort by index
table_04 = table_04.drop_duplicates(
      ).sort_index(ascending=False).iloc[:-2,:]
table_04.head()

img
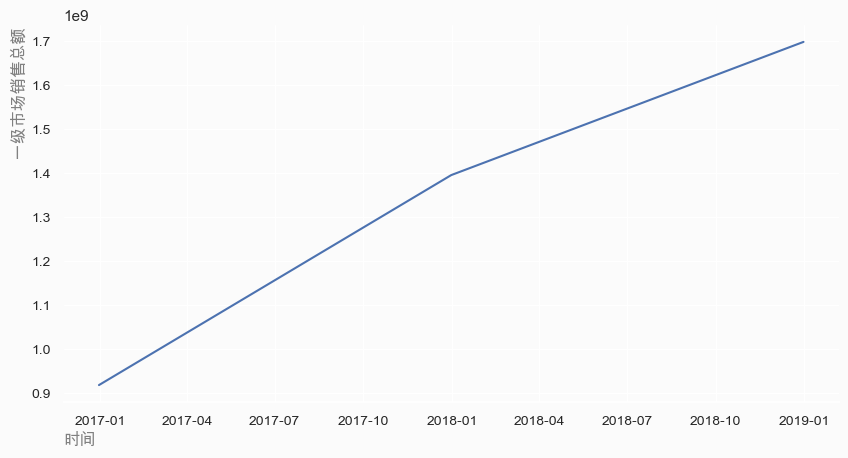
Statistics on the total annual sales of primary market in 2016, 2017 and 2018. And draw a line chart.
# table_04.resample('Y ') [' total sales in primary market '] sum().plot()
t4 = table_04.resample('Y')['Total sales in primary market'].sum()
time
2016-12-31    917966079.69
2017-12-31   1395872729.27
2018-12-31   1699011039.03
Freq: A-DEC, Name: Total sales in primary market,
dtype: float64
img
As can be seen from the above figure, the growth rate of total sales in 2018 slowed down compared with that in 2017. Further analyze the capacity of the secondary market and explore the market growth point.
table_05 = table_04.resample('Y').sum()
table_05

img
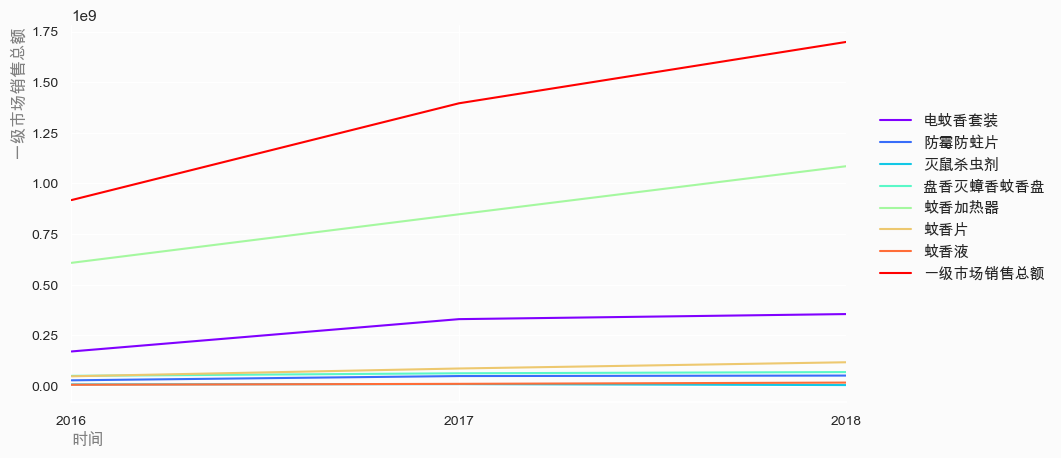
Draw a broken line chart of the total annual consumption of each insect repellent in three years.
img
As can be seen from the results:
-
In the secondary market, the sales volume of rodenticide market is the largest and the growth rate is stable
-
Next, analyze the market segments, focusing on the rodent and pest control market, which is also due to the secondary market where the product line of the demander is located.
-
Mosquito control market accounts for a large proportion, and mosquito control products can be considered to increase product diversity.
Analysis on the proportion of secondary market
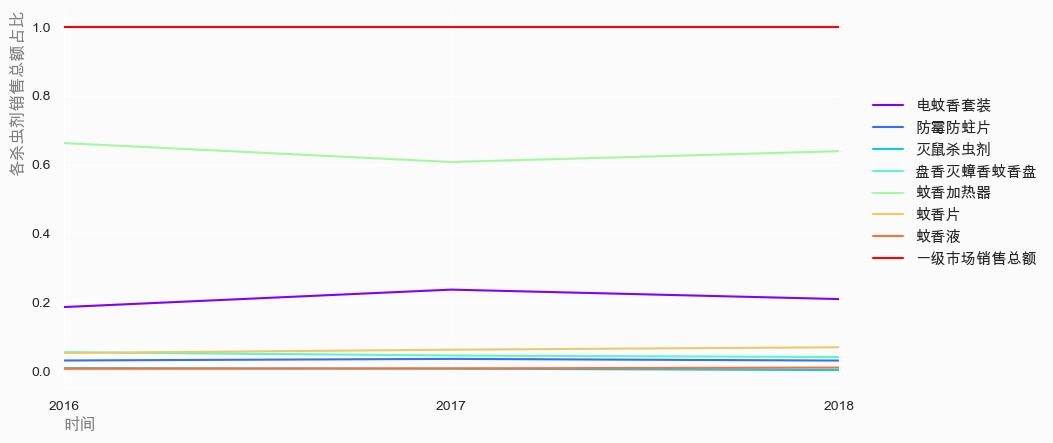
Divide the annual sales of all pesticides by the total sales of the primary market to obtain the market share of each pesticide.
a=[]
for i in table_05.columns:
    a.append(table_05[i]/table_05.Total sales in primary market)
table_06=pd.DataFrame(a,index=table_05.columns)
table_06.T

img
The proportion of the secondary market obtained above is visually analyzed to obtain the proportion of the total sales of each pesticide as shown in the figure below.
img
As can be seen from the results:
-
The rodenticide market has always occupied more than 60% of the primary market.
-
The second is mosquito repellent incense liquid products, accounting for more than 20%.
Incremental analysis of secondary market
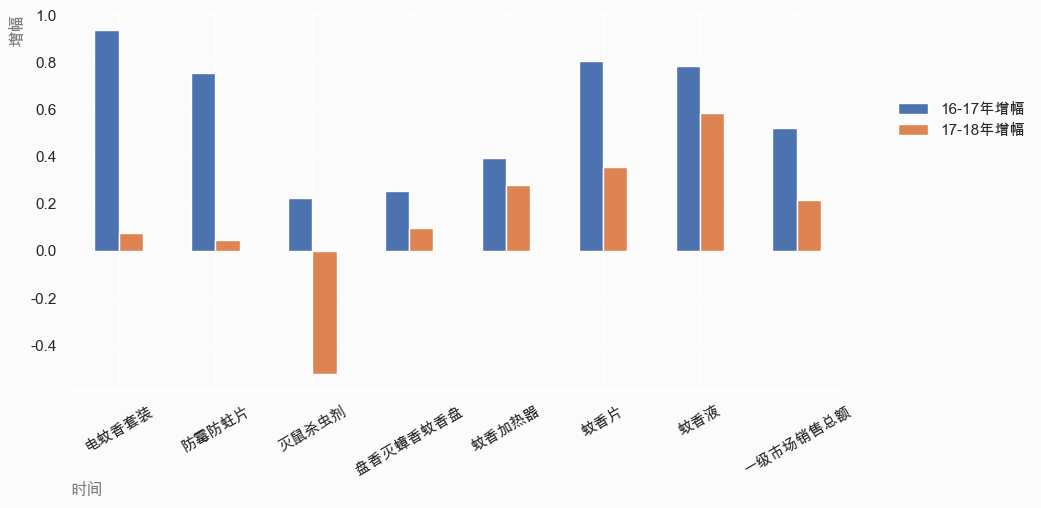
The annual total sales of each insecticide is differentiated and the annual increase is obtained by dividing the annual total sales of the previous year.
incre_01=(table_05.iloc[1,:]-table_05.iloc[0,:])/table_05.iloc[0,:]
incre_02=(table_05.iloc[2,:]-table_05.iloc[1,:])/table_05.iloc[1,:]
incre=pd.DataFrame([incre_01,incre_02],index=['16-17 Annual growth rate',"17-18 Annual growth rate"])
incre

img
Visualize the data obtained above.
img
The following points are obtained from the above analysis:
-
The growth of primary market capacity is indeed slowing down, with a large slowdown.
-
The capacity of the secondary market has slowed down to a small extent.
Competitive analysis
This section uses industry ranking top100 brand data, including brand, industry ranking, transaction index, transaction growth rate, Alipay transformation index and other important fields.
brand=pd.read_excel('./baier/E-commerce case data/top100 Brand data.xlsx')
brand.head()
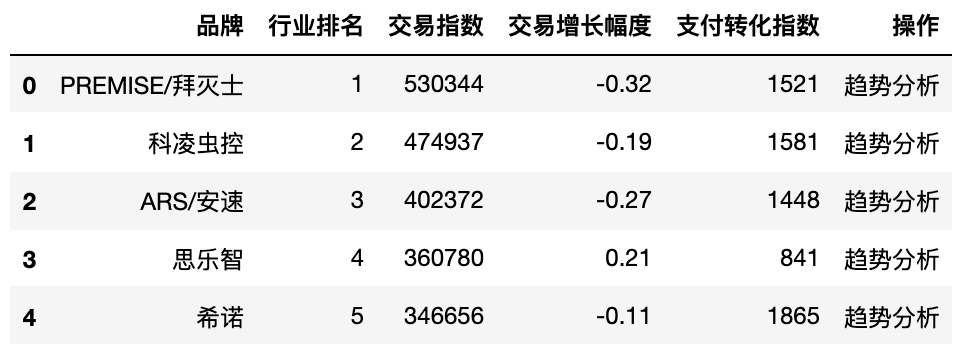
img
Here we only need two fields: brand and transaction index.
brand=brand[['brand','Trading index']]
brand.set_index('brand',drop=True,inplace=True)
brand.head()
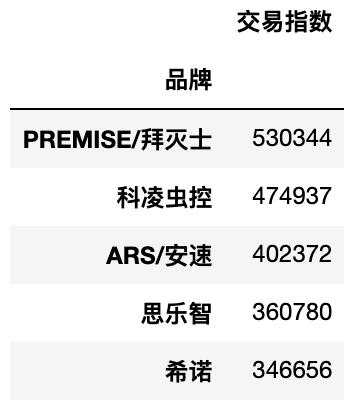
img
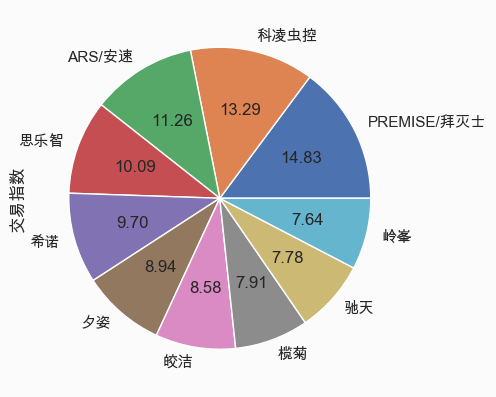
And draw a pie chart of the top 10 brands in the industry to see the market share of each brand.
img
Micro market competition analysis
mm=pd.read_excel('./baier/E-commerce case data/Rodenticide market segment/mite.xlsx')
ms=pd.read_excel('./baier/E-commerce case data/Rodenticide market segment/Deratization.xlsx')
sc=pd.read_excel('./baier/E-commerce case data/Rodenticide market segment/Insecticidal.xlsx')
sz=pd.read_excel('./baier/E-commerce case data/Rodenticide market segment/Lice.xlsx')
zl=pd.read_excel('./baier/E-commerce case data/Rodenticide market segment/cockroach.xlsx')
t_01=sz[["category","Estimated sales"]]
t_02=zl[["category","Estimated sales"]]
t_03=mm[["category","Estimated sales"]]
t_04=ms[["category","Estimated sales"]]
t_05=sc[["category","Estimated sales"]]
Micro market capacity analysis
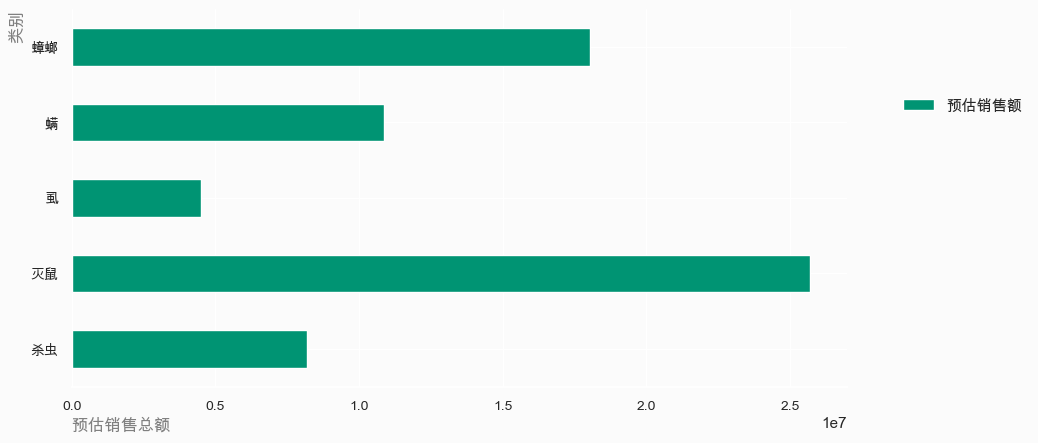
Merge the data of each category of rodenticide market segment, cluster according to the category, and sum the estimated sales. Get the bar chart of estimated total sales of each pesticide category as shown in the figure below.
t = pd.concat([t_01,t_02,t_03,t_04,t_05])
t.set_index('category',drop=True,inplace=True)
(t.groupby('category').sum()).plot(kind='barh',
                             color=cmap[1],ax=ax)
img
Many valuable information can be obtained from the bar chart:
-
In the secondary market, the estimated sales of rodent control products are the largest.
-
The second is cockroach killing products. At present, Bayer's products in the insect repellent market mainly focus on cockroach killing and insect killing.
-
The product line of deratization and mite removal can be considered.
Analysis on the proportion of tertiary market
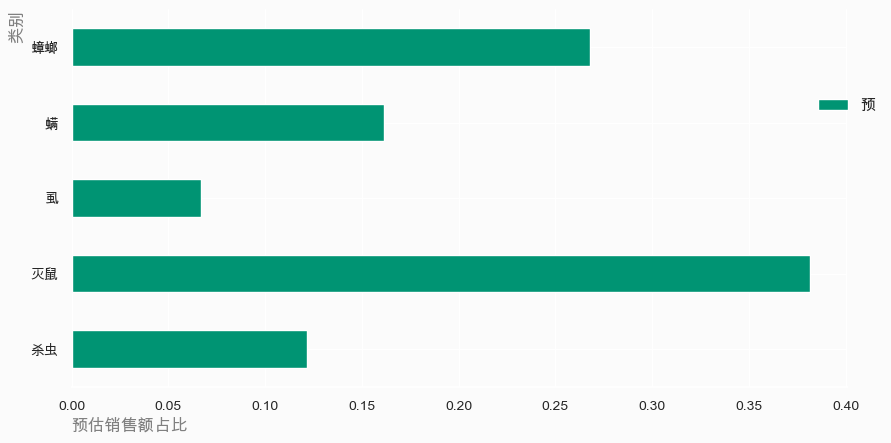
Divide the products of each category by the total sales to obtain the sales proportion of each product, and draw a horizontal bar chart.
t.groupby('category').sum().sum(axis=0)
t = pd.concat([t_01,t_02,t_03,t_04,t_05])
(t.groupby('category').sum()/t.groupby('category').sum().sum(axis=0)
).plot(kind='barh',color=cmap[1],ax=ax)
img
As can be seen from the results:
-
Bayer's main business market, rodent and cockroach killing products account for about 60% of the market share.
If we want to intervene in rodent control products, we should focus on low-cost drainage products. What price range of rodent control products is more appropriate.
Price positioning of drainage products
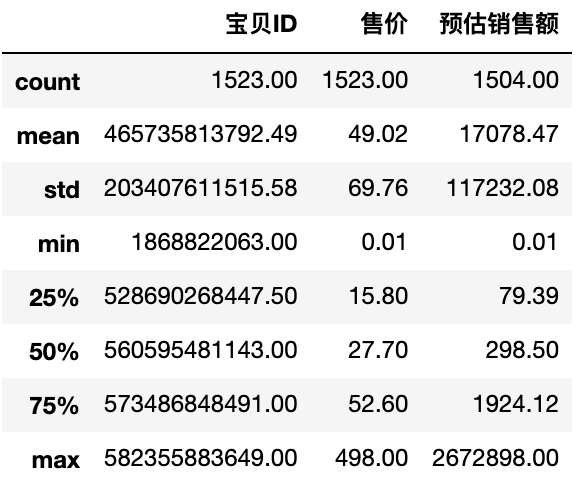
Through the descriptive statistics of the data table, the predicted sales volume of each price range is obtained.
ms_02 = ms.loc[:,['category','baby ID','price','Estimated sales']]
ms_02.describe()
img
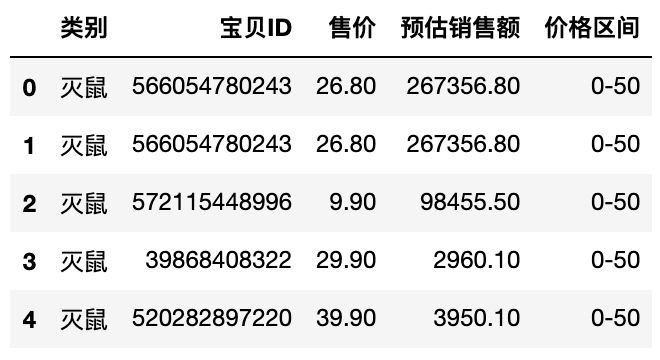
The price data is discretized. Seven cutting points of 0,50100150200250300 are set to cut the price into six price ranges.
bins_01 = [0,50,100,150,200,250,300]
labels = ['0-50','50-100','100-150','150-200','200-250','250-300']
ms_02['Price range']=pd.cut(ms_02['price'],bins=bins_01,labels=labels)
ms_02.head()
img
Aggregate the estimated sales by price range and obtain the following results. It is obvious that when the price range is 0-50, the estimated total sales is the highest, which is nearly 5 times of the total estimated sales in the second 50-100 price range.
ms_02.groupby('Price range')['Estimated sales'].sum().sort_values(ascending=False)
Price range
0-50      15162086.51
50-100     3335060.19
100-150    2758086.29
200-250    2743758.00
150-200     629813.00
250-300     237740.00
Name: Estimated sales, dtype: float64
If Bayer wants to intervene in rodent killing products, the drainage product is positioned between 0-50, but which subdivision interval is more reasonable?
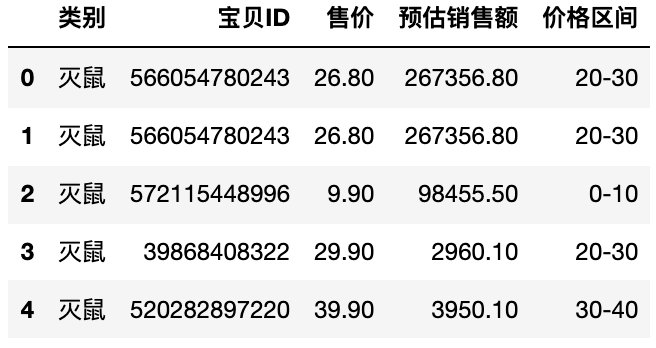
Refine the price range, continue to divide the 0-50 price range by 0,10,20,30,40,50, i.e. every 10 yuan, and obtain the following results.
bins_02=[0,10,20,30,40,50]
labels_02=["0-10","10-20","20-30","30-40","40-50"]
ms_02['Price range']=pd.cut(ms_02['price'],bins=bins_02,labels=labels_02)
ms_02.head()
img
Similarly, aggregate, sum and sort to obtain the following results, in which the total forecast sales in the price ranges of 10-20 and 20-30 are relatively high.
ms_02.groupby('Price range')['Estimated sales'].sum().sort_values(ascending=False)
Price range
10-20   8102634.14
20-30   4969620.92
30-40   1240874.19
40-50    707568.49
0-10     141388.77
Name: Estimated sales, dtype: float64
If you want to make rodent control and drainage products between 0-50 yuan, it is more appropriate to make them within 10-30 yuan. The market is more popular and it is not easy to lose money.
Competitive analysis
Who are our competitors? What is their strategy? What are our strengths and weaknesses compared with them? These are the problems we must often face. Competitors are everywhere. As a data analyst, how can we help the company formulate competitive strategies? Failure to correctly identify their competitors will lead to all kinds of passivity, which will not only waste resources, but also waste valuable development opportunities.
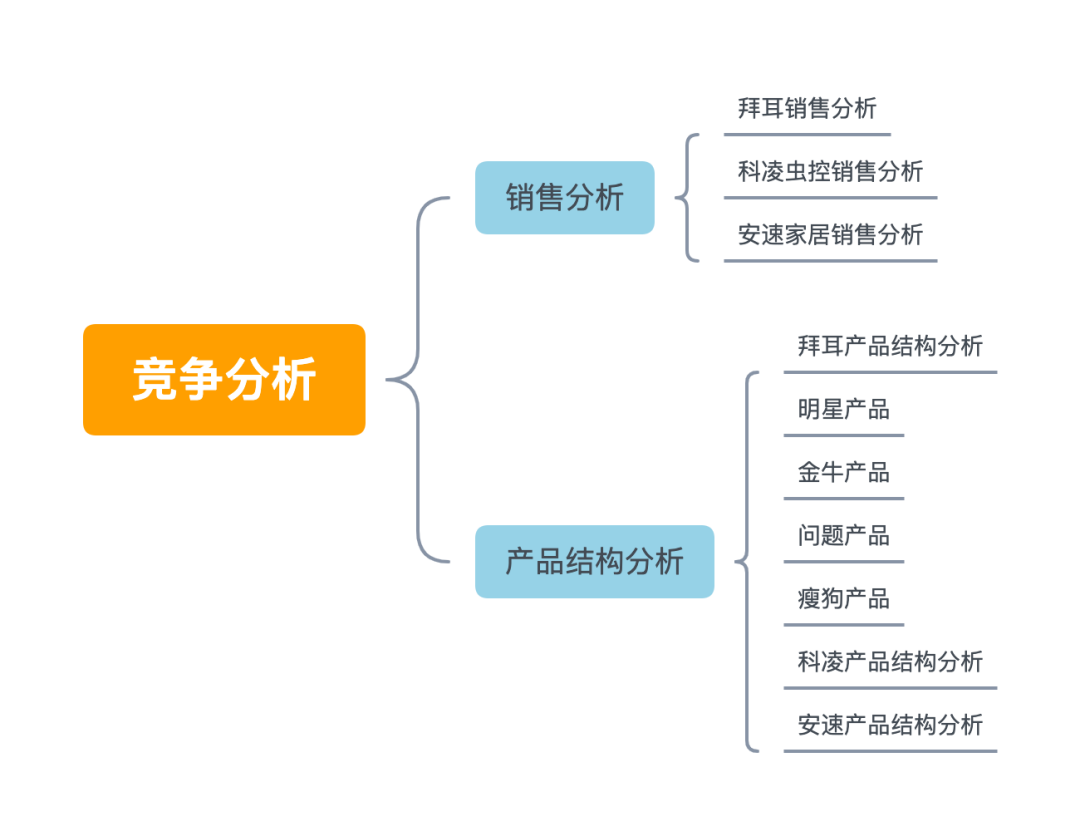
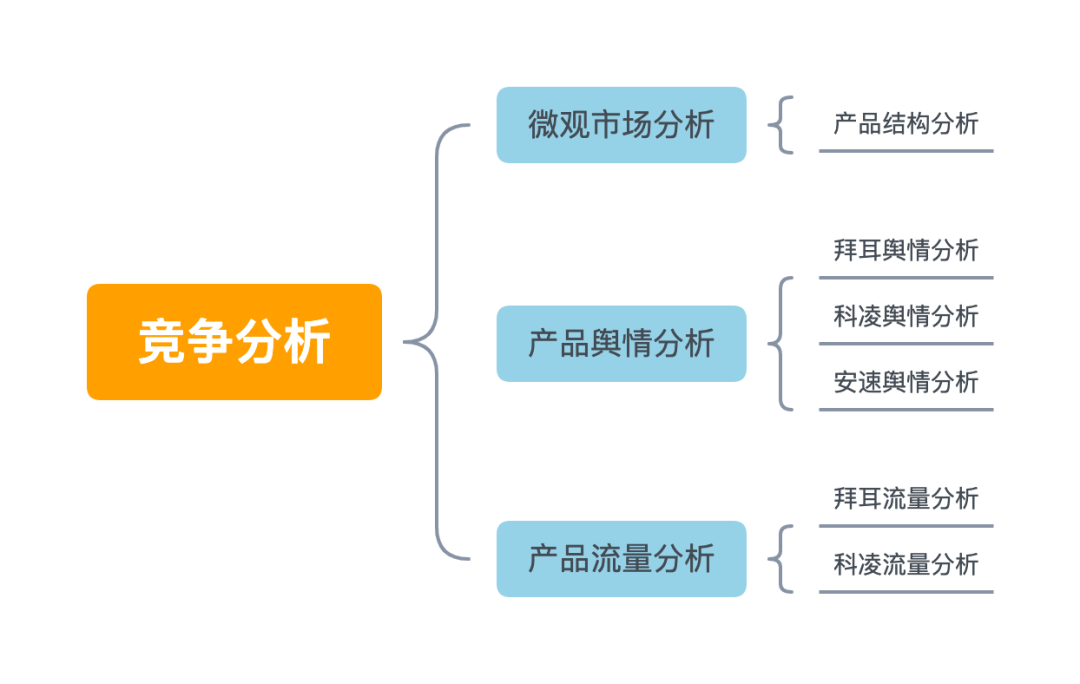
This competition analysis will start from two aspects: one is sales competition analysis, including Bayer, Keling insect control and ansu home sales analysis. Second, product structure analysis. This part will continue in the second part of this case analysis, which is not covered in this article.
img
Sales analysis
The data used this time are the sales data of three companies in the commodity sales data in the competitive data in recent 30 days.
Ansu home =pd.read_excel('./baier/E-commerce case data/Competitive data/Commodity sales data/Ansu home sales data in recent 30 days.xlsx')
Keling insect control =pd.read_excel('./baier/E-commerce case data/Competitive data/Commodity sales data/Sales data of Keling insect control flagship store in recent 30 days.xlsx')
Bayer sales analysis
Check which fields are included in this data.
Bayer  = pd.read_excel('./baier/E-commerce case data/Bayer store data/Bayer sales data in recent 30 days.xlsx')
Bayer .info()
<class 'pandas.core.frame.DataFrame'>
RangeIndex: 15 entries, 0 to 14
Data columns (total 16 columns):
 #   Column  Non-Null Count  Dtype
---  ------  --------------  -----
 0   Serial number      15 non-null     int64
 1   Store name    15 non-null     object
 2   Trade name    15 non-null     object
 3   commodity ID    15 non-null     int64
 4   Main diagram link    15 non-null     object
 5   Product link    15 non-null     object
 6   Original price of goods    15 non-null     float64
 7   Commodity price    15 non-null     float64
 8   30 Daily sales  15 non-null     int64
 9   Total sales     15 non-null     int64
 10  Category      15 non-null     object
 11  Physical form    11 non-null     object
 12  model      15 non-null     object
 13  Net content     13 non-null     object
 14  Use object    15 non-null     object
 15  sales volume     15 non-null     float64
dtypes: float64(3), int64(4), object(9)
memory usage: 2.0+ KB
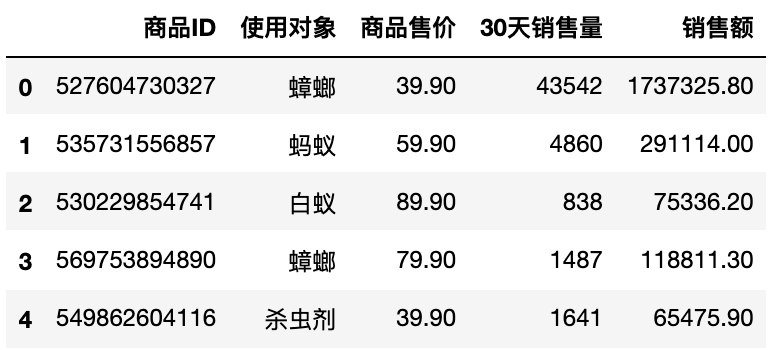
Use slice to intercept the field information required for this analysis.
baier = Bayer [["commodity ID",'Use object',"Commodity price","30 Daily sales","sales volume"]]
baier.head()
img
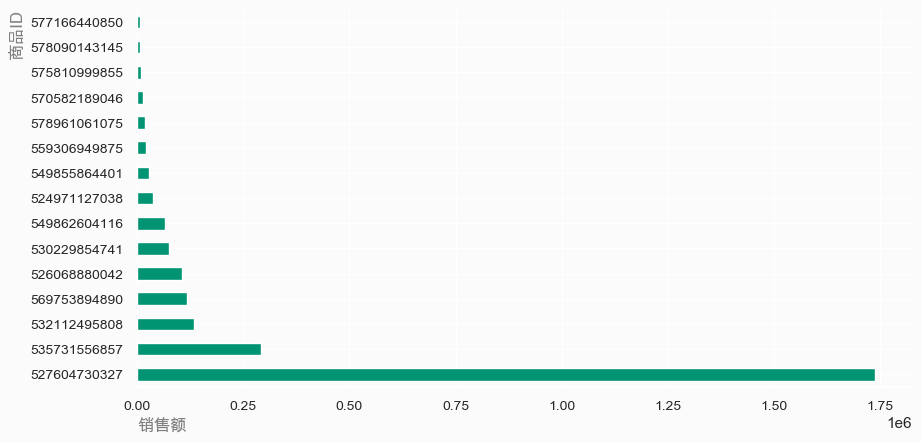
Aggregate according to the commodity ID, sum the sales, and draw a bar chart after sorting according to the total sales, as shown below. It can be seen from the results that the sales of the popular product 527604730327 far exceeds that of any other product.
cmap = [low_c,high_c]
(baier.groupby('commodity ID')['sales volume'].sum().sort_values(ascending=False)
).plot(kind='barh',color=cmap[1],ax=ax)
img
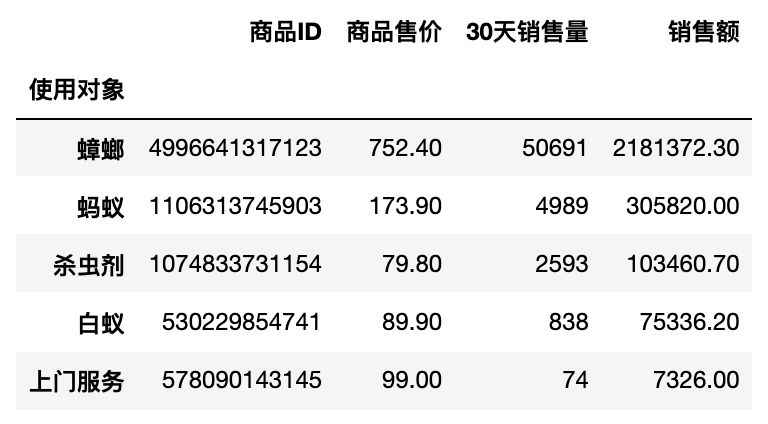
In order to view the total sales of Bayer products by different use objects, aggregate the use objects and sum all fields, mainly depending on the two fields of 30 day sales volume and sales volume. The sum of the other two fields does not make sense.
baier.groupby('Use object').sum().sort_values('sales volume',ascending=False)
img
The following information can be obtained from the above results:
-
Cockroach killing products account for the largest proportion of Bayer's sales
-
The second is ant control
Keling pest control sales analysis
Next, analyze the sales data of Keling insect control. The data is the same as Bayer's sales data field, so it will not be displayed here.
Similarly, the slice intercepts the required fields for analysis. The product ID is aggregated and other fields are summed to obtain the sales data of each product.
keling = Keling insect control[["commodity ID",'Applicable object',"Commodity price","30 Daily sales","30 Daily sales"]]
keling.groupby('commodity ID').sum().sort_values('30 Daily sales',ascending=False)
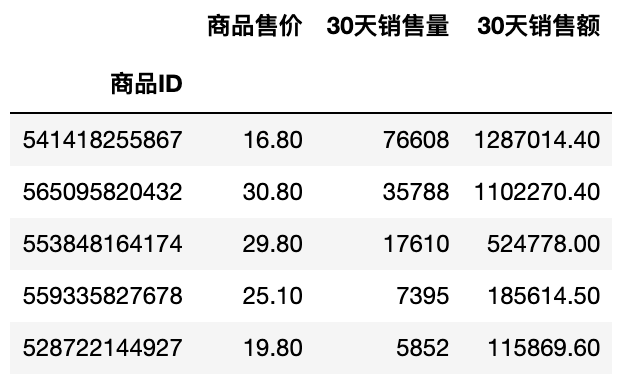
img
Similarly, statistics are made on the total sales volume and total amount data of each user within 30 days.
keling.groupby('Applicable object')['30 Daily sales','30 Daily sales'].sum().sort_values('30 Daily sales',ascending=False)
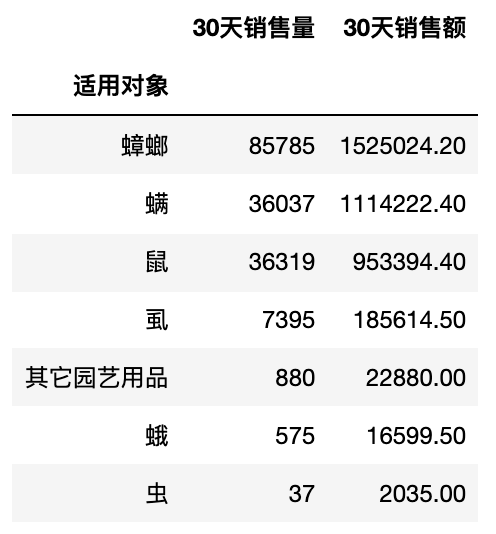
img
The main information is as follows.
-
The sales of popular products (cockroach killing) are not far from Bayer
-
Keling's product categories cover the main categories in the secondary market
Ansu home sales analysis
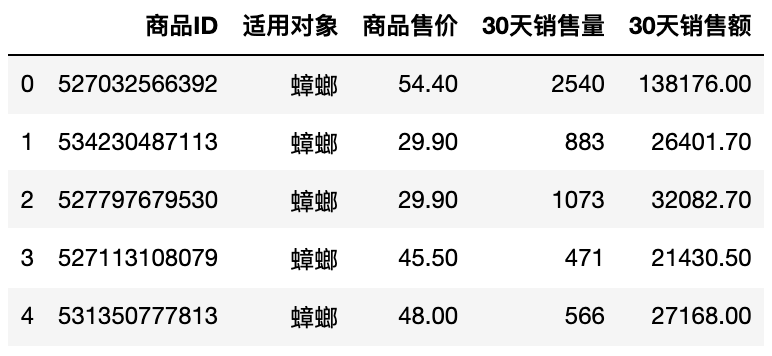
According to the above sales data analysis methods of Bayer and Keling insect control, it is also used to analyze the sales analysis data of ansu home.
ansu = Ansu home[["commodity ID",'Applicable object',"Commodity price","30 Daily sales","30 Daily sales"]]
ansu.head()
img
ansu.groupby('commodity ID')['30 Daily sales','30 Daily sales'].sum().sort_values('30 Daily sales',ascending=False)
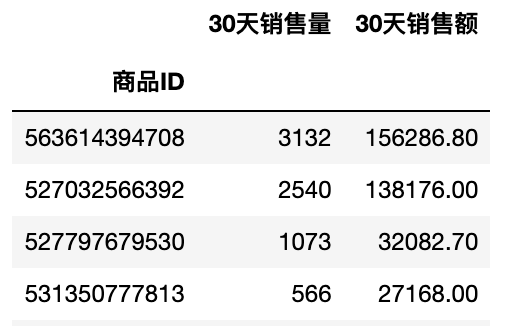
img
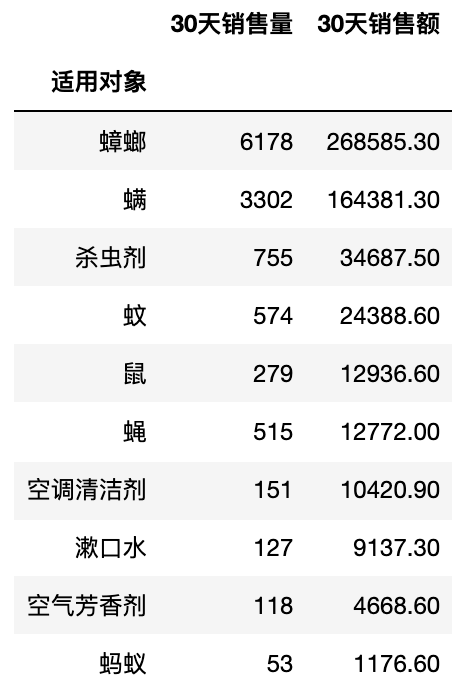
ansu.groupby('Applicable object')['30 Daily sales','30 Daily sales'].sum().sort_values('30 Daily sales',ascending=False)
img
The main information is as follows.
-
The sales of hot selling products are less than that of Bayer and Keling
-
Ansu has a wide range of product categories, basically covering the main product categories of Bayer and Keling
-
Bayer's best-selling products mainly focus on killing cockroaches, and the main competitors (Keling and ansu) compete in the main business
-
The product diversification of major competitors is better than Bayer
-
Bayer's cockroach killing products as long as its competitor Keling, the main challenge of insect and ant killing products comes from ansu
Write at the end
So far, this case is a general case that has completed the analysis task. At the beginning, I introduced some basic knowledge of e-commerce case analysis, and analyzed the sales data of several e-commerce companies from the macro market and micro market. The main contents are as follows:
① More than 2000 Python e-books (both mainstream and classic books should be available)
② Python standard library materials (the most complete Chinese version)
③ Project source code (forty or fifty interesting and classic hand training projects and source code)
④ Videos on basic introduction to Python, crawler, web development and big data analysis (suitable for Xiaobai)
⑤ Python learning roadmap (bid farewell to non stream learning)
If you need relevant information, you can scan it
