1, Foreword
The premise of the regional contour map is how to get the js files of these contours. In fact, the json data of the contours of provinces and cities can be found on the network. The corresponding contents of these json data are similar to those of various boundaries@@ CGIUCACAAAAA@Q @Characters. Each paragraph of this character represents a specific closed area. For the specific regular meaning of this character, I searched for a circle and didn't find the answer. Could it be that these characters can be converted into a set of longitude and latitude coordinates, and then draw the closed area graph Polygon for these longitude and latitude coordinate sets.
These json data are not enough. They need to be converted into js files so that the echart library can be recognized and used normally. There is also this general js function framework on the Internet, which only needs to call echarts The registermap method just registers the json data of the corresponding region, so according to this rule, it performs the function of generating all js files with one click.
2, Functional features
- At the same time, it supports flashing point map, migration map, regional map, world map, dashboard, etc.
- You can set various colors such as title, prompt information, background color, text color, line color, area color, etc.
- You can set the name, value, longitude and latitude set of the city.
- You can set the magnification of the map and whether to allow the mouse wheel to zoom.
- The built-in world map, national map, provincial map and regional map can be accurate to the county, and all maps can be used offline.
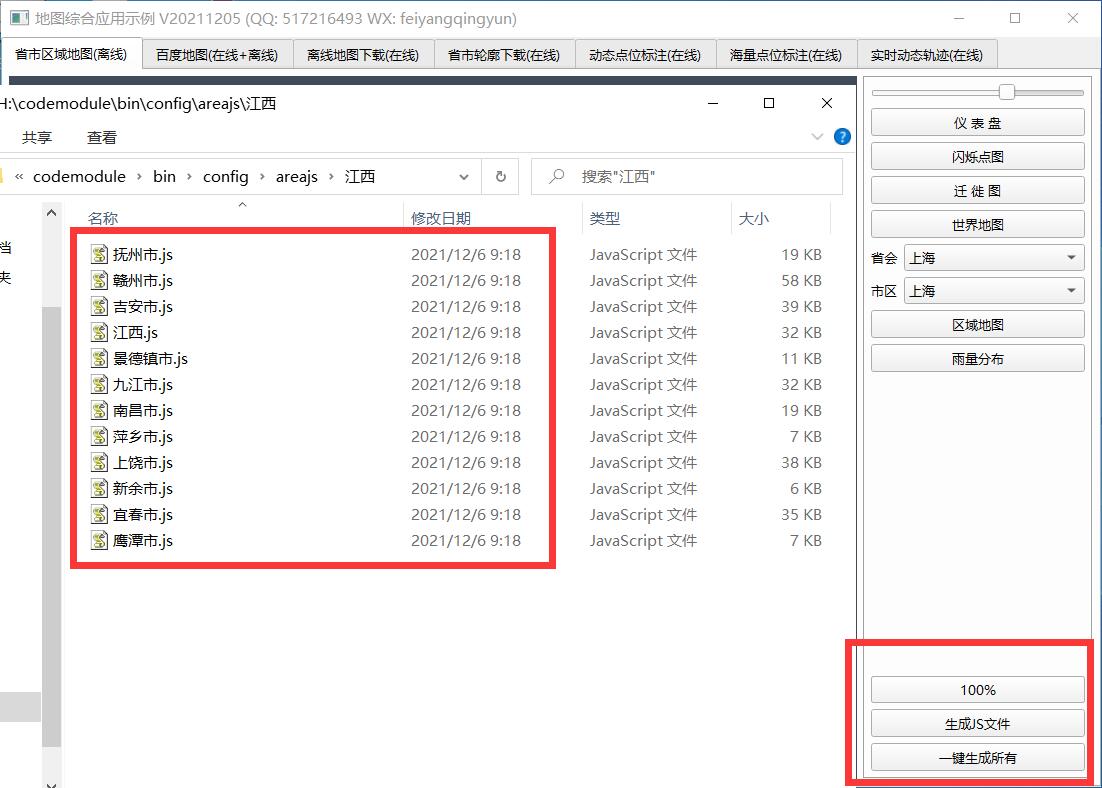
- It has built-in function of converting json data files to js files in various provinces and cities. If there is data update, it can be converted by itself. It supports single file conversion and one click conversion of all files.
- The built-in function is to obtain all the names and longitude and latitude information sets of the area from json files or js files. The information can be obtained through this method for display.
- It depends on the browser component to display the map, and the demo provided supports WebKit / webengine / minilink / IE to load web pages.
- The minilink browser kernel is used to get through Qt5 6 and subsequent versions + mingw compiler lacks browser module, which makes the whole project support all QT versions and test any version from 4.7 to 6.2.
- The color can be set separately for the points set such as flicker point migration diagram.
- The interface is provided to directly obtain the relevant information of the clicked points, which is convenient for program linkage processing.
- It has strong expansibility. You can add all kinds of exquisite echarts components according to the gourd and gourd, and make an awesome effect.
- The built-in dashboard component provides interactive functions, and the corresponding code is included in the demo demonstration.
- The function interface is friendly and unified, simple and convenient to use, just one class.
- Support any Qt version, any system and any compiler.
3, Experience address
- Experience address: https://pan.baidu.com/s/1ZxG-oyUKe286LPMPxOrO2A Extraction code: o05q file name: bin_map.zip
- Domestic sites: https://gitee.com/feiyangqingyun
- International sites: https://github.com/feiyangqingyun
- Personal homepage: https://blog.csdn.net/feiyangqingyun
- Zhihu homepage: https://www.zhihu.com/people/feiyangqingyun/
4, Renderings
5, Related code
#pragma execution_character_set("utf-8")
#include "echartjs.h"
#include "qfile.h"
#include "qfileinfo.h"
#include "qdir.h"
#include "qtextstream.h"
#include "qdatetime.h"
#include "qdebug.h"

#if (QT_VERSION >= QT_VERSION_CHECK(5,0,0))
#include "qjsonarray.h"
#include "qjsondocument.h"
#include "qjsonobject.h"
#include "qjsonvalue.h"
#endif

void EchartJs::saveJs(const QString &jsonFile, const QString &jsFile, const QString &cityName)
{
    QStringList list;

    //Head fixed data
    list << "(function (root, factory) {";
    list << "    if (typeof define === 'function' && define.amd) {";
    list << "        // AMD. Register as an anonymous module.";
    list << "        define(['exports', 'echarts'], factory);";
    list << "    } else if (typeof exports === 'object' && typeof exports.nodeName !== 'string') {";
    list << "        // CommonJS";
    list << "        factory(exports, require('echarts'));";
    list << "    } else {";
    list << "        // Browser globals";
    list << "        factory({}, root.echarts);";
    list << "    }";
    list << "} (this, function (exports, echarts) {";
    list << "    var log = function (msg) {";
    list << "        if (typeof console !== 'undefined') {";
    list << "            console && console.error && console.error(msg);";
    list << "        }";
    list << "    }";
    list << "    if (!echarts) {";
    list << "        log('ECharts is not Loaded');";
    list << "        return;";
    list << "    }";
    list << "    if (!echarts.registerMap) {";
    list << "        log('ECharts Map is not loaded');";
    list << "        return;";
    list << "    }";

    //Read data from json file
    QString body;
    QFile fileJson(jsonFile);
    if (fileJson.open(QFile::ReadOnly | QFile::Text)) {
        body = fileJson.readAll();
        fileJson.close();
    }

    //Add to data
    list << QString("    echarts.registerMap('%1', %2);").arg(cityName).arg(body);
    list << "}));";

    //Save data to js file
    QFile fileJs(jsFile);
    //If the folder does not exist, the folder will be generated first
    QString path = QFileInfo(fileJs).path();
    QDir dir(path);
    if (!dir.exists()) {
        dir.mkdir(path);
    }

    //Empty every time you open it
    if (fileJs.open(QFile::WriteOnly | QFile::Truncate)) {
        QTextStream out(&fileJs);
        out << list.join("\r\n");
    }
}

QStringList EchartJs::getInfoFromJson(const QString &jsonFile)
{
    QByteArray data;
    QFile fileJson(jsonFile);
    if (fileJson.open(QFile::ReadOnly | QFile::Text)) {
        data = fileJson.readAll();
        fileJson.close();
    }

    return getInfoFromData(data);
}

QStringList EchartJs::getInfoFromJs(const QString &jsFile)
{
    QByteArray data;
    QFile fileJs(jsFile);
    if (fileJs.open(QFile::ReadOnly | QFile::Text)) {
        while (!fileJs.atEnd()) {
            QByteArray line = fileJs.readLine();
            line = line.trimmed();
            if (line.startsWith("echarts.registerMap")) {
                int index = line.indexOf("{");
                data = line.mid(index, line.length() - index - 2);
            }
        }

        fileJs.close();
    }

    return getInfoFromData(data);
}

QStringList EchartJs::getInfoFromData(const QByteArray &data)
{
    //Take out the corresponding city name and latitude and longitude
    //The following two methods have tested the parsing time. json is about 1ms, string segmentation is about 5ms, and json method is faster
    QStringList result;
#if (QT_VERSION < QT_VERSION_CHECK(5,0,0))
    //Parsing by string segmentation
    QString temp = data;
    temp = temp.mid(0, temp.length() - 24);
    QString flag = "properties";
    int count = temp.count();
    for (int i = 0; i < count; ++i) {
        QString str = temp.mid(i, 10);
        if (str != flag) {
            continue;
        }

        str = temp.mid(i, 100);
        str = str.mid(13, str.indexOf("},") - 13);
        str.replace("}", "");
        //At this point, the data has become "cp":[121.490317,31.222771],"name": "Huangpu District", "childNum":1
        //The order of CP names may be different, so you need to split the string and judge again
        QString name, cp;
        QStringList list = str.split(",");
        foreach (QString s, list) {
            if (s.startsWith("\"cp\"")) {
                cp = s.mid(6, s.length());
            } else if (s.startsWith("\"name\"")) {
                name = s.mid(8, s.length());
                name.replace("\"", "");
            } else if (s.startsWith("\"childNum\"")) {

            } else {
                //Longitude and latitude will be split into two parts, one of which is here [31.222771]
                cp = QString("%1,%2").arg(cp).arg(s.left(s.length() - 1));
            }
        }

        result << QString("%1|%2").arg(name).arg(cp);
    }
#else
    //Parsing with built-in json method of qt
    QJsonParseError error;
    QJsonDocument jsonDoc = QJsonDocument::fromJson(data, &error);
    if (error.error == QJsonParseError::NoError) {
        QJsonObject rootObj = jsonDoc.object();
        //qDebug() << rootObj.keys();
        if (!rootObj.contains("features")) {
            return QStringList();
        }

        QJsonArray features = rootObj.value("features").toArray();
        int count = features.count();
        for (int i = 0; i < count; ++i) {
            QJsonObject subObj = features.at(i).toObject();
            if (!subObj.contains("properties")) {
                continue;
            }

            QJsonObject nodeObj = subObj.value("properties").toObject();
            QJsonArray array = nodeObj.value("cp").toArray();
            QStringList list;
            for (int j = 0; j < array.count(); ++j) {
                list << QString::number(array.at(j).toDouble());
            }

            QString name = nodeObj.value("name").toString();
            QString cp = list.join(",");
            result << QString("%1|%2").arg(name).arg(cp);
        }
    }
#endif
    return result;
}