Tutorial directory
- 0x00 tutorial content
- 0x01 create a new SpringBoot project
- 0x02 combination of JSON and AJAX
- 0x03 surprise
- 0xFF summary
0x00 tutorial content
- New SpringBoot project
- Combining JSON with AJAX
- Surprise
0x01 create a new SpringBoot project
1. New maven project
ps: if you operate on the basis of the previous tutorial, you don't need to create a new project. Please refer to the article: SpringBoot+Thymeleaf+ECharts to realize big data visualization (Basics)
2. Write code
a. Create a new Product entity class:
package com.example.demo;

/**
 * @Auther: Shao Naiyi
 * @Date: 2019/02/01 9:08 am
 * @Description: Commodity entity class
 */
public class Product {

    public String productName;
    public Integer nums;

    public String getProductName() {
        return productName;
    }

    public void setProductName(String productName) {
        this.productName = productName;
    }

    public Integer getNums() {
        return nums;
    }

    public void setNums(Integer nums) {
        this.nums = nums;
    }
}
b. Create a new HelloController class (just use the HelloController in the previous experiment) and add a method to return json data:
@RequestMapping("/project")
@ResponseBody
public List<Product> myProject(){

	ArrayList<Product> productArrayList = new ArrayList<Product>();
	Product product1 = new Product();
	product1.setProductName("Socks");
	product1.setNums(15);
	Product product2 = new Product();
	product2.setProductName("cardigan");
	product2.setNums(20);
	Product product3 = new Product();
	product3.setProductName("Chiffon shirt");
	product3.setNums(24);
	Product product4 = new Product();
	product4.setProductName("high-heeled shoes");
	product4.setNums(30);

	productArrayList.add(product1);
	productArrayList.add(product2);
	productArrayList.add(product3);
	productArrayList.add(product4);

	return productArrayList;
}
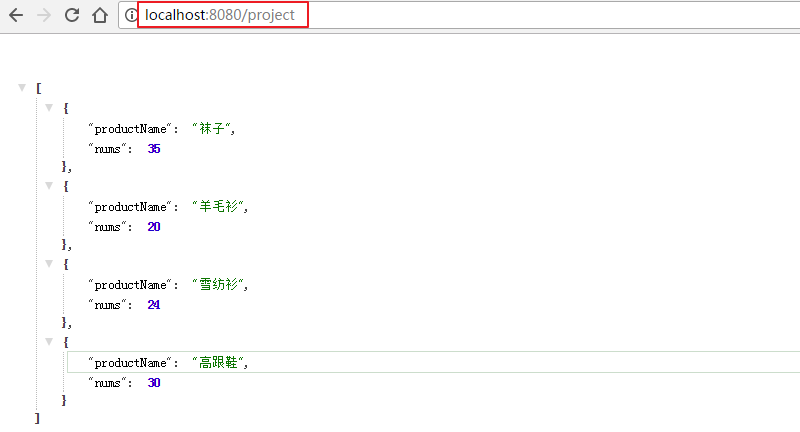
c. Start the project and access the path to see the json data returned in the background:
localhost:8080/project
3. Code explanation
a. Annotation @ RequestMapping("/project"): to access the / project path, execute the following method
b. Annotation @ ResponseBody: returns data in json format
c. ArrayList<Product> productArrayList = new ArrayList<Product>();: Build a collection for installing product objects. Here, it means that four products are installed
d. return productArrayList;: Return data to the front end
- Therefore, you can view the data by visiting localhost:8080/project. 8080 is the default port of the SpringBoot project. Localhost represents the local IP. Click execute for our IDEA project, which actually starts the project locally in windows. When you open it in browser mode, the default is GET request, but @ RequestMapping("/project") is not written, and GET can also be accessed.
0x02 combination of JSON and AJAX
1. Write html interface
a. Create a new view HTML file
<!DOCTYPE html>
<html lang="en">
<head>
    <meta charset="UTF-8">
    <title>ECharts</title>
    <script src="js/echarts.min.js"></script>
    <script src="js/jquery-3.1.1.js"></script>
</head>
<body>
<!-- by ECharts Prepare a with size (width and height) DOM -->
<div id="main" style="width: 600px;height:400px;"></div>

<script type="text/javascript">
    // Initialize the ecarts instance based on the prepared dom
    var myChart = echarts.init(document.getElementById('main'));

	// Create a new array of productName and nums to accept data because we
    var productName = [];
    var nums = [];

	//AJAX receive data body
    $.ajax({
        type:"GET",
        url:"/project",
        dataType:"json",
        async:false,
        success:function (result) {

            for (var i = 0; i < result.length; i++){
                productName.push(result[i].productName);
                nums.push(result[i].nums);
            }

        },
        error :function(errorMsg) {
            alert("Failed to get background data!");
        }
    });

    // Specify configuration items and data for the chart
    var option = {
        title: {
            text: 'ECharts Getting started example'
        },
        tooltip: {},
        legend: {
            data:['sales volume']
        },
        xAxis: {
        	//combination
            data: productName
        },

        yAxis: {},
        series: [{
            name: 'sales volume',
            type: 'bar',
            //combination
            data: nums
        }]
    };

    // Display the chart using the configuration item and data you just specified.
    myChart.setOption(option);
</script>
</body>
2. Write access interface method
a. Add a method to the HelloController class
@RequestMapping("/view")
public String myView(){
	return "view";
}
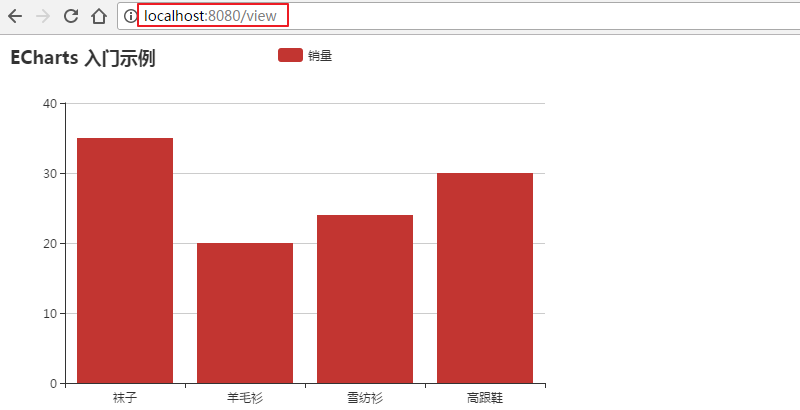
b. Restart the project, open the browser (localhost:8080/view), and you can see:
3. Code explanation
a. AJAX request
$.ajax({//ajax request method of JQuery
    type:"GET",//Request by GET
    url:"/project",//The requested path is / project, that is, we have the path to return the goods
    dataType:"json",//Data format, json format
    async:false,//Asynchronous request
    success:function (result) {//Method for successful execution of the request
		//Assemble the requested results into our own empty arrays product name and num
        for (var i = 0; i < result.length; i++){
            productName.push(result[i].productName);
            nums.push(result[i].nums);
        }

    },
    error :function(errorMsg) {//Method for successful execution of the request
        alert("Failed to get background data!");
    }
});
b. Data display
xAxis: {
//The x-axis is the product name
    data: productName
},

yAxis: {},
series: [{
    name: 'sales volume',
    type: 'bar',
//y-axis is the quantity of goods
    data: nums
}]
0x03 surprise
1. It's a colored egg
a. Add a method to the HelloController class
@RequestMapping("/view1")
public String myView1(){
	return "view1";
}
b. Create a new view1 HTML file
<!DOCTYPE html>
<html lang="en">
<head>
    <meta charset="UTF-8">
    <title>ECharts</title>
    <script src="js/echarts.min.js"></script>
    <script src="js/jquery-3.1.1.js"></script>

</head>
<body>
<!-- by ECharts Prepare a with size (width and height) DOM -->
<div id="main" style="width: 600px;height:400px;"></div>

<script>
    var myChart = echarts.init(document.getElementById('main'));

    var option = {
        title : {
            text: 'Sales of a site',
            subtext: 'It's pure fiction',
            x:'center'
        },
        tooltip : {
            trigger: 'item',
            formatter: "{a} <br/>{b} : {c} ({d}%)"
        },
        legend: {
            orient: 'vertical',
            left: 'left',
        },
        series : [
            {
                name: 'Access source',
                type: 'pie',
                radius : '55%',
                center: ['50%', '60%'],
                data:(function () {

                    var datas = [];
                    $.ajax({
                        type:"POST",
                        url:"/project",
                        dataType:"json",
                        async:false,
                        success:function (result) {

                            for (var i = 0; i < result.length; i++){
                                datas.push({
                                    "value":result[i].nums, "name":result[i].productName
                                })
                            }

                        }
                    })
                    return datas;

                })(),
                itemStyle: {
                    emphasis: {
                        shadowBlur: 10,
                        shadowOffsetX: 0,
                        shadowColor: 'rgba(0, 0, 0, 0.5)'
                    }
                }
            }
        ]
    };
    myChart.setOption(option);
</script>
</body>
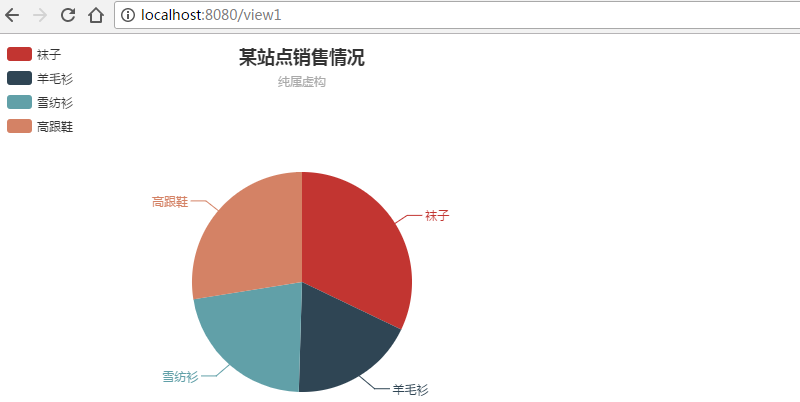
c. Restart the project and open the browser (localhost:8080/view1). You can see:
2. It's another colored egg
a. Create a new front-end project in HBuilder, introduce the js files of echarts and jquery, and create new_file.html, copy view1 HTML content
b. Open new with browser_ file. HTML, open Fiddler (Charles is available for mac system) and refresh the interface. You can see that in fact, our front-end access port is 8020, while our back-end project port is 8080. There is a cross domain problem, so we can't get data
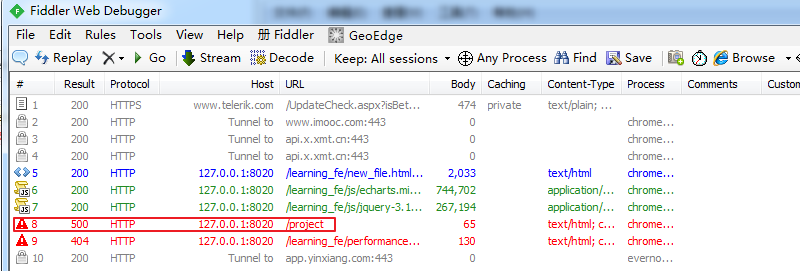
c. Forward port 8020 to port 8080 through Fiddler to receive data. The configuration is as follows:
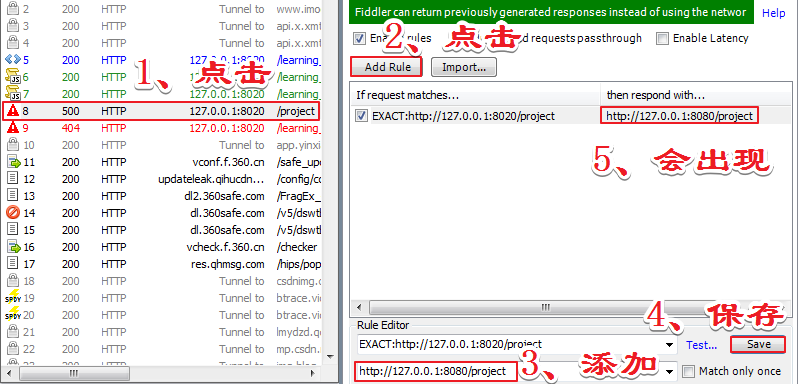
d. Refresh new opened by HBuilder_ file. In the HTML interface, you can see that you are accessing port 8020, but actually the received data is sent from port 8080

0xFF summary
- JSON is a format. Of course, the back-end does not return JSON format. The advantage of JSON format is that the front-end call only needs to conform to JSON format. There are many kinds of front-end interfaces, such as app, applet, etc. they may not conform to the data format you return by default. Therefore, we have defined a specific format for a variety of front-end interface calls.
- AJAX is a very common skill in development. You must know the meaning and use method. The format is relatively fixed, and there are many encapsulated methods now, which is very convenient to call directly.
- There are many styles, not just those in the tutorial. Please check the ecarts official website to learn more:
Ecarts official case
[ecarts official tutorial]( https://www.echartsjs.com/tutorial.html#5 Minutes (ECharts) - For the basic tutorial, please see the article: SpringBoot+Thymeleaf+Echarts to realize big data visualization (Basics) , zero foundation Springboot project introduction, as well as practical examples and so on.
- The separation of front and back end development is a very key skill. You only know the back end without knowing that the front end will be confused. On the contrary, you will. I hope you can gain something after reading this article. If it's useful, please like it or comment on it~
About the author: Shao Naiyi
Full stack engineer, market insight, column editor
| official account | WeChat | micro-blog | CSDN | Jian Shu |
Benefits:
Shao Naiyi's technology blog navigation
Shao Naiyi Original is not easy, if reprinted, please indicate the source.