
Amazon Timestream is a fast and scalable server free time series database service, which is suitable for the Internet of things and operational applications. With this service, trillions of events can be easily stored and analyzed every day, with a speed of 1000 times, and the cost is only one tenth of that of relational database. By keeping recent data in memory and moving historical data to a cost optimized storage tier according to user-defined policies, Amazon Timestream saves customers the time and cost of managing the life cycle of time series data. Amazon Timestream's specially built query engine can be used to access and analyze recent and historical data without displaying whether the specified data is stored in memory or in the cost optimization layer in the query. Amazon Timestream has built-in time series analysis functions, which can identify data trends and patterns in near real time. Amazon Timestream is a server free service that automatically scales to adjust capacity and performance, so you don't need to manage the underlying infrastructure and can focus on building applications.
This article introduces how to use Timestream Kinesis Stream Hosting Service and open source software of Grafana and Flink Connector realize the Internet of things (take PM 2.5 scenario as an example) real time collection, storage and analysis of time series data, including deployment architecture, environment deployment, data collection, data storage and analysis. I hope you can get inspiration and help business development when you have similar time series data storage and analysis requirements of the Internet of things.
framework
Amazon Timestream can use built-in analysis functions (such as smoothing, approximation and interpolation) to quickly analyze the time series data generated by Internet of things applications. For example, smart home device manufacturers can use Amazon Timestream to collect motion or temperature data from device sensors and interpolate it to identify the time range without motion and remind consumers to take action (e.g. reducing heat) to save energy.
This cultural relic Networking (taking the PM 2.5 scenario as an example) realizes real-time PM2.5 data acquisition, timing data storage and real-time analysis. The architecture is mainly divided into three parts:
- Real time timing data acquisition: real time data acquisition from PM 2.5 monitoring equipment to Timestream is realized through Python data acquisition program combined with Kinesis Stream and Kinesis Data Analytics for Apache Flink connector simulation.
- Time series data storage: time series data storage is realized through Amazon Timestream time series database. By setting the storage duration of memory and magnetic storage (cost optimization layer), recent data can be retained in memory, and historical data can be moved to cost optimization storage layer according to user-defined strategies.
- Real time time sequence data analysis: access Timestream data in real time through Grafana (install Timestream for Grafana plug-in). Through Grafana's rich analysis chart form, combined with Amazon Timestream's built-in time series analysis function, you can identify the trend and pattern of Internet of things data in near real time.
The specific architecture diagram is as follows:
Deployment environment
1.1 create Cloudformation
Please use your own account (select us-east-1 for region) to download Cloudformation Yaml file:
https://bigdata-bingbing.s3-a...
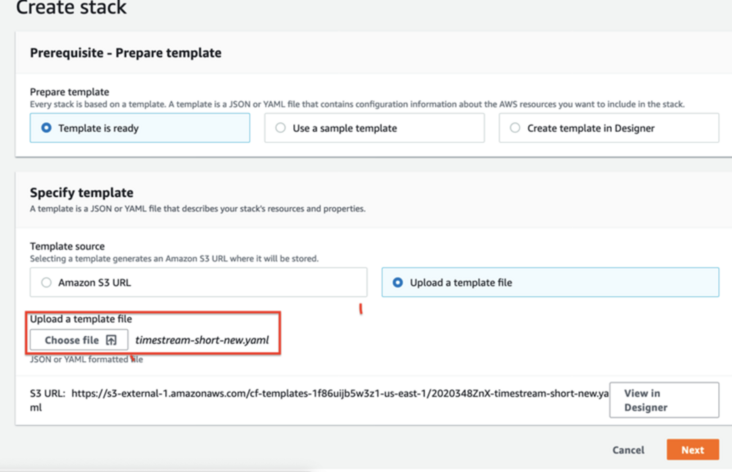
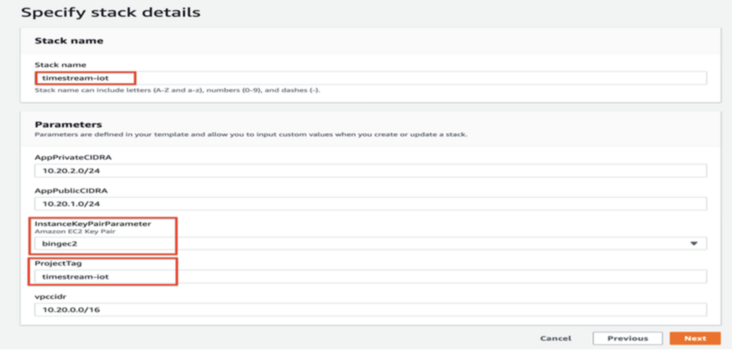
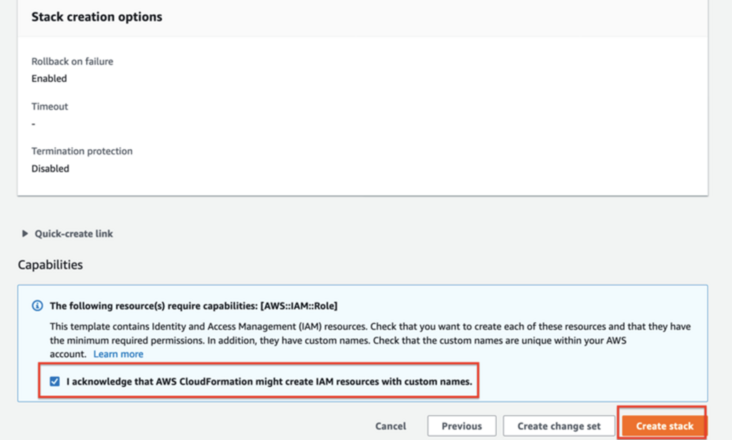
Select the default for all others, and click Create Stack button
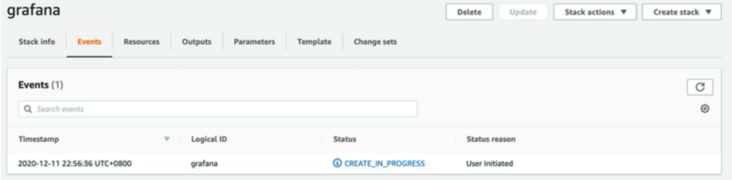
Cloud Formation created successfully
1.2 connect to the newly built Ec2 fortress machine:
Modify certificate file permissions
chmod 0600 [path to downloaded .pem file]ssh -i [path to downloaded .pem file] ec2-user@[bastionEndpoint]
Execute aws configure:
aws configure
default region name, enter: "us-east-1", and select other default settings.
1.3 connect to EC2 fortress machine and install corresponding software
Set time zone
TZ='Asia/Shanghai'; export TZ
Install python3
sudo yum install -y python3
Install python3 pip
sudo yum install -y python3-pip
pip3 install boto3
sudo pip3 install boto3
pip3 install numpy
sudo pip3 install numpy
install git
sudo yum install -y git
1.4 download GitHub timestream sample library
git clone https://github.com/awslabs/amazon-timestream-tools amazon-timestream-tools
1.5 installing Grafana Server
Connect to EC2 fortress machine:
sudo vi /etc/yum.repos.d/grafana.repo
For OSS releases: (copy the following to grafana.repo)
[grafana]
name=grafana
baseurl=https://packages.grafana.com/oss/rpm
repo_gpgcheck=1
enabled=1
gpgcheck=1
gpgkey=https://packages.grafana.com/gpg.key
sslverify=1
sslcacert=/etc/pki/tls/certs/ca-bundle.crt
Installing grafana server:
sudo yum install -y grafana
Start grafana server:
sudo service grafana-server start
sudo service grafana-server status
Configure grafana server to start automatically when the operating system starts:
sudo /sbin/chkconfig --add grafana-server
1.6 installing timestream Plugin
sudo grafana-cli plugins install grafana-timestream-datasource
Restart grafana
sudo service grafana-server restart
1.7. Configure the IAM Role used by Grafana to access the timestream service
Get IAM Role Name
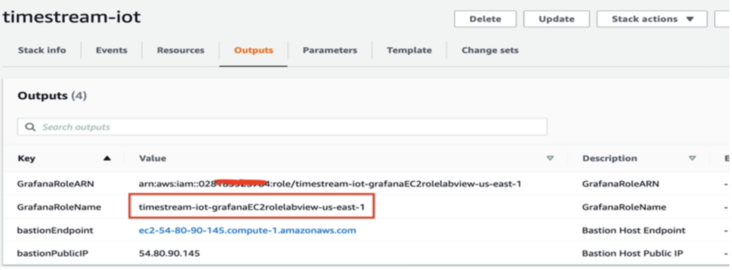
Select the IAM service and the role to modify. Role name:
timestream-iot-grafanaEC2rolelabview-us-east-1
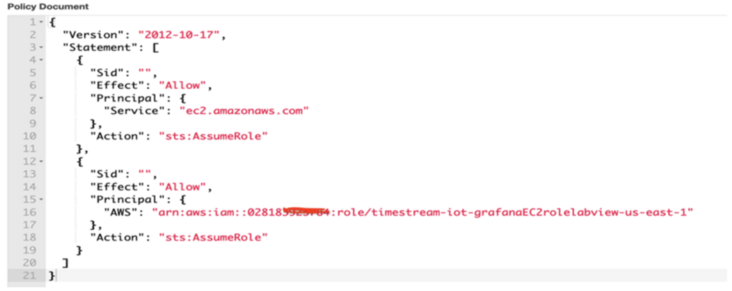
Modify role trust relationship:
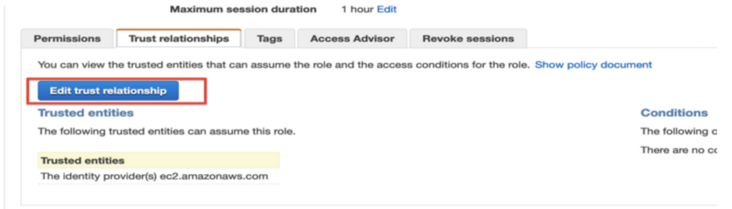
Select all policy documents and replace with the following:
{
  "Version": "2012-10-17",
  "Statement": [
    {
      "Sid":"",
      "Effect": "Allow",
      "Principal": {
        "Service": "ec2.amazonaws.com"
      },
      "Action": "sts:AssumeRole"
    },
    {
      "Sid":"",
      "Effect": "Allow",
      "Principal": {
        "AWS": "[Please replace with CloudFormation output Medium role arn]"
      },
      "Action": "sts:AssumeRole"
    }
  ]
}
Modified trust relationship:
1.8 log in to Grafana server
First login to Grafana Server:
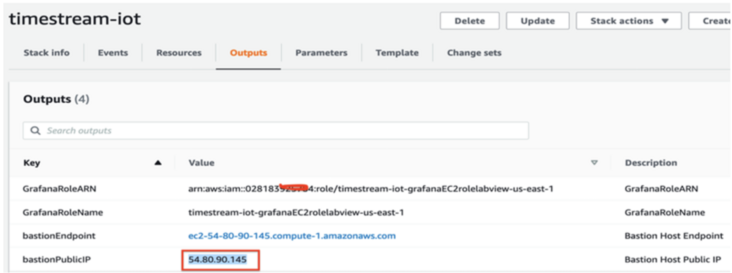
- Open the browser and visit http://[Grafana: server public ip]:3000
- The default listening port of Grafana Server is 3000
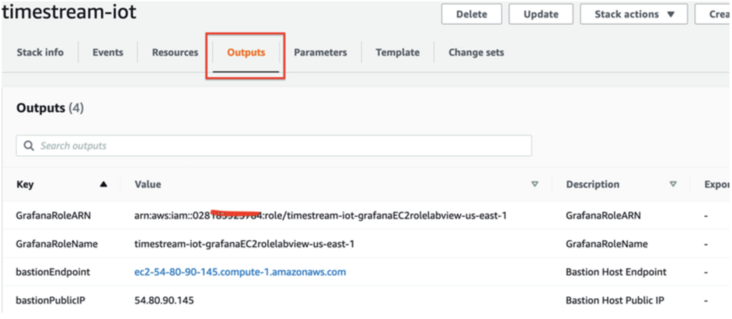
How to obtain Ec2 Public IP address, as shown in the figure below, access Cloudformation output:
- In the login interface, enter username: admin; password:admin. (both the user name and password entered are admin)
- Click Log In After successful login, you will be prompted to change your password
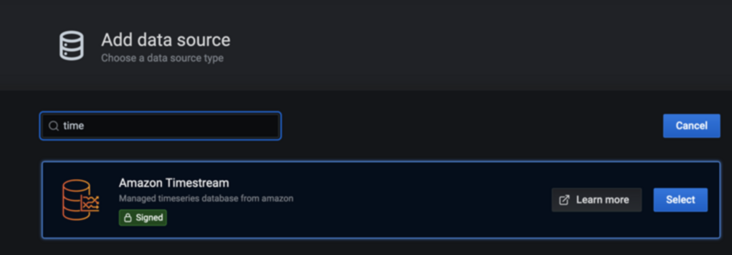
1.9 add Timestream data source in grafana server
Add Timestream data source
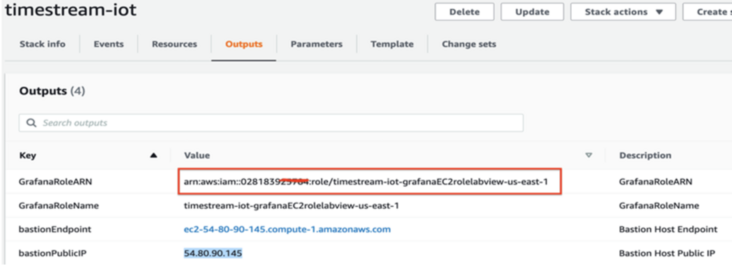
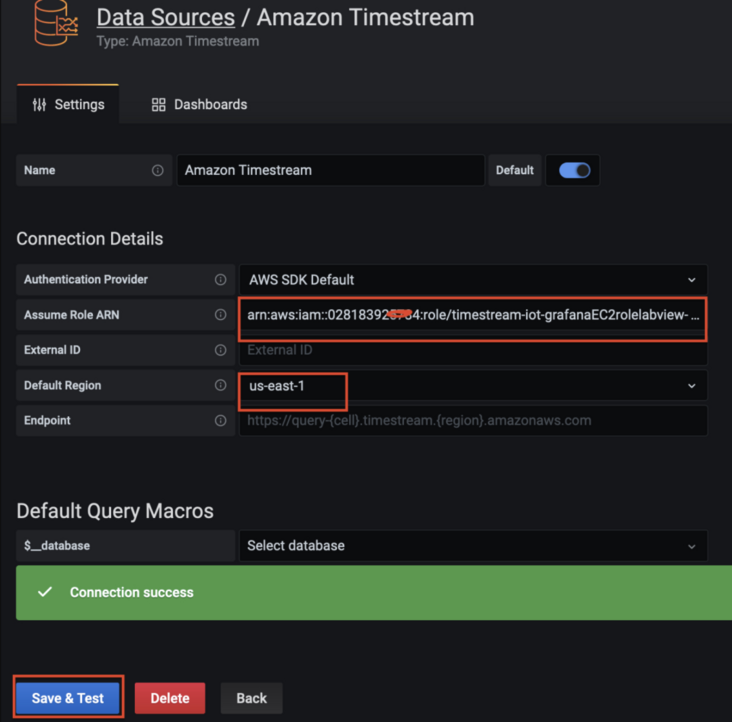
1.10 configure Timestream data source in grafana server
Copy the role ARN information required for configuration (from the cloudformation output tab) Default Region: us-east-1
IoT data storage
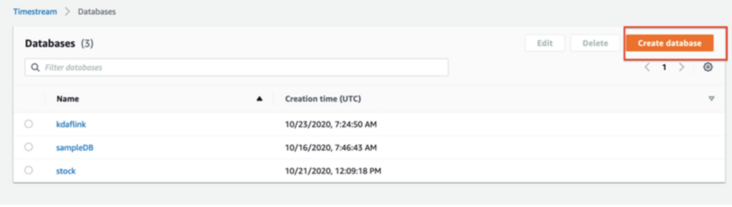
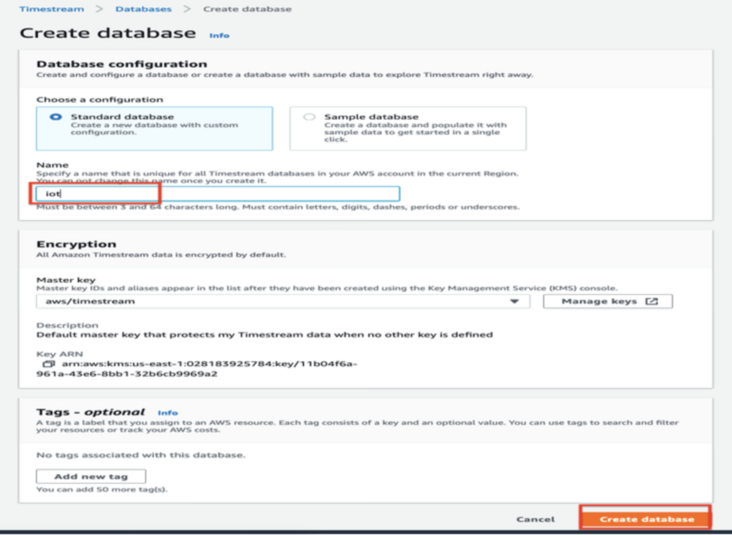
2.1 create Timestream database iot
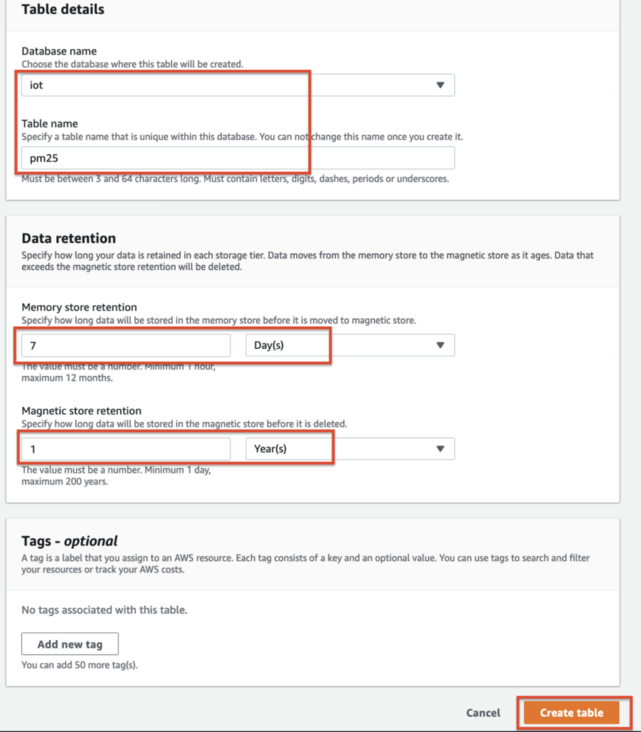
2.2 create Timestream table pm25
IoT data import
3.1 installing Flink connector to Timestream
Install java8
sudo yum install -y java-1.8.0-openjdk*
java -version
Install debug info, otherwise jmap will throw exception
sudo yum --enablerepo='*-debug*' install -y java-1.8.0-openjdk-debuginfo
Install maven
sudo wget https://repos.fedorapeople.org/repos/dchen/apache-maven/epel-apache-maven.repo -O /etc/yum.repos.d/epel-apache-maven.repo
sudo sed -i s/\$releasever/6/g /etc/yum.repos.d/epel-apache-maven.repo
sudo yum install -y apache-maven
mvn --version
change java version from 1.7 to 1.8
sudo update-alternatives --config java
sudo update-alternatives --config javac
Install Apache Flink
The latest version of Apache Flink supports Kinesis Data Analytics, which is 1.8 two
1. Create flink folder
cd
mkdir flink
cd flink
2. Download Apache Flink version 1.8 2 source code:
wget https://archive.apache.org/dist/flink/flink-1.8.2/flink-1.8.2-src.tgz
3. Unzip Apache Flink source code:
tar -xvf flink-1.8.2-src.tgz
4. Enter Apache Flink source code directory:
cd flink-1.8.2
5. Compile and install Apache Flink (the compilation time is relatively long and takes about 20 minutes):
mvn clean install -Pinclude-kinesis -DskipTests
3.2 create Kinesis Data Stream Timestreampm25Stream
aws kinesis create-stream --stream-name Timestreampm25Stream --shard-count 1
3.3 run Flink Connector to establish Kinesis connection to Timestream:
cd
cd amazon-timestream-tools/integrations/flink_connector
mvn clean compile
Please run the following command continuously during data collection:
mvn exec:java -Dexec.mainClass="com.amazonaws.services.kinesisanalytics.StreamingJob" -Dexec.args="--InputStreamName
Timestreampm25Stream --Region us-east-1 --TimestreamDbName iot --TimestreamTableName pm25"
3.4 preparation of PM2 5 presentation data:
Connect to EC2 fortress machine
1. Download 5 demo data generator:
cd
mkdir pm25
cd pm25
wget https://bigdata-bingbing.s3-ap-northeast-1.amazonaws.com/pm25_new_kinisis_test.py .
2. Run 5 demo data generation program (2 parameters of python program – region default: us-east-1; – stream default: timestream m25stream)
Please run the following command continuously during data collection:
python3 pm25_new_kinisis_test.py
IoT data analysis
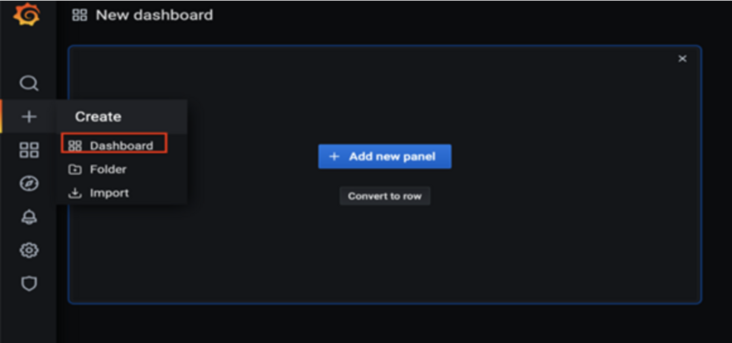
4.1} log in to Grafana Server to create dashboard and Panel
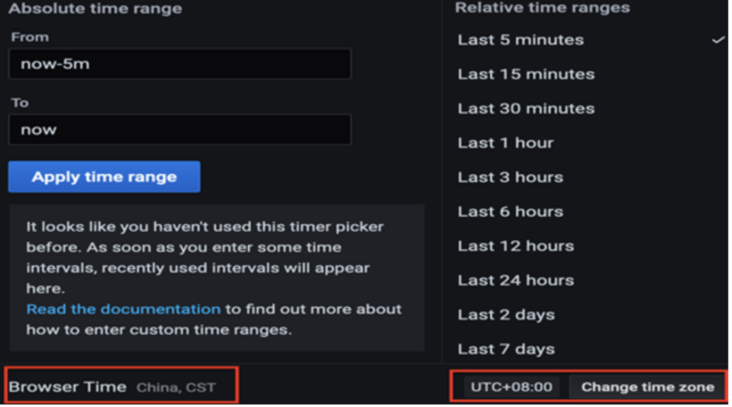
When creating a Dashboard query, please set the time zone to the local browser time zone:
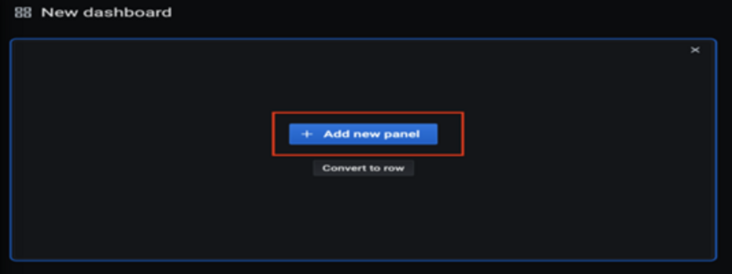
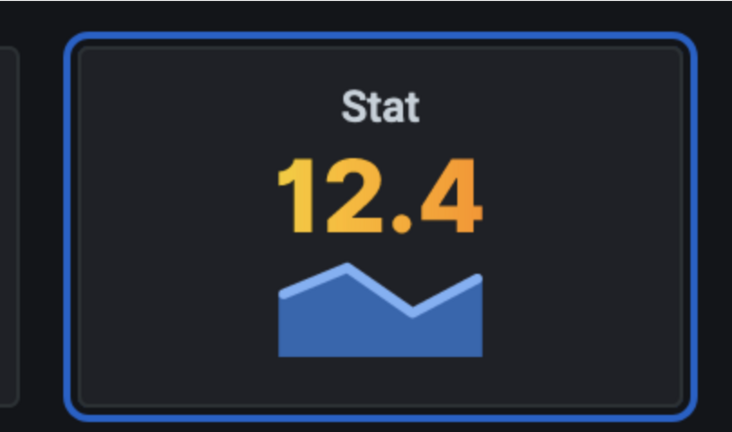
Create a new Panel:
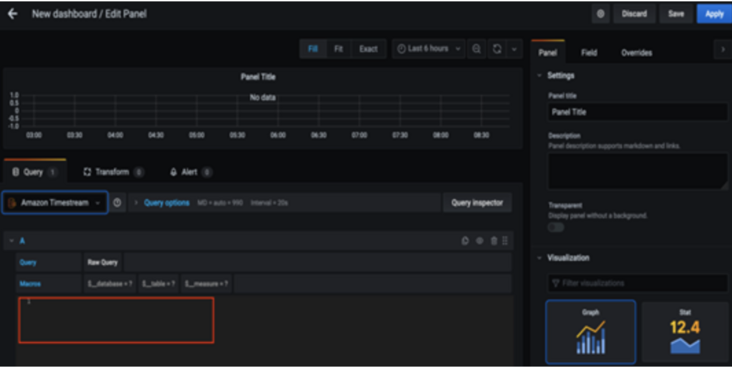
Select the data source to access, and paste the SQL statement to be executed by query analysis into the new Panel:
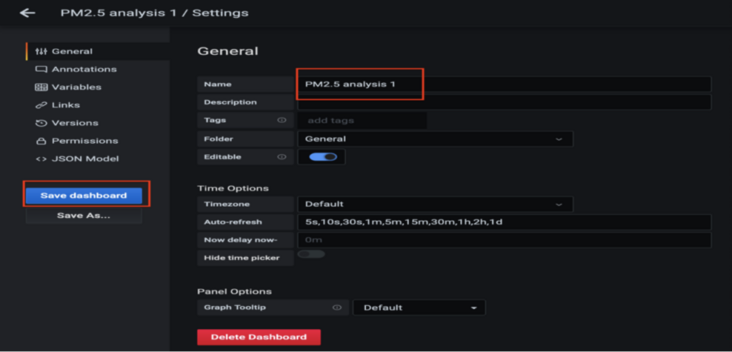
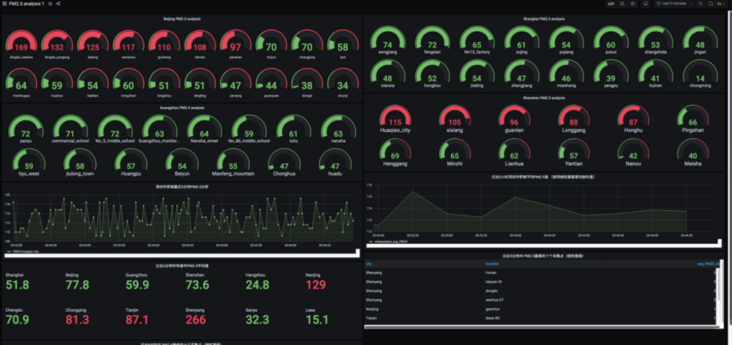
4.2 create time data analysis dashboard PM2 5 Analysis 1(Save as PM2.5 Analysis 1)
4.2. 1 query PM2 of various monitoring stations in Beijing 5 average
New Panel
SELECT CASE WHEN location = 'fengtai_xiaotun' THEN avg_pm25 ELSE NULL END AS fengtai_xiaotou,
CASE WHEN location = 'fengtai_yungang' THEN avg_pm25 ELSE NULL END AS fengtai_yungang,
CASE WHEN location = 'daxing' THEN avg_pm25 ELSE NULL END AS daxing,
CASE WHEN location = 'wanshou' THEN avg_pm25 ELSE NULL END AS wanshou,
CASE WHEN location = 'gucheng' THEN avg_pm25 ELSE NULL END AS gucheng,
CASE WHEN location = 'tiantan' THEN avg_pm25 ELSE NULL END AS tiantan,
CASE WHEN location = 'yanshan' THEN avg_pm25 ELSE NULL END AS yanshan,
CASE WHEN location = 'miyun' THEN avg_pm25 ELSE NULL END AS miyun,
CASE WHEN location = 'changping' THEN avg_pm25 ELSE NULL END AS changping,
CASE WHEN location = 'aoti' THEN avg_pm25 ELSE NULL END AS aoti,
CASE WHEN location = 'mengtougou' THEN avg_pm25 ELSE NULL END AS mentougou,
CASE WHEN location = 'huairou' THEN avg_pm25 ELSE NULL END AS huairou,
CASE WHEN location = 'haidian' THEN avg_pm25 ELSE NULL END AS haidian,
CASE WHEN location = 'nongzhan' THEN avg_pm25 ELSE NULL END AS nongzhan,
CASE WHEN location = 'tongzhou' THEN avg_pm25 ELSE NULL END AS tongzhou,
CASE WHEN location = 'dingling' THEN avg_pm25 ELSE NULL END AS dingling,
CASE WHEN location = 'yanqing' THEN avg_pm25 ELSE NULL END AS yanqing,
CASE WHEN location = 'guanyuan' THEN avg_pm25 ELSE NULL END AS guanyuan,
CASE WHEN location = 'dongsi' THEN avg_pm25 ELSE NULL END AS dongsi,
CASE WHEN location = 'shunyi' THEN avg_pm25 ELSE NULL END AS shunyiFROM
(SELECT location, round(avg(measure_value::bigint),0) as avg_pm25
FROM "iot"."pm25"
where measure_name='pm2.5'
and city='Beijing'
and time >= ago(30s)
group by location,bin(time,30s)
order by avg_pm25 desc)
Select the graph to display select Gauge
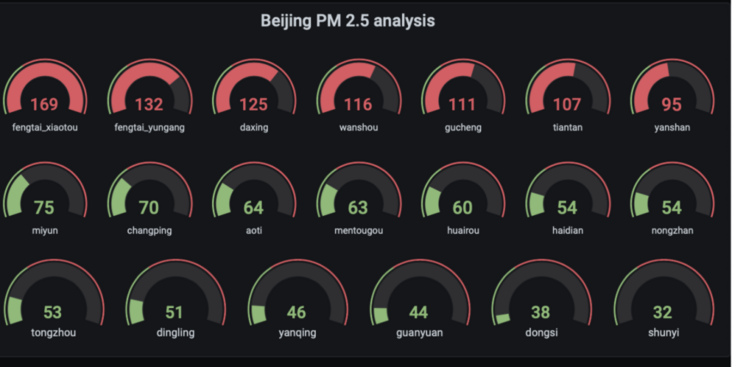
Save Panel as Beijing PM2.5 analysis
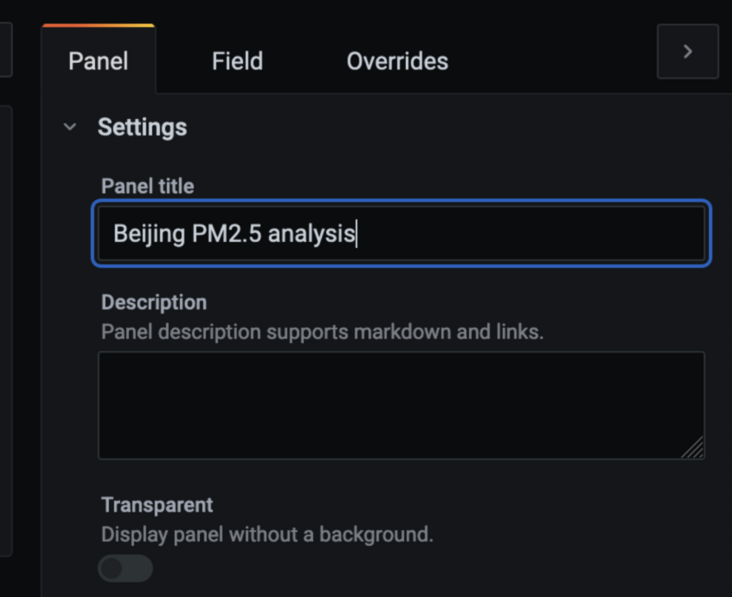
Edit Panel Title: Beijing PM2.5 analysis
Save Dashboard PM2.5 analysis 1:
4.2. 2. Query PM2 of each monitoring station in a day in Shanghai 5 average
New Panel
SELECT CASE WHEN location = 'songjiang' THEN avg_pm25 ELSE NULL END AS songjiang,
CASE WHEN location = 'fengxian' THEN avg_pm25 ELSE NULL END AS fengxian,
CASE WHEN location = 'no 15 factory' THEN avg_pm25 ELSE NULL END AS No15_factory,
CASE WHEN location = 'xujing' THEN avg_pm25 ELSE NULL END AS xujing,
 CASE WHEN location = 'pujiang' THEN avg_pm25 ELSE NULL END AS pujiang,
 CASE WHEN location = 'putuo' THEN avg_pm25 ELSE NULL END AS putuo,
 CASE WHEN location = 'shangshida' THEN avg_pm25 ELSE NULL END AS shangshida,
CASE WHEN location = 'jingan' THEN avg_pm25 ELSE NULL END AS jingan,
CASE WHEN location = 'xianxia' THEN avg_pm25 ELSE NULL END AS xianxia,
CASE WHEN location = 'hongkou' THEN avg_pm25 ELSE NULL END AS hongkou,
CASE WHEN location = 'jiading' THEN avg_pm25 ELSE NULL END AS jiading,
CASE WHEN location = 'zhangjiang' THEN avg_pm25 ELSE NULL END AS zhangjiang,
CASE WHEN location = 'miaohang' THEN avg_pm25 ELSE NULL END AS miaohang,
CASE WHEN location = 'yangpu' THEN avg_pm25 ELSE NULL END AS yangpu,
CASE WHEN location = 'huinan' THEN avg_pm25 ELSE NULL END AS huinan,
CASE WHEN location = 'chongming' THEN avg_pm25 ELSE NULL END AS chongming
From(
SELECT location, round(avg(measure_value::bigint),0) as avg_pm25
FROM "iot"."pm25"
where measure_name='pm2.5'
and city='Shanghai'
and time >= ago(30s)
group by location,bin(time,30s)
order by avg_pm25 desc)
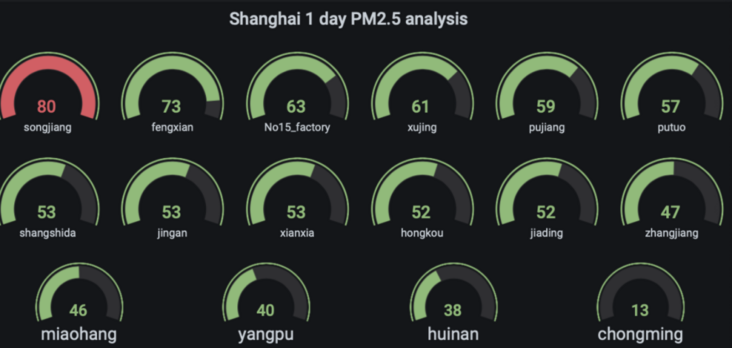
Save Panel as Shanghai PM2.5 analysis
Edit Panel Title: Shanghai PM2.5 analysis
Save Dashboard PM2.5 analysis 1
4.2. 3. Query PM2 of various monitoring stations in Guangzhou 5 average
New Panel
SELECT CASE WHEN location = 'panyu' THEN avg_pm25 ELSE NULL END AS panyu,
CASE WHEN location = 'commercial school' THEN avg_pm25 ELSE NULL END AS commercial_school,
CASE WHEN location = 'No 5 middle school' THEN avg_pm25 ELSE NULL END AS No_5_middle_school,
CASE WHEN location = 'guangzhou monitor station' THEN avg_pm25 ELSE NULL END AS Guangzhou_monitor_station,
CASE WHEN location = 'nansha street' THEN avg_pm25 ELSE NULL END AS Nansha_street,
CASE WHEN location = 'No 86 middle school' THEN avg_pm25 ELSE NULL END AS No_86_middle_school,
CASE WHEN location = 'luhu' THEN avg_pm25 ELSE NULL END AS luhu,
CASE WHEN location = 'nansha' THEN avg_pm25 ELSE NULL END AS nansha,
CASE WHEN location = 'tiyu west' THEN avg_pm25 ELSE NULL END AS tiyu_west,
CASE WHEN location = 'jiulong town' THEN avg_pm25 ELSE NULL END AS jiulong_town,
CASE WHEN location = 'huangpu' THEN avg_pm25 ELSE NULL END AS Huangpu,
CASE WHEN location = 'baiyun' THEN avg_pm25 ELSE NULL END AS Baiyun,
CASE WHEN location = 'maofeng mountain' THEN avg_pm25 ELSE NULL END AS Maofeng_mountain,
CASE WHEN location = 'chong hua' THEN avg_pm25 ELSE NULL END AS Chonghua,
CASE WHEN location = 'huadu' THEN avg_pm25 ELSE NULL END AS huadu
from(
    SELECT location, round(avg(measure_value::bigint),0) as avg_pm25
FROM "iot"."pm25"
where measure_name='pm2.5'
and city='Guangzhou'
and time >= ago(30s)
group by location,bin(time,30s)
order by avg_pm25 desc)
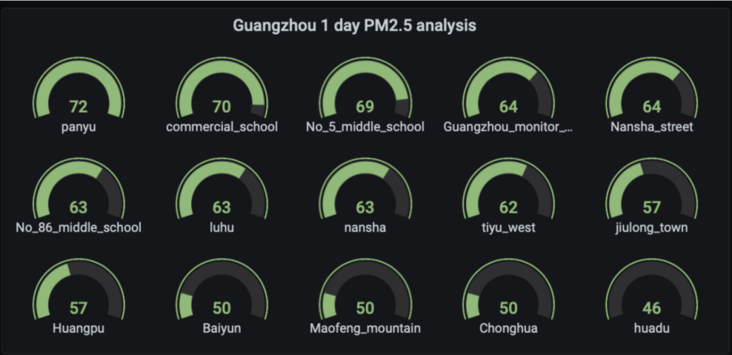
Save Panel as Guangzhou PM2.5 analysis
Edit Panel Title: Guangzhou PM2.5 analysis
Save Dashboard PM2.5 analysis 1
4.2. 4. Query PM2 of various monitoring stations in Shenzhen 5 average
New Panel
SELECT CASE WHEN location = 'huaqiao city' THEN avg_pm25 ELSE NULL END AS Huaqiao_city,
 CASE WHEN location = 'xixiang' THEN avg_pm25 ELSE NULL END AS xixiang,
CASE WHEN location = 'guanlan' THEN avg_pm25 ELSE NULL END AS guanlan,
CASE WHEN location = 'longgang' THEN avg_pm25 ELSE NULL END AS Longgang,
CASE WHEN location = 'honghu' THEN avg_pm25 ELSE NULL END AS Honghu,
CASE WHEN location = 'pingshan' THEN avg_pm25 ELSE NULL END AS Pingshan,
CASE WHEN location = 'henggang' THEN avg_pm25 ELSE NULL END AS Henggang,
CASE WHEN location = 'minzhi' THEN avg_pm25 ELSE NULL END AS Minzhi,
CASE WHEN location = 'lianhua' THEN avg_pm25 ELSE NULL END AS Lianhua,
CASE WHEN location = 'yantian' THEN avg_pm25 ELSE NULL END AS Yantian,
CASE WHEN location = 'nanou' THEN avg_pm25 ELSE NULL END AS Nanou,
CASE WHEN location = 'meisha' THEN avg_pm25 ELSE NULL END AS Meisha
From(
SELECT location, round(avg(measure_value::bigint),0) as avg_pm25
FROM "iot"."pm25"
where measure_name='pm2.5'
and city='Shenzhen'
and time >= ago(30s)
group by location,bin(time,30s)
order by avg_pm25 desc)
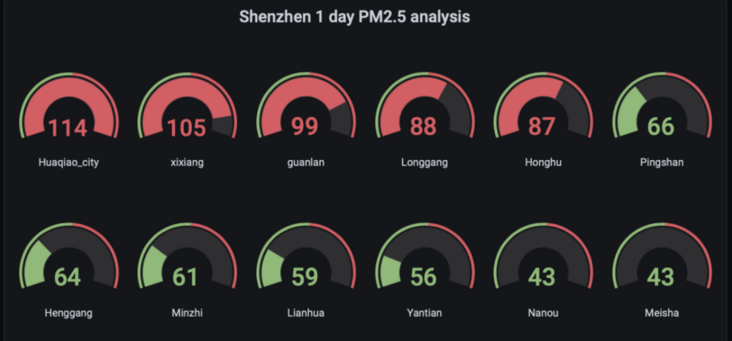
Save Panel as Shenzhen PM2.5 analysis
Edit Panel Title: Shenzhen PM2.5 analysis
Save Dashboard PM2.5 analysis 1
4.2. 5 Shenzhen OCT time series analysis (PM2.5 analysis in the last 5 minutes)
New Panel
select location, CREATE_TIME_SERIES(time, measure_value::bigint) as PM25 FROM iot.pm25
where measure_name='pm2.5'
and location='huaqiao city'
and time >= ago(5m)
GROUP BY location
Select graphic display select Lines; Select Points:
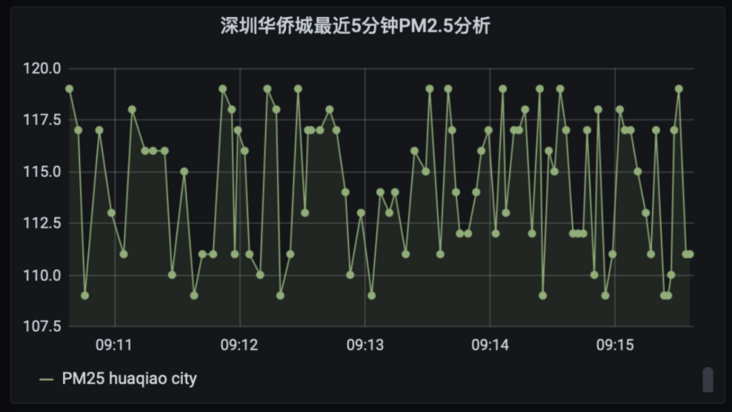
Save Panel as Shen Zhen Huaqiao City PM2.5 analysis
Edit Panel Title: Shenzhen OCT PM2 in the last 5 minutes 5 Analysis
Save Dashboard PM2.5 analysis 1
4.2. 6 find out the average PM2 of OCT Shenzhen at an interval of 30 seconds in the past 2 hours 5 values (fill missing values with linear interpolation)
New Panel
WITH binned_timeseries AS (
    SELECT location, BIN(time, 30s) AS binned_timestamp, ROUND(AVG(measure_value::bigint), 2) AS avg_PM25
    FROM "iot".pm25
    WHERE measure_name = 'pm2.5'
        AND location='huaqiao city'
        AND time > ago(2h)
    GROUP BY location, BIN(time, 30s)
), interpolated_timeseries AS (
    SELECT location,
        INTERPOLATE_LINEAR(
            CREATE_TIME_SERIES(binned_timestamp, avg_PM25),
                SEQUENCE(min(binned_timestamp), max(binned_timestamp), 30s)) AS interpolated_avg_PM25
    FROM binned_timeseries
    GROUP BY location
)
SELECT time, ROUND(value, 2) AS interpolated_avg_PM25
FROM interpolated_timeseries
CROSS JOIN UNNEST(interpolated_avg_PM25)
Select graphic display select Lines:
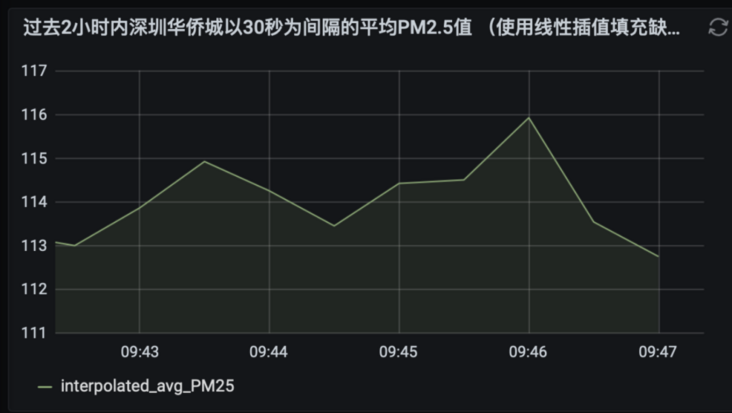
Save Panel as Shen Zhen Huaqiao City PM2.5 analysis 1
Edit Panel Title: the average PM2 of OCT in Shenzhen in the past 2 hours 5 values (fill missing values with linear interpolation)
Save Dashboard PM2.5 analysis 1
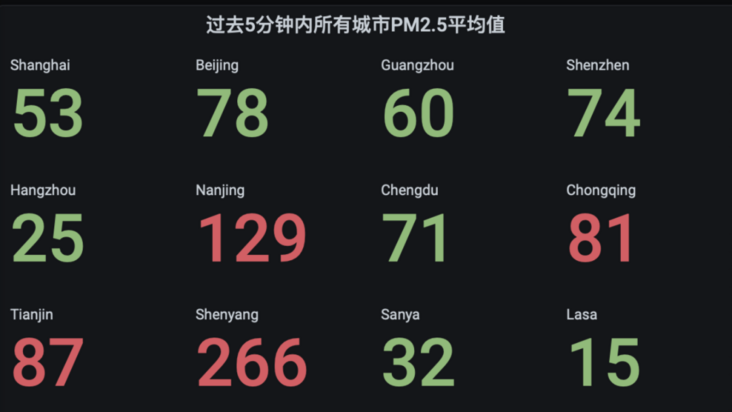
4.2. 7 PM2 in all cities in the past 5 minutes 5 average ranking (linear interpolation)
New Panel
SELECT CASE WHEN city = 'Shanghai' THEN inter_avg_PM25 ELSE NULL END AS Shanghai,
CASE WHEN city = 'Beijing' THEN inter_avg_PM25 ELSE NULL END AS Beijing,
CASE WHEN city = 'Guangzhou' THEN inter_avg_PM25 ELSE NULL END AS Guangzhou,
CASE WHEN city = 'Shenzhen' THEN inter_avg_PM25 ELSE NULL END AS Shenzhen,
CASE WHEN city = 'Hangzhou' THEN inter_avg_PM25 ELSE NULL END AS Hangzhou,
CASE WHEN city = 'Nanjing' THEN inter_avg_PM25 ELSE NULL END AS Nanjing,
CASE WHEN city = 'Chengdu' THEN inter_avg_PM25 ELSE NULL END AS Chengdu,
CASE WHEN city = 'Chongqing' THEN inter_avg_PM25 ELSE NULL END AS Chongqing,
CASE WHEN city = 'Tianjin' THEN inter_avg_PM25 ELSE NULL END AS Tianjin,
CASE WHEN city = 'Shenyang' THEN inter_avg_PM25 ELSE NULL END AS Shenyang,
CASE WHEN city = 'Sanya' THEN inter_avg_PM25 ELSE NULL END AS Sanya,
CASE WHEN city = 'Lasa' THEN inter_avg_PM25 ELSE NULL END AS Lasa
from(
WITH binned_timeseries AS (
    SELECT city,location, BIN(time, 30s) AS binned_timestamp, ROUND(AVG(measure_value::bigint), 2) AS avg_PM25
    FROM "iot".pm25
    WHERE measure_name = 'pm2.5'
        AND time > ago(5m)
    GROUP BY city,location, BIN(time, 30s)
), interpolated_timeseries AS (
    SELECT city,location,
        INTERPOLATE_LINEAR(
            CREATE_TIME_SERIES(binned_timestamp, avg_PM25),
                SEQUENCE(min(binned_timestamp), max(binned_timestamp), 30s)) AS interpolated_avg_PM25
    FROM binned_timeseries
    GROUP BY city,location
), all_location_interpolated as (
SELECT city,location,time, ROUND(value, 2) AS interpolated_avg_PM25
FROM interpolated_timeseries
CROSS JOIN UNNEST(interpolated_avg_PM25))
select city,avg(interpolated_avg_PM25) AS inter_avg_PM25
from all_location_interpolated
group by city
order by avg(interpolated_avg_PM25) desc)
Select Panel graphic type:
Save Panel as all city analysis 1
Edit Panel Title: PM2 in all cities in the past 5 minutes 5 average
Save Dashboard PM2.5 analysis 1
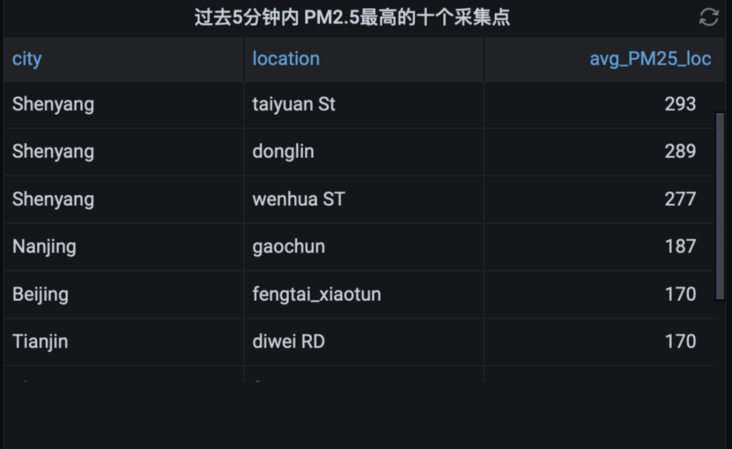
4.2. 8 PM2 in the past 5 minutes 5 top ten acquisition points (linear interpolation)
New Panel
WITH binned_timeseries AS (
    SELECT city,location, BIN(time, 30s) AS binned_timestamp, ROUND(AVG(measure_value::bigint), 2) AS avg_PM25
    FROM "iot".pm25
    WHERE measure_name = 'pm2.5'
        AND time > ago(5m)
    GROUP BY city,location, BIN(time, 30s)
), interpolated_timeseries AS (
    SELECT city,location,
        INTERPOLATE_LINEAR(
            CREATE_TIME_SERIES(binned_timestamp, avg_PM25),
                SEQUENCE(min(binned_timestamp), max(binned_timestamp), 30s))
                AS interpolated_avg_PM25
    FROM binned_timeseries
    GROUP BY city,location
), interpolated_cross_join as (
SELECT city,location,time, ROUND(value, 2) AS interpolated_avg_PM25
FROM interpolated_timeseries
CROSS JOIN UNNEST(interpolated_avg_PM25))
select city,location, avg(interpolated_avg_PM25) as avg_PM25_loc
from interpolated_cross_join
group by city,location
order by avg_PM25_loc desc
limit 10
Select Table
Save Panel as all city analysis 2
Edit Panel Title: PM2 in the past 5 minutes 5 top ten acquisition points (linear interpolation)
Save Dashboard PM2.5 analysis 1
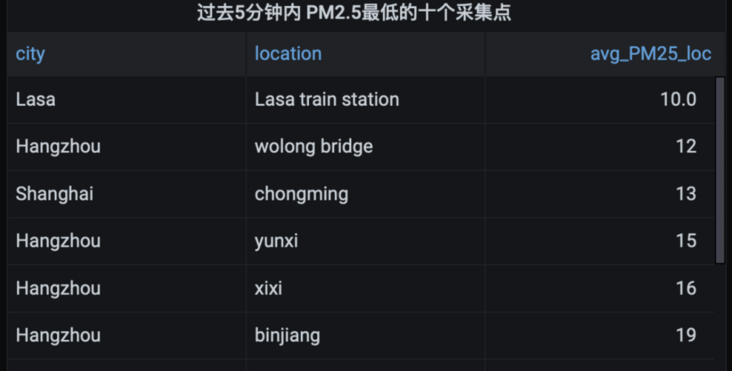
4.2. 9 PM2 in the past 5 minutes 5 lowest ten acquisition points (linear interpolation)
New Panel
WITH binned_timeseries AS (
    SELECT city,location, BIN(time, 30s) AS binned_timestamp, ROUND(AVG(measure_value::bigint), 2) AS avg_PM25
    FROM "iot".pm25
    WHERE measure_name = 'pm2.5'
        AND time > ago(5m)
    GROUP BY city,location, BIN(time, 30s)
), interpolated_timeseries AS (
    SELECT city,location,
        INTERPOLATE_LINEAR(
            CREATE_TIME_SERIES(binned_timestamp, avg_PM25),
                SEQUENCE(min(binned_timestamp), max(binned_timestamp), 30s))
                AS interpolated_avg_PM25
    FROM binned_timeseries
    GROUP BY city,location
), interpolated_cross_join as (
SELECT city,location,time, ROUND(value, 2) AS interpolated_avg_PM25
FROM interpolated_timeseries
CROSS JOIN UNNEST(interpolated_avg_PM25))
select city,location, avg(interpolated_avg_PM25) as avg_PM25_loc
from interpolated_cross_join
group by city,location
order by avg_PM25_loc asc
limit 10
Select Table
Save Panel as all city analysis 3
Edit Panel Title: PM2 in the past 5 minutes 5 lowest ten acquisition points (linear interpolation)
Save Dashboard PM2.5 analysis 1
Set the dashboard to refresh every 5 seconds:
This blog focuses on using Timestream Kinesis Stream Hosting Service and Grafana realize the Internet of things (take PM 2.5 scenario as an example) real time collection, storage and analysis of time series data, including deployment architecture, environment deployment, data collection, data storage and analysis. I hope you can be inspired when you have similar time series data storage and analysis requirements of the Internet of things, so as to realize the efficient management of time series data of the Internet of things and mine the laws, patterns and prices contained in the Internet of things data Value and help business development.
Appendix:
Amazon Timestream developer's Guide
https://docs.aws.amazon.com/z...
Amazon Timestream developer example
https://github.com/awslabs/am...
Amazon Timestream and Grafana integration example
https://docs.aws.amazon.com/z...
Author: Liu Bingbing

Amazon cloud technology database solution architect is responsible for consulting and architecture design of database solutions based on Amazon cloud technology, and is committed to the research and promotion of big data. Before joining Amazon cloud technology, he worked in Oracle for many years and has rich experience in database cloud planning, design, operation and maintenance tuning, DR solutions, big data, data warehouse and enterprise applications.