
In this blog post, We will describe in detail how to use Amazon Cloud Formation and Amazon Neptune to rebuild Amazon cloud technology COVID-19 knowledge map (CKG) and how to use the Jupiter notebook hosted on Amazon SageMaker in Amazon cloud technology account. The COVID-19 knowledge map can help us explore and analyze the COVID-19 open research dataset hosted in Amazon cloud technology COVID-19 data lake (CORD-19). The strength of the map is determined by academic literature, authors, scientific concepts and the association between institutions. In addition, the COVID-19 knowledge map also provides a technical basis for the search page of CORD-19.
Amazon cloud technology covid-19 data lake is a public centralized repository, It contains the latest data set on New Coronavirus's (SARS-CoV-2) and its related diseases COVID-19's propagation, characteristics and other public information. For more details, please refer to the open data lake for COVID-19 data analysis and explore Amazon cloud technology COVID-19 public data lake.
The COVID-19 knowledge map is constructed from Amazon Neptune, the CORD-19 dataset, and annotations from Amazon comprehensive medical. As of April 17, 2020, the core-19 data set contains more than 52000 academic literatures, of which 41000 are included in the full text. These data come from multiple channels, including PubMed, bioArxiv and medRxiv. With the close cooperation between Allen Institute of artificial intelligence and the research industry, the scale of data sets is still growing, and the work of information standardization and data quality improvement is also advancing steadily. This data set covers many disciplines, mainly covering statistical data at the level of Virology, translational medicine and epidemiology.
📢 To learn more about the latest technology release and practical innovation of Amazon cloud technology, please pay attention to the 2021 Amazon cloud technology China Summit held in Shanghai, Beijing and Shenzhen! Click the picture to sign up ~ the Shanghai station summit has been successfully concluded. For more wonderful contents, please look forward to the Beijing and Shenzhen chapters!
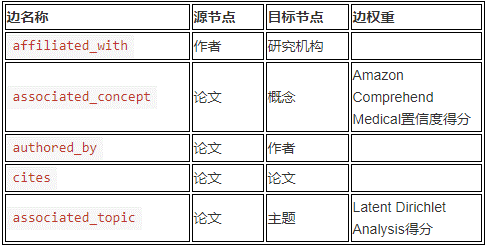
Figure structure
COVID-19 knowledge map belongs to directed graph. The following table summarizes the relationship between nodes and edges. Each directed edge points from the source node to the target node with the specified edge weight.
The following figure shows the example map in 123. Please note the connections extending from the Paper node to the Author and Concept nodes, as well as the connections from the Author node to the Institution node.
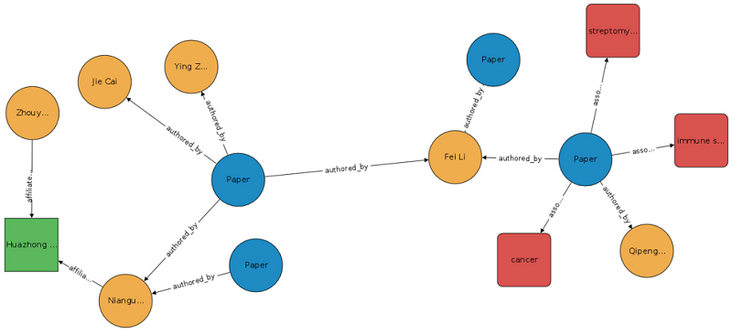
The blue node in the figure represents the paper, which is written by the author represented by the Yellow node, and the author belongs to the research institution represented by the green node. A paper can have multiple authors, and these authors may belong to multiple research institutions.
The concept node (red node) is generated by Amazon comprehensive medical detect entities V2 by extracting various medical information, including medical status, drug dose, anatomical information, treatment procedure and drug type.
Topic node (not shown in the figure above) is generated by the extended Latent Dirichlet allocation model. This generation model groups the documents according to the observed contents and assigns a topic vector mixing index to each document. For each paper, the model refers to the plain text title, abstract and body part, while ignoring tables, numbers and Bibliography, etc.
By linking the author, research institution, thesis and thesis theme, these nodes together constitute a rich atlas system.
Solution overview
In Amazon cloud technology data lake, we can use the built-in Amazon CloudFormation template to create an Amazon CloudFormation stack. Amazon CloudFormation stack is a collection of Amazon cloud technology resources that can be managed independently as a unit. For more details, see how to use the stack.
To build the COVID-19 knowledge map, we need to create a set of Amazon CloudFormation stacks using preset templates. The template is responsible for creating the necessary Amazon cloud technology resources and capturing data to add to the map.
After completing the construction of COVID-19 knowledge map in Amazon cloud technology account, we can run various basic and advanced queries using gremlin python.
Basic query includes the exploration and search of the atlas. The purpose is to establish a preliminary understanding of the contents of the atlas, and skillfully use gremlin Python to query the atlas.
In terms of advanced query, the specific operations involved in this paper include:
- Query the COVID-19 knowledge map to obtain papers related to specific concepts.
- Rank the papers according to the author's professional level and determine the papers that need to be read first.
- The graph query mechanism is used to create a relevant paper recommendation engine to determine the papers to be read next.
precondition
Before starting this round of drill, you need to meet the following prerequisites:
- Visit Amazon cloud account.
- Have permission to create Amazon CloudFormation stack.
Using the Amazon CloudFormation template
To configure the map and sample query notebook in your Amazon cloud technology account, we first need to create an Amazon CloudFormation stack using the Amazon CloudFormation template.
Start the following one click template and use the following parameters when prompted during stack creation (other parameters not mentioned remain the default values): AutoIngestData: True
The template automatically completes the following operations:
- Create an Amazon Neptune database cluster.
- Create a Virtual Private Cloud (VPC).
All Amazon Neptune clusters must run in the VPC, so the template will also set up private and public subnets in the VPC to ensure that Amazon Neptune will not be affected by unauthorized access while accessing the Internet normally.
- Create an Amazon SageMaker notebook instance and allow it to access the Amazon Neptune cluster in the VPC through permission settings.
The entire stack loads a large number of Python libraries into notebook instances to help users interact with graphics.
This notebook instance also includes a Jupiter demo notebook to show how to implement map query.
- Take the data into the map. All data in this atlas will be stored in the open Amazon cloud COVID-19 data lake.
After the template operation is completed, we can access the Amazon SageMaker notebook instance and the Jupyter notebook example. For more specific instructions, see accessing a Notebook instance.
Amazon Neptune and Gremlin
Amazon Neptune is fully compatible with Apache TinkerPop3 and gremlin 3.4 1. Therefore, you can directly query Amazon Neptune database instances using gremlin graph traversal language. Gremlin Python implements gremlin in the python language. For more details about gremlin, please refer to the gremlin practice: Apache TInkerPop tutorial.
We can query Amazon Neptune directly through Gremlin python. For more details, see accessing Amazon Neptune diagrams using Gremlin.
Basic query
The following basic queries show how to use gremlin Python to realize basic graph browsing and search in Amazon sagemaker Jupiter notebook. Through the operations described above, we have successfully completed the creation of Amazon SageMaker notebook instance, in which you can perform various query operations. Note that your actual output may differ from the output listed in this article because the dataset is still evolving.
Figure exploration
The following query is used to obtain the number of nodes corresponding to each node type. To extract all vertices in the graph, use g.V() and hasLabel(NODE_NAME) to filter the graph for specific node types, and use count() to get the number of nodes. The final step next() will return the following results.
1nodes = g.V().count().next()
2papers = g.V().hasLabel('Paper').count().next()
3authors = g.V().hasLabel('Author').count().next()
4institutions = g.V().hasLabel('Institution').count().next()
5topics = g.V().hasLabel('Topic').count().next()
6concepts = g.V().hasLabel('Concept').count().
7
8print(f"papers: {papers}, authors: {authors}, institutions: {institutions}")
9print(f"topics: {topics}, concepts: {concepts}")
10print(f"Total number of nodes: {nodes}")
The following code is the output result:
1papers: 42220, authors: 162928, institutions: 21979
2topics: 10, concepts: 109750
3Total number of nodes: 336887
The following query will return the number of edges corresponding to each specific edge type. To extract all edges in the graph, use g.E() and hasLabel(EDGE_NAME) to filter the edges and count() to get the edge count. The final step next() will return the following results.
1paper_author = g.E().hasLabel('authored_by').count().next()
2author_institution = g.E().hasLabel('affiliated_with').count().next()
3paper_concept = g.E().hasLabel('associated_concept').count().next()
4paper_topic = g.E().hasLabel('associated_topic').count().next()
5paper_reference = g.E().hasLabel('cites').count().next()
6edges = g.E().count().next()
7
8print(f"paper-author: {paper_author}, author-institution: {author_institution}, paper-concept: {paper_concept}")
9print(f"paper-topic: {paper_topic}, paper-reference: {paper_reference}")
10print(f"Total number of edges: {edges}")
The following code is the output result:
1paper-author: 240624, author-institution: 121257, paper-concept: 2739666
2paper-topic: 95659, paper-reference: 134945
3Total number of edges: 3332151
Graph search
The following query will filter all the author nodes in the graph, extract five authors from the COVID-19 knowledge map by using valueMap(), limit() and toList(), and finally return a dictionary:
1g.V().hasLabel('Author').valueMap('full_name').limit(5).toList()The following code is the output result:
1[{'full_name': ['· J Wallinga']},
2 {'full_name': ['· W Van Der Hoek']},
3 {'full_name': ['· M Van Der Lubben']},
4 {'full_name': ['Jeffrey Shantz']},
5 {'full_name': ['Zhi-Bang Zhang']}]
The following query is used to filter each topic node in the graph. This query uses hasLabel() and has() to filter specific topics, and then both() obtains the paper nodes from the incoming and outgoing edges of the topic node, limit() is used to limit the results, and values() is used to obtain specific attributes from the topic node. The final step toList() returns the results as a list:
1g.V().hasLabel('Topic').has('topic', 'virology').both()\
2.limit(3).values('title').toList()
The following codes are the corresponding output results:
1['Safety and Immunogenicity of Recombinant Rift Valley Fever MP-12 Vaccine Candidates in Sheep',
2 'Ebola Virus Neutralizing Antibodies Detectable in Survivors of theYambuku, Zaire Outbreak 40 Years after Infection',
3 'Respiratory Viruses and Mycoplasma Pneumoniae Infections at the Time of the Acute Exacerbation of Chronic Otitis Media']
Advanced query
The following figure shows the various types of information we can obtain from the COVID-19 knowledge map. You can use COVID-19 knowledge map to rank papers and extract relevant information of a single paper (which will be explained in detail later).
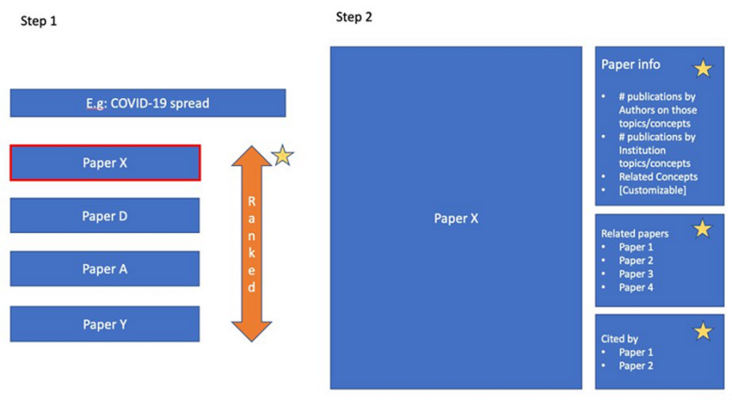
Ranking papers around specific concepts
For such use cases, we can query COVID-19 knowledge map to obtain papers related to virus resistance, and rank the papers according to the first author. To find all papers on this topic, use the following code:
1concept = 'viral resistance'
2papers = g.V().has('Concept', 'concept', concept).both().values('SHA_code').toList()
3
4print(f"Number of papers related to {concept}: {len(papers)}")
The following codes are the corresponding output results:
1Number of papers related to viral resistance: 74
To rank papers, use the following code:
1def author_prolific_rank(graph_results, groupby='SHA_code'):
2    P = g.V()\
3        .has('Paper', 'SHA_code', within(*graph_results))\
4        .group().by(__.values(groupby))\
5        .by(
6            __.out('authored_by').local(__.in_('authored_by').simplePath().count()).mean()
7        ).order(local).by(values, desc).toList()[0]
8
9    return P
10
11def sha_to_title(sha):
12    title_list = g.V().has('Paper', 'SHA_code', sha)\
13    .values('title').toList()
14
15    return ''.join(title_list)
16author_ranked = author_prolific_rank(papers)author_ranked_df = pd.DataFrame(
17    [author_ranked], index=['Score']
18).T.sort_values('Score', ascending=False).head()
19author_ranked_df['title'] = author_ranked_df.index.map(sha_to_title)
20
21for row in author_ranked_df.drop_duplicates(subset='title').reset_index().iterrows():
22    print(f"Score: {round(row[1]['Score'], 2)}\tTitle: {row[1]['title']}")
The following codes are the corresponding output results:
1Score: 27.5    Title: Surveillance for emerging respiratory viruses
2Score: 11.45    Title: Third Tofo Advanced Study Week on Emerging and Re-emerging Viruses, 2018
3Score: 10.5    Title: The Collaborative Cross Resource for Systems Genetics Research of Infectious Diseases
4Score: 10.0    Title: RNA interference against viruses: strike and counterstrike
5Score: 9.0    Title: Emerging Antiviral Strategies to Interfere with Influenza Virus Entry
Recommendation of relevant papers
In such use cases, we hope to determine other relevant papers that need to be read next according to the papers currently read. To develop such a recommendation engine, the basic idea is naturally to use the graph query mechanism. In the graph, there are two kinds of nodes connected by edges. Various concepts are derived from Amazon comprehensive medical using machine learning, including a confidence score conf, which is used to represent the quantitative index of machine learning's confidence in concept c in paper p.
To determine whether the two papers are related to each other, we first need to define a similarity score S. In COVID-19 knowledge map, different paper nodes are connected by concept nodes.
To generate a paper list according to a specific paper p, we need to generate a similarity score between P and other papers in COVID-19 knowledge map, and then rank the results. The higher the similarity score, the higher the correlation between paper P and paper P.
The similarity score between the two papers is the weighted sum of all paths between the two papers. In matrix form, the score of candidate paper P. is the dot product of vector p and P., where the size of vector p and candidate paper P. are [N {concept}, 1] respectively. The edge weight between paper and concept i is expressed as element e. if there is no edge connection between them, it is recorded as 0.
The following figure shows the recommended framework in the example.
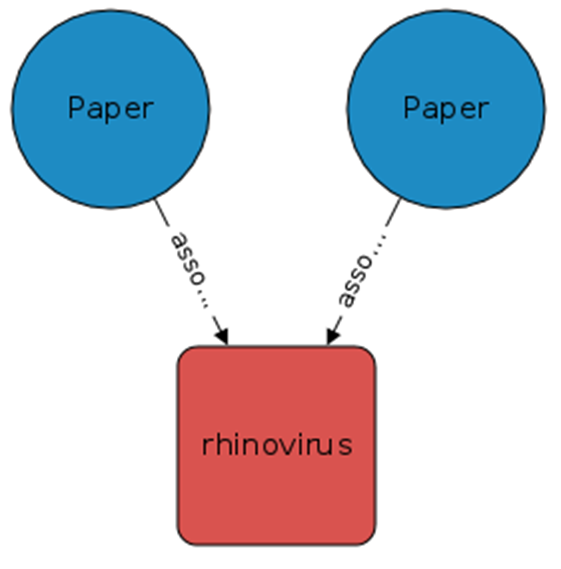
In this figure, the connecting path between the two papers is the term "rhinovirus". Each paper concept edge has a confidence score conf.
For each path between two papers, we can multiply its confidence score. To calculate the similarity score between two papers, the product of all confidence scores needs to be added.
First, obtain the relevant papers of the following papers. See the following operation codes for details:
1sha = "f1716a3e74e4e8139588b134b737a7e573406b32"
2title = "Title: Comparison of Hospitalized Patients With ARDS Caused by COVID-19 and H1N1"
3print(f"Title: {title}")
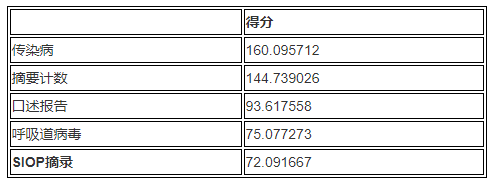
4print(f"Unique ID: {sha}") Use the previously defined algorithm to query the knowledge map. See the following operation code for details:
1Title: Comparison of Hospitalized Patients With ARDS Caused by COVID-19 and H1N1
2Unique ID: f1716a3e74e4e8139588b134b737a7e573406b32
The following table summarizes the output results obtained by sorting:
summary
Amazon cloud technology COVID-19 data lake is hosted in Amazon Simple Storage Service for free (Amazon S3), data requests to such public data Lake buckets will not incur Amazon S3 standard fees, and you can use them directly for free. However, when building the COVID-19 knowledge map in Amazon cloud technology accounts through Amazon CloudFormation stack, using Amazon Neptune and Jupiter notebook hosted by Amazon SageMaker may incur corresponding fees . For more details, see Amazon Neptune billing standards and Amazon SageMaker billing standards.
To avoid double billing, please delete the Amazon CloudFormation stack after the walkthrough. For specific instructions, see deleting stacks on the Amazon CloudFormation console. Also, make sure to delete the root stack (the stack we created earlier) to delete all nested stacks.
You can also use the Amazon CloudFormation template to build the knowledge map, and use the third-party map visualization tool Tom Sawyer map database browser to realize the map visualization. For more details, see COVID-19 scientific research using Amazon Neptune, Amazon comprehensive medical, and Tom Sawyer map database browser.
It is believed that with the full cooperation between all participants and scientific disciplines, we will eventually win the COVID-19 anti epidemic campaign. Using COVID-19 knowledge map, we can ask and answer various questions related to COVID-19 scientific literature. We firmly believe that by combining the achievements in the fields of data, technology and science with the spirit of openness, we will be able to stimulate insight, promote cooperation, and finally contain, alleviate and eliminate the COVID-19 epidemic.
Original link (English version):
https://aws.amazon.com/cn/blo...
Author of this article

Miguel Romero
Amazon cloud technology machine learning solutions lab data scientist
He built various solutions to help customers easily adopt machine learning and AI solutions to deal with various business problems. At present, he is mainly responsible for developing prediction models related to event broadcasting for sports customers, so as to improve the participation of fan groups.

Colby Wise
Data scientist and manager of Amazon cloud technology machine learning solutions laboratory.
He is mainly responsible for helping Amazon cloud technology customers from all walks of life accelerate the adoption of AI and cloud services.

George Price
Amazon cloud technology machine learning solutions lab deep learning architect
He is mainly responsible for helping Amazon cloud technology customers build models and architectures. Prior to that, he also worked as a software engineer for the Amazon Alexa project.