Hello everyone, I'm an old watch ~
Last night, Leehom Wang finally responded 👆, If you want to see the original response, you can drop down to the bottom left corner of the text to read the original.
Today, simply teach you how to process data + visualize his microblog comments, and download the complete code / data. See the end of the article.
On December 15, Wang Leehom suddenly announced his divorce on his microblog, saying that "Liang Lei and my private life is very simple and simple, so we will not respond to any media", ending his eight-year marriage.
Late at night on December 17, Wang Leehom's ex-wife Li Lianglei suddenly sent a document saying that she had been humiliated and cold violence by Wang Leehom and his family for a long time. At the same time, it also exposed unknown events such as Wang Leehom's marital infidelity and chaotic private life, which put Wang Leehom's image of "high-quality male star" in jeopardy for many years.
Once the article was issued, it triggered a heated discussion. Wang Leehom's long-standing image of "high-quality Idol" was questioned. Many netizens left messages under Li Lianglei's microblog, saying, "I'm so sad, I'm so disappointed" and "Wang Leehom's image in my heart collapsed".
Let's use the data today - eat melons.
I used Python programming to crawl the comments under Wang Leehom's microblog announcing his divorce.
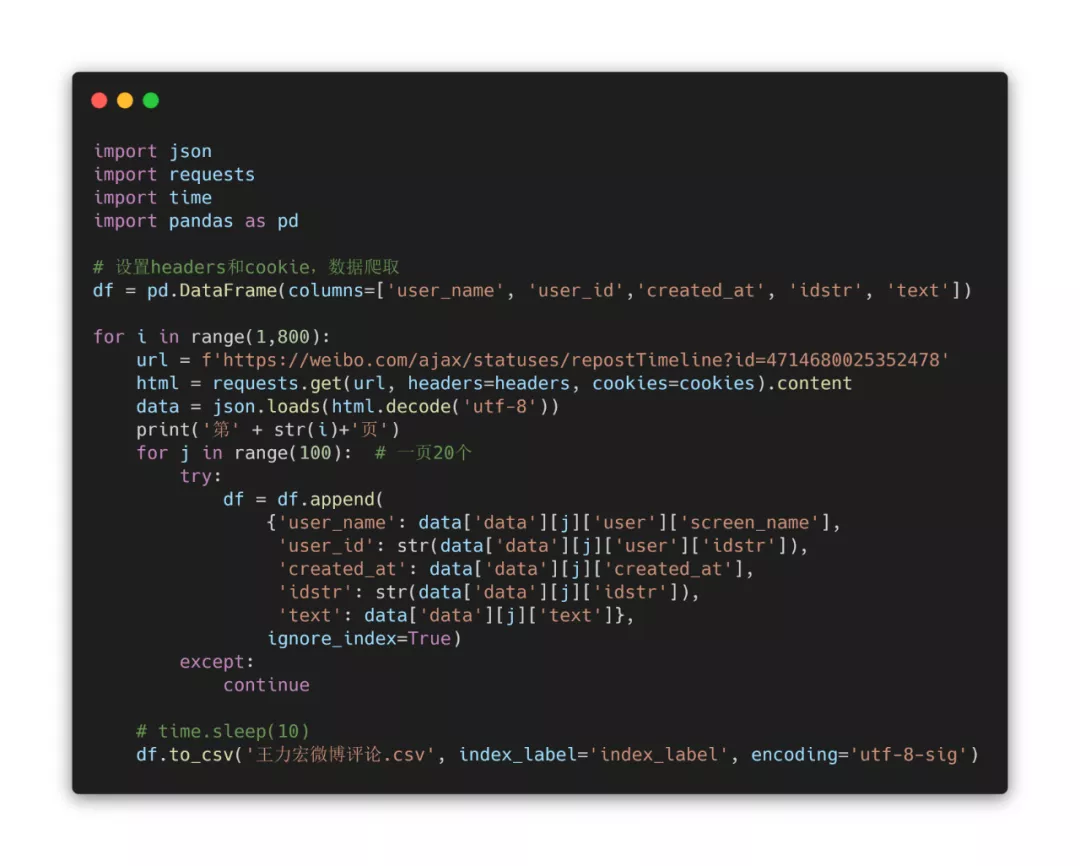
The downloaded csv file includes user name, user id, comment creation time, comment id, comment content, etc.
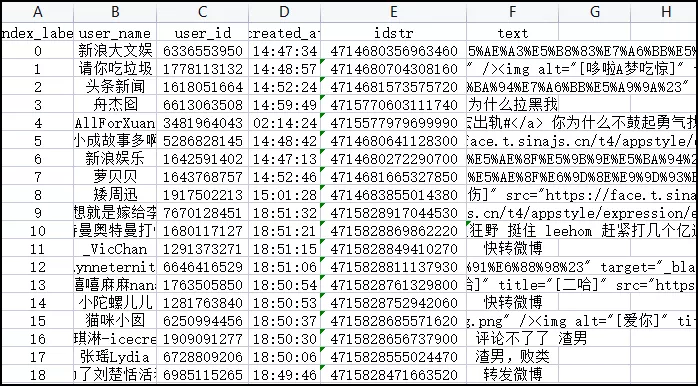
As shown in the above figure, the content in the original data is very chaotic. Microblog comments are mixed with a large number of expression packets, topics and "forwarding microblog", etc., which need to be cleaned.
First, the duplicate is removed according to the unique ID of the comment
df_1 = df_1.drop_duplicates(['idstr']).iloc[:,1:]
Then, all microblog comments are counted by hour
df_1['created_date'] = pd.to_datetime(df_1['created_date'])
df_1_date = df_1.groupby([pd.Grouper(key='created_date',freq='H')]).size().reset_index(name='count')
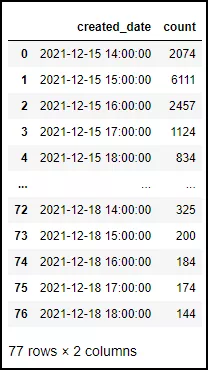
After obtaining the time-sharing data, you can use Matplotlib to draw a line graph.
columns = df_date.columns
fig = plt.figure(figsize=(10, 5), dpi=100)
plt.fill_between(df_date['created_date'].values, y1=df_date['count_x'].values, y2=0,
                 label='New comments on Wang Leehom's microblog/hour', alpha=0.75, facecolor="#43a9cb", linewidth=1, edgecolor='k')
plt.xlabel("Date")
plt.ylabel("Value")
plt.legend(loc='upper right')
plt.show()
fig.savefig('Wang Lihong.png')
The output results are as follows
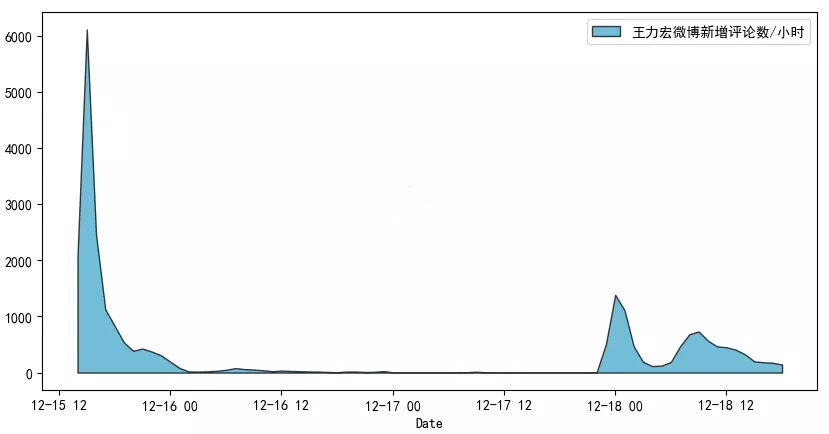
Just released the microblog on the 15th, instantly detonated the comments and quickly searched.
16. There was no comment on the 17th.
Until 23 o'clock last night, after his ex-wife Li Lianglei sent a document late at night, the masses rushed to open the group.
PS: in addition to the people who eat melons, Infiniti should be the fastest.
At 14:00 on December 16, Infiniti, a luxury car brand, just officially announced that Wang Leehom had become the brand spokesman. At 1:22 a.m. on the 18th, the microblog @ Infiniti China issued a statement. Infiniti decided to terminate the cooperative relationship with Mr. Wang Leehom from now on. Infiniti has only 35 hours from signing to terminating his contract.
What would it look like if we put the number of microblog comments of Wang Leehom and Li Lianglei in one picture?
I also climbed Li Lianglei's microblog comments and also processed the data
columns = df_date.columns
fig = plt.figure(figsize=(10, 8), dpi=100)
plt.fill_between(df_date['created_date'].values, y1=df_date['count_x'].values, y2=0,
                 label='New comments on Wang Leehom's microblog/hour', alpha=0.75, facecolor="#43a9cb", linewidth=1, edgecolor='k')
plt.fill_between(df_date['created_date'].values, y1=df_date['count_y'].values, y2=0,
                 label='New comments on Li Lianglei's microblog/hour', alpha=0.75, facecolor="#b7ba6b", linewidth=1, edgecolor='k')
plt.xlabel("Date")
plt.ylabel("Value")
plt.legend(loc='upper left')
plt.show()
The output results are as follows:
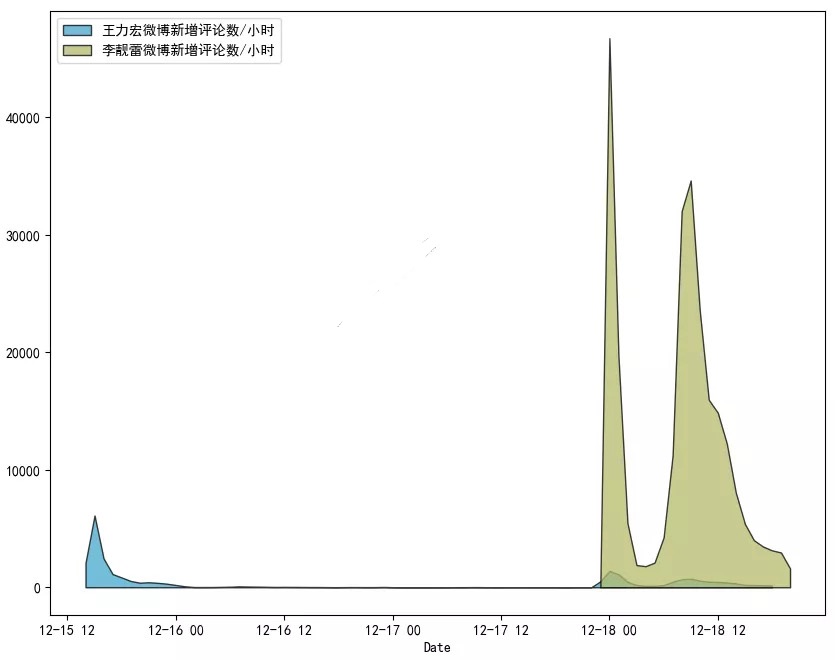
In contrast, Wang Leehom's comments are not an order of magnitude at all. They seem to be "the younger brother of the younger brothers".
The melon eaters all flocked to Li Lianglei's microblog.
This time we still want to check: what did the masses send after the group?
Different from the traditional word cloud picture in the previous article, I'm going to play something new. In the broken line area map made in the previous article, the word clouds in different time periods are filled in.
Many small partners are curious about how to do it. In fact, ps superimposes the line chart above with the generated word cloud layer. If you want to ask Python if it can do layer overlay, my answer is yes, but it's not necessary.
Before making the word cloud picture, all Wang Leehom's microblog comments need to be divided into two parts (before and after his ex-wife's hammer opening). Note that the code below is bounded by "2021-12-17 23:08:00".
def get_cut_words(content_series):
    #Read in stoplist
    import jieba
    stop_words = []

    with open("stop_words.txt", 'r', encoding='utf-8') as f:
        lines = f.readlines()
        for line in lines:
            stop_words.append(line.strip())

    #Add keyword
    my_words = ['Opening and closing', 'block']
    for i in my_words:
        jieba.add_word(i)

    #Custom stop words
    my_stop_words = ['Turn','forward','micro-blog']
    stop_words.extend(my_stop_words)

    #Participle
    word_num = jieba.lcut(content_series.str.cat(sep='. '), cut_all=False)

    #Conditional filtering
    word_num_selected = [i for i in word_num if i not in stop_words and len(i)>=2]

    return word_num_selected

text1 = get_cut_words(content_series=df_1[df_1["created_date"] < "2021-12-17 23:08:00"]['text1'])
Then prepare two masks (from the line chart obtained earlier)

The code of word cloud map is detailed, and we are very familiar with it. Just pay attention to it here.
background_color='white'

#Change to

background_color=None,mode='RGBA',
In this way, the background color of the word cloud image can be set to transparent to facilitate layer superposition.
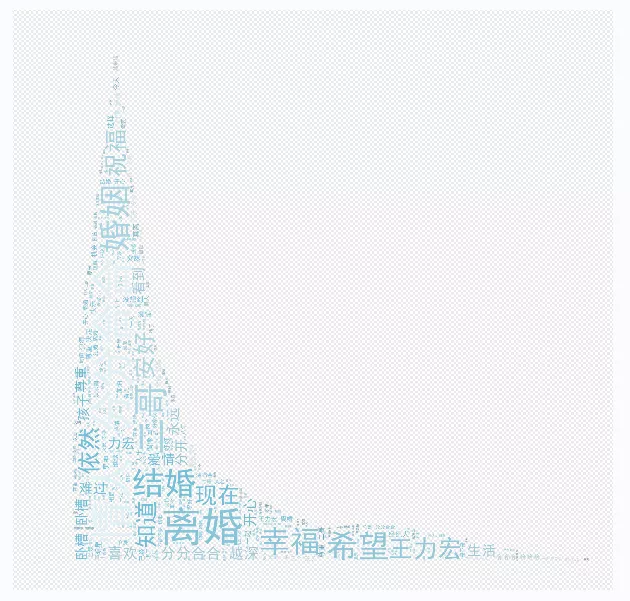
▲ generated word cloud
In this way, we can make the figure shown below 👇
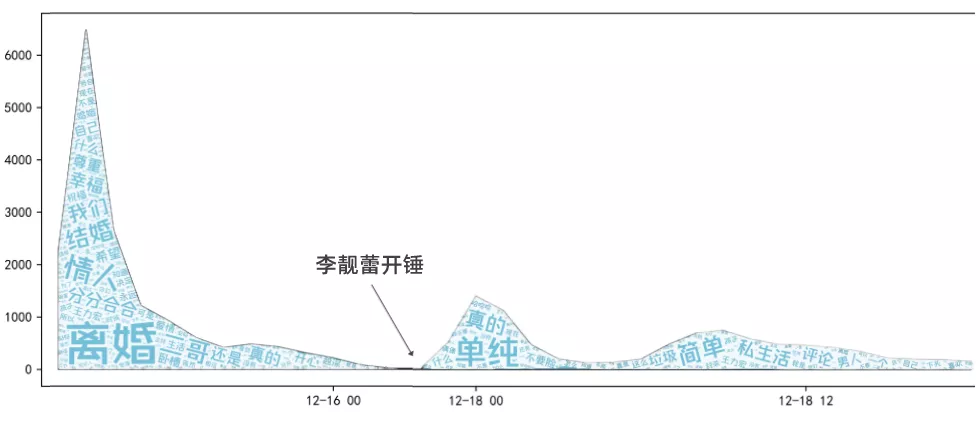
Before the exposure of his ex-wife Li Lianglei, Wang Leehom's microblog comments were basically like this: "marriage is for happiness, so is divorce", "lover's total score and score", "respect the second brother's choice".
After the exposure, Wang Leehom's microblog comments became like this: "redefine simplicity", "scum man", "lower head", "simple private life? You insulted the word simplicity" and "artificial collapse".
PS: the angry melon eaters also output a lot of "dirty words", which I excluded in the word cloud chart.
Let's change direction and have fun.
I decided to use the data to explore: what are the favorite expressions of melon Eaters?
I extracted emoji expressions from 100000 comments. First, I extracted all the names of emoji that can be used in microblog comments (only a part is shown here).
emoji_list = ["[Little safflower]","[smile]","[lovely]","[Too happy]","[applause]","[Hee hee]","[ha-ha]","[laugh cry]","[blink the eyes]","[greedy]","[Black line]","[sweat]","[Nose digging]","[Hum]","[anger]","[Grievance]","[poor]","[disappointment]","[Sadness]","[tear]","[Allow sorrow]"]
Use in to determine whether an emoji is included
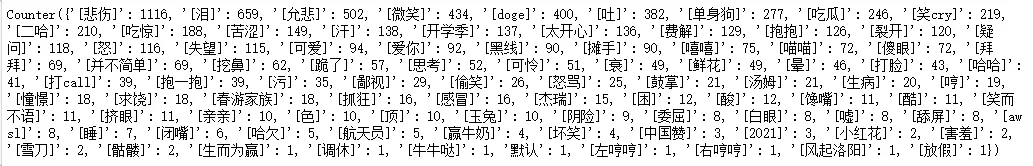
def emoji_lis(string):
    entities = []
    for i in emoji_list:
        if i in string:
            entities.append(i)
    return entities

emoji_s = []

for index, row in df_1.iterrows():
    text = str(row['text'])
    emoji_s.extend(emoji_lis(text))

c = collections.Counter(emoji_s)
print(c)
The number of emoji occurrences can be obtained:
Also use Matplotlib to draw polar graphs
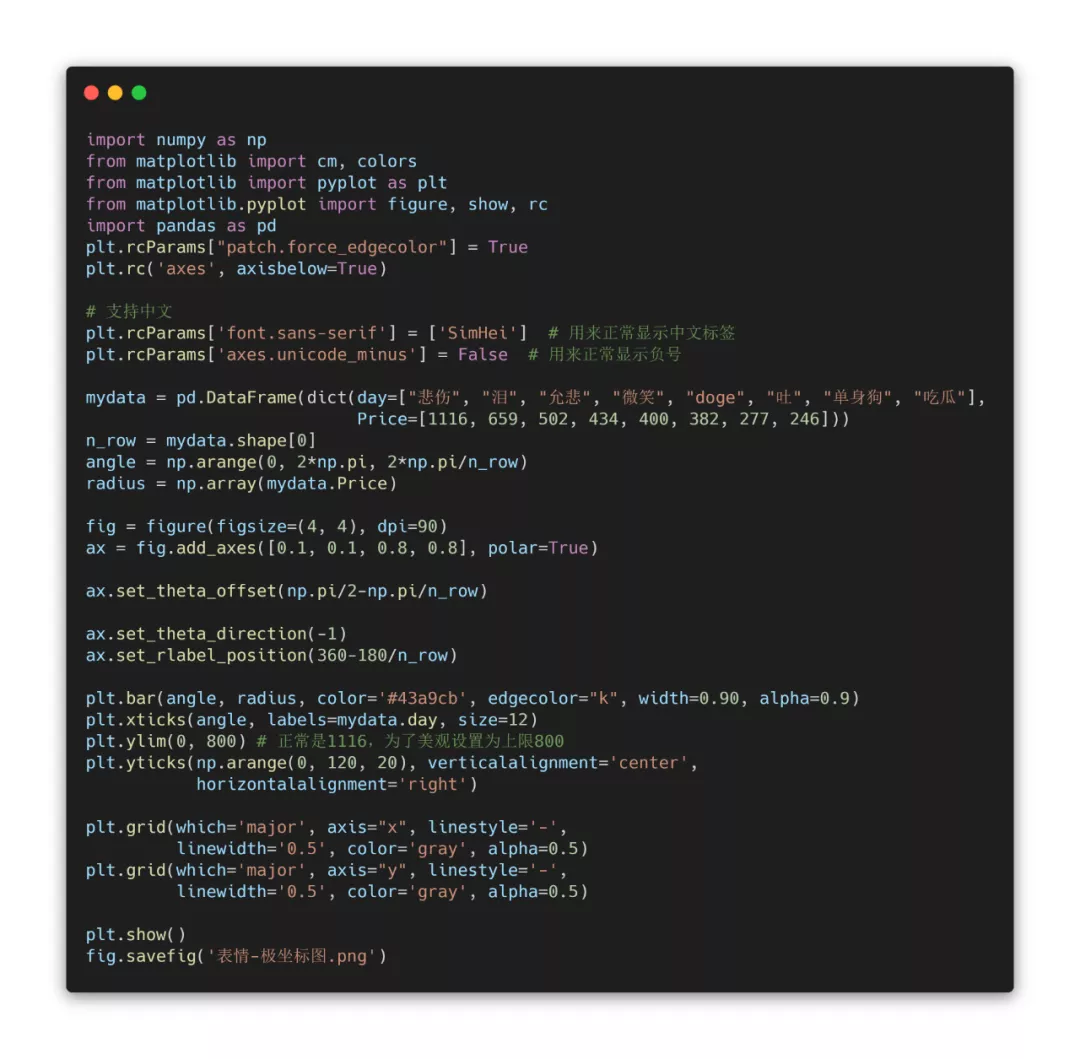
The output results are as follows:
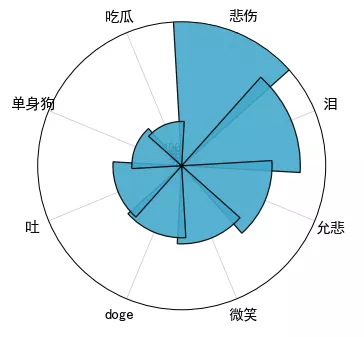
After matching and collecting the expressions in the comments, select the top 8 according to the number of occurrences and make them into a polar graph.
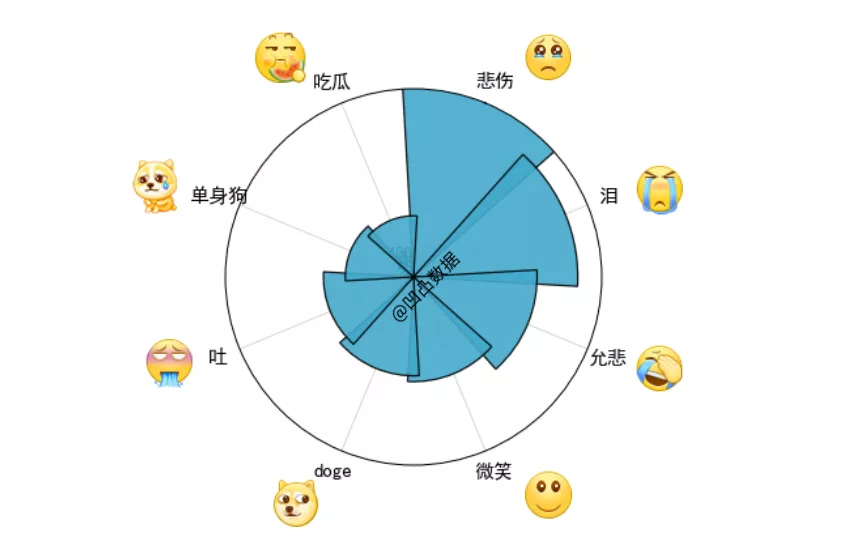
It was found that the top 8 expressions were: sadness, tears, sadness, smile, doge, vomiting, single dog and eating melon.
Since his debut, Wang Leehom has been known as a "high-quality Idol". He has a good family background, talent and good looks. There are few negative aspects in his debut for many years. Now it seems that the high-quality skin is just a mask. He chose the best wife, but he made further progress in her tolerance for many years.
As Li Lianglei's long article said, "if your acting career is affected, it is caused by your own choices, not me."