
Lattice is a Redis connection pool. Unlike Jedis, lattice is an asynchronous connection pool mainly based on Netty and ProjectReactor. Because it is based on project reactor, it can be directly used in spring weblux asynchronous projects. Of course, it also provides a synchronous interface.
In our microservice project, Spring Boot and Spring Cloud are used. Spring data Redis is used as the library to connect to Redis. And the connection pool uses lettue. At the same time, our online JDK is the OpenJDK 11 LTS version, and JFR records are opened for each process. For JFR, refer to this series: JFR total solution
After lattice 6.1, lattice also introduced JFR based monitoring events. reference resources: events.flight-recorder

1. Redis connection related events:
- ConnectEvent: this event will be issued before attempting to establish a connection with Redis.
- ConnectedEvent: the event that will be sent when the connection is established, including the remote IP and port of the connection and the Redis URI used. The corresponding Netty is actually the event that will be sent at the beginning of the "channelActive" callback in the "ChannelHandler".
- Connectionactivated event: after completing a series of initialization operations of Redis connection (such as SSL handshake, sending PING heartbeat command, etc.), this connection can be used for events sent when Redis command is executed.
- ConnectionDeactivatedEvent: without any command being processed and ispen() is false, the connection is not active and ready to be closed. This event will occur at this time.
- DisconnectedEvent: this event will be issued when the connection is really closed or reset.
- ReconnectAttemptEvent: the Redis connection in lattice will be maintained as a long connection. When the connection is lost, it will be automatically reconnected. This event will be issued when reconnection is required.
- ReconnectFailedEvent: this event will be issued when reconnection fails.
2. Redis cluster related events:
- AskRedirectionEvent: ASK will be returned when Redis slot is in migration status. This event will be issued at this time.
- Movedresirectionevent: when the Redis slot is not on the current node, it will return MOVED. This event will be issued at this time.
- TopologyRefreshEvent: if the scheduled task of cluster replenishment refresh is enabled, this event will be issued when querying cluster replenishment. However, the task of regularly checking cluster topology needs to be enabled in the configuration. Refer to cluster-topology-refresh
- ClusterTopologyChangedEvent: this event will be issued when lattice finds that the Redis cluster topology has changed.
3. Redis command related events:
- Command latency event: lettue will count the response time of each command and issue this event regularly. This also needs to be manually configured. How to start it will be mentioned later.
- Command started event: this event will be issued when a command is started to execute.
- Commandsucceedevent: this event will be issued when the instruction is executed successfully.
- CommandFailedEvent: this event will be issued when the instruction execution fails.

Lettue's monitoring is based on the design of event distribution and listening mechanism, and its core interface is EventBus:
public interface EventBus {
    // Get Flux. Multiple subscribers can be allowed through Flux subscription
    Flux<Event> get();
    // Publish event
    void publish(Event event);
}
Its default implementation is DefaultEventBus,
public class DefaultEventBus implements EventBus {
    private final DirectProcessor<Event> bus;
    private final FluxSink<Event> sink;
    private final Scheduler scheduler;
    private final EventRecorder recorder = EventRecorder.getInstance();

    public DefaultEventBus(Scheduler scheduler) {
        this.bus = DirectProcessor.create();
        this.sink = bus.sink();
        this.scheduler = scheduler;
    }

    @Override
    public Flux<Event> get() {
        //If consumption does not come over, it will be discarded directly
        return bus.onBackpressureDrop().publishOn(scheduler);
    }

    @Override
    public void publish(Event event) {
        //Call recorder record
        recorder.record(event);
        //After calling the recorder record, publish the event
        sink.next(event);
    }
}
In the default implementation, we found that to publish an event, first call the recorder record, and then put it into FluxSink for event publishing. At present, the recorder has a practical implementation, that is, jfreeventrecorder based on JFR View source code:
public void record(Event event) {
    LettuceAssert.notNull(event, "Event must not be null");
    //Use Event to create the corresponding JFR Event, and then directly commit, that is, submit the JFR Event to the JFR record of the JVM
    jdk.jfr.Event jfrEvent = createEvent(event);
    if (jfrEvent != null) {
        jfrEvent.commit();
    }
}

private jdk.jfr.Event createEvent(Event event) {
    try {
        //Get the constructor. If the constructor is the constructor of Object, it means that the constructor of JFR Event corresponding to this Event is not found
        Constructor<?> constructor = getEventConstructor(event);
        if (constructor.getDeclaringClass() == Object.class) {
            return null;
        }
        //Create JFR Event using constructor
        return (jdk.jfr.Event) constructor.newInstance(event);
    } catch (ReflectiveOperationException e) {
        throw new IllegalStateException(e);
    }
}

//JFR Event constructor cache corresponding to Event
private final Map<Class<?>, Constructor<?>> constructorMap = new HashMap<>();

private Constructor<?> getEventConstructor(Event event) throws NoSuchMethodException {
    Constructor<?> constructor;
    //In short, check whether the JFR Event constructor corresponding to this class exists in the cache Map. If yes, it will return, and if not, try to find it
    synchronized (constructorMap) {
        constructor = constructorMap.get(event.getClass());
    }
    if (constructor == null) {

        //This discovery method is rough. Directly look for the existence of a class starting with Jfr and followed by the name of the current Event under the same package path as the current Event
        //If it exists, get its first constructor (parameterless constructor). If it does not exist, return the constructor of Object
        String jfrClassName = event.getClass().getPackage().getName() + ".Jfr" + event.getClass().getSimpleName();

        Class<?> eventClass = LettuceClassUtils.findClass(jfrClassName);

        if (eventClass == null) {
            constructor = Object.class.getConstructor();
        } else {
            constructor = eventClass.getDeclaredConstructors()[0];
            constructor.setAccessible(true);
        }

        synchronized (constructorMap) {
            constructorMap.put(event.getClass(), constructor);
        }
    }

    return constructor;
}
I found that this code is not very good. I need to obtain the lock every time I read it, so I made some modifications and put forward a Pull Request: reformat getEventConstructor for JfrEventRecorder not to synchronize for each read
From this, we can know whether an Event has a corresponding JFR Event. You can check whether there are classes starting with Jfr followed by your own name in the same path. At present, it can be found that:
- io.lettuce.core.event.connection package:
- ConnectedEvent -> JfrConnectedEvent
- ConnectEvent -> JfrConnectedEvent
- ConnectionActivatedEvent -> JfrConnectionActivatedEvent
- ConnectionCreatedEvent -> JfrConnectionCreatedEvent
- ConnectionDeactivatedEvent -> JfrConnectionDeactivatedEvent
- DisconnectedEvent -> JfrDisconnectedEvent
- ReconnectAttemptEvent -> JfrReconnectAttemptEvent
- ReconnectFailedEvent -> JfrReconnectFailedEvent
- io.lettuce.core.cluster.event package:
- AskRedirectionEvent -> JfrAskRedirectionEvent
- ClusterTopologyChangedEvent -> JfrClusterTopologyChangedEvent
- MovedRedirectionEvent -> JfrMovedRedirectionEvent
- AskRedirectionEvent -> JfrTopologyRefreshEvent
- io.lettuce.core.event.command package:
- CommandStartedEvent - > none
- Commandsucceedevent - > none
- CommandFailedEvent - > none
- io.lettuce.core.event.metrics package:
- CommandLatencyEvent - > none
We can see that currently there is no JFR monitoring for instructions, but for us, instruction monitoring is the most important. We consider adding JFR corresponding events for instruction related events

If it's true for Io lettuce. core. event. If the command event under the command} package generates the corresponding JFR, the number of events is a little too many (our application instance may execute hundreds of thousands of Redis instructions per second). Therefore, we tend to add JFR events for commandlatency event.
CommandLatencyEvent contains a Map:
private Map<CommandLatencyId, CommandMetrics> latencies;
CommandLatencyId contains Redis connection information and executed commands. CommandMetrics is time statistics, including:
- The time indicator of receiving the response from the Redis server, which determines whether the response from the Redis server is slow.
- The time indicator for processing the response from the Redis server may be that the response has not been processed because the application instance is too busy. Compare this with the time indicator for receiving the response from the Redis server to judge the time spent in application processing.
Both indicators contain the following information:
- Minimum time
- Maximum time
- The percentile time is the first 50%, the first 90%, the first 95%, the first 99%, and the first 99.9% by default. The corresponding source code: MicrometerOptions: public static final double[] DEFAULT_TARGET_PERCENTILES = new double[] { 0.50, 0.90, 0.95, 0.99, 0.999 };
We want to realize that each command of different Redis servers can view the statistics of response time indicators over a period of time through JFR, which can be realized as follows:
package io.lettuce.core.event.metrics;

import jdk.jfr.Category;
import jdk.jfr.Event;
import jdk.jfr.Label;
import jdk.jfr.StackTrace;

@Category({ "Lettuce", "Command Events" })
@Label("Command Latency Trigger")
@StackTrace(false)
public class JfrCommandLatencyEvent extends Event {
    private final int size;

    public JfrCommandLatencyEvent(CommandLatencyEvent commandLatencyEvent) {
        this.size = commandLatencyEvent.getLatencies().size();
        commandLatencyEvent.getLatencies().forEach((commandLatencyId, commandMetrics) -> {
            JfrCommandLatency jfrCommandLatency = new JfrCommandLatency(commandLatencyId, commandMetrics);
            jfrCommandLatency.commit();
        });
    }
}
package io.lettuce.core.event.metrics;

import io.lettuce.core.metrics.CommandLatencyId;
import io.lettuce.core.metrics.CommandMetrics;
import jdk.jfr.Category;
import jdk.jfr.Event;
import jdk.jfr.Label;
import jdk.jfr.StackTrace;

import java.util.concurrent.TimeUnit;

@Category({ "Lettuce", "Command Events" })
@Label("Command Latency")
@StackTrace(false)
public class JfrCommandLatency extends Event {
    private final String remoteAddress;
    private final String commandType;
    private final long count;
    private final TimeUnit timeUnit;
    private final long firstResponseMin;
    private final long firstResponseMax;
    private final String firstResponsePercentiles;
    private final long completionResponseMin;
    private final long completionResponseMax;
    private final String completionResponsePercentiles;

    public JfrCommandLatency(CommandLatencyId commandLatencyId, CommandMetrics commandMetrics) {
        this.remoteAddress = commandLatencyId.remoteAddress().toString();
        this.commandType = commandLatencyId.commandType().toString();
        this.count = commandMetrics.getCount();
        this.timeUnit = commandMetrics.getTimeUnit();
        this.firstResponseMin = commandMetrics.getFirstResponse().getMin();
        this.firstResponseMax = commandMetrics.getFirstResponse().getMax();
        this.firstResponsePercentiles = commandMetrics.getFirstResponse().getPercentiles().toString();
        this.completionResponseMin = commandMetrics.getCompletion().getMin();
        this.completionResponseMax = commandMetrics.getCompletion().getMax();
        this.completionResponsePercentiles = commandMetrics.getCompletion().getPercentiles().toString();
    }
}
In this way, we can analyze these events as follows:
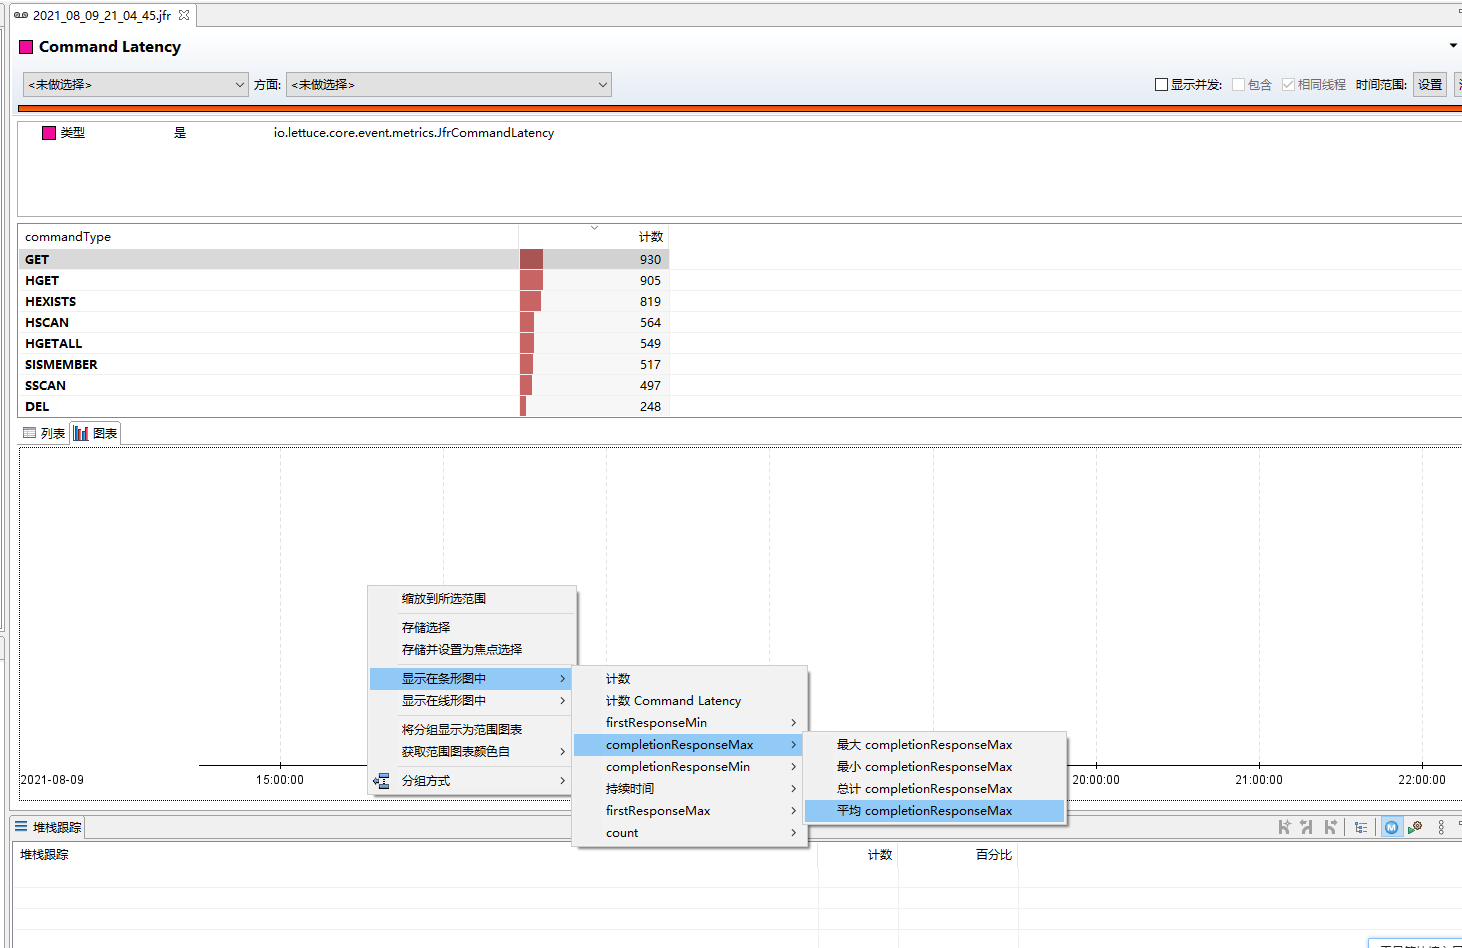
First, in the event browser, select lettuce - > command events - > command latency, and right-click to create a new page using events:

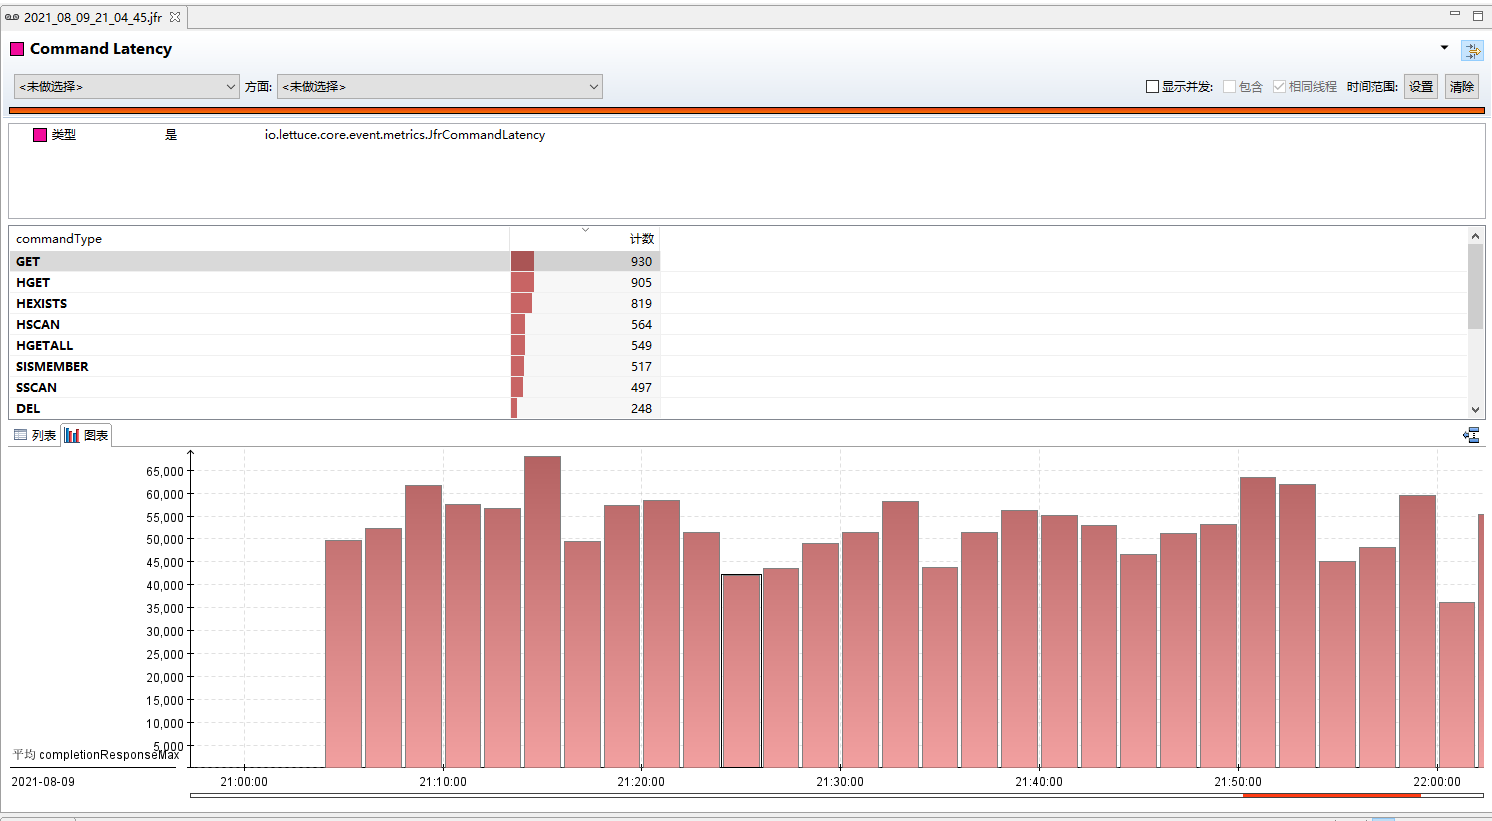
In the created event page, group by commandType and display the indicators of interest in the chart:
For these modifications, I also put forward a Pull Request to the community: fix #1820 add JFR Event for Command Latency

In Spring Boot (that is, Spring Boot starter redis dependency is added), we need to manually open the collection of CommandLatencyEvent:
@Configuration(proxyBeanMethods = false)
@Import({LettuceConfiguration.class})
//It is necessary to force automatic loading in RedisAutoConfiguration
@AutoConfigureBefore(RedisAutoConfiguration.class)
public class LettuceAutoConfiguration {
}
import io.lettuce.core.event.DefaultEventPublisherOptions;
import io.lettuce.core.metrics.DefaultCommandLatencyCollector;
import io.lettuce.core.metrics.DefaultCommandLatencyCollectorOptions;
import io.lettuce.core.resource.DefaultClientResources;
import org.springframework.context.annotation.Bean;
import org.springframework.context.annotation.Configuration;

import java.time.Duration;

@Configuration(proxyBeanMethods = false)
public class LettuceConfiguration {
    /**
     * Collect command statistics every 10s
     * @return
     */
    @Bean
    public DefaultClientResources getDefaultClientResources() {
        DefaultClientResources build = DefaultClientResources.builder()
                .commandLatencyRecorder(
                        new DefaultCommandLatencyCollector(
                                //Enable CommandLatency event collection, and configure to clear data after each collection
                                DefaultCommandLatencyCollectorOptions.builder().enable().resetLatenciesAfterEvent(true).build()
                        )
                )
                .commandLatencyPublisherOptions(
                        //Collect command statistics every 10s
                        DefaultEventPublisherOptions.builder().eventEmitInterval(Duration.ofSeconds(10)).build()
                ).build();
        return build;
    }
}