For the real problems of large factories, it is necessary to have a good understanding of the problems. The problems with similar sources and actual projects are the most important to exercise thinking ability and programming skills.
Part1: a short audio and video
SQL1 average completion rate of each video
Level: simple
Title:

(uid - user ID, video_id - VIDEO ID, start_time - start viewing time, end_time - end viewing time, if_follow - follow, if_like - like, if_retweet - forward, comment_id - Comment ID)

(video_id - VIDEO ID, author - creator ID, tag - category tag, duration - VIDEO duration (seconds), release_time - release time)
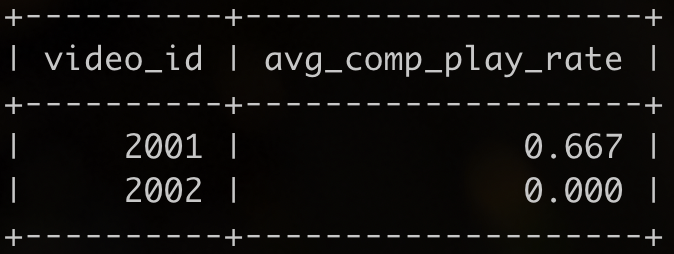
Explanation:
Procedure:
SELECT
A.video_id_total AS video_id,
CAST(IFNULL(video_num_need, 0) / video_num_all AS DECIMAL(10,3)) AS avg_comp_play_rate
FROM
(SELECT
video_id AS video_id_total,
COUNT(*) AS video_num_all
FROM
tb_user_video_log
WHERE
YEAR(end_time) = 2021
GROUP BY
video_id) AS A
LEFT JOIN
(SELECT
B.video_id AS video_id,
B.release_time AS relsease_time,
COUNT(*) AS video_num_need
FROM
(SELECT
a.video_id AS video_id,
a.start_time AS start_time,
a.end_time AS end_time,
b.duration AS duartion,
b.release_time AS release_time,
a.end_time - a.start_time AS watch_time
FROM
tb_user_video_log AS a
INNER JOIN
tb_video_info AS b
ON
a.video_id = b.video_id
WHERE
YEAR(end_time) = 2021
AND
(a.end_time - a.start_time) >= b.duration) AS B
GROUP BY
B.video_id) AS C
ON
A.video_id_total = C.video_id
ORDER BY
avg_comp_play_rate DESC;
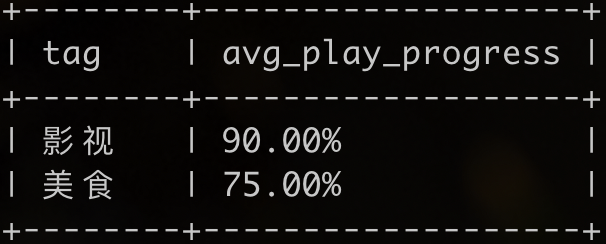
Video categories with SQL2 average playback progress greater than 60%
Level: simple
Title:


- Playback progress = playback duration ÷ video duration * 100%. When the playback duration is greater than the video duration, the playback progress is recorded as 100%.
- The results are kept to two decimal places and sorted in reverse order according to the playback progress.
SELECT
tag,
CONCAT(ROUND(avg_play_progress * 100, 2),'%')
FROM
(
SELECT
tag,
AVG(
CASE WHEN TIMESTAMPDIFF(second, b.start_time, b.end_time) >= a.duration
THEN 1
ELSE TIMESTAMPDIFF(second, b.start_time, b.end_time) / a.duration
END) AS avg_play_progress
FROM
tb_video_info AS a
INNER JOIN
tb_user_video_log AS b
ON
a.video_id = b.video_id
GROUP BY
a.tag) AS A
WHERE
A.avg_play_progress > 0.6
ORDER BY
A.avg_play_progress DESC
SQL3 forwarding volume / rate of each type of video in recent one month
Level: medium
User video interaction table tb_user_video_log


SELECT
a.tag,
SUM(CASE WHEN b.if_retweet = 1 THEN 1 ELSE 0 END) AS retweet_cnt,
ROUND(SUM(CASE WHEN b.if_retweet = 1 THEN 1 ELSE 0 END) / COUNT(*), 3) AS retweet_rate
FROM
tb_video_info AS a
INNER JOIN
tb_user_video_log AS b
ON
a.video_id = b.video_id
WHERE
TIMESTAMPDIFF(
    DAY,
    DATE(b.start_time),
    DATE((
    SELECT
    MAX(start_time)
    FROM tb_user_video_log))) <= 29
GROUP BY
a.tag
ORDER BY
retweet_rate DESC
SQL4 the monthly rise rate of each creator and the total number of fans as of now
Level: medium
User video interaction table tb_user_video_log

Short video message table tb_video_info

- Powder rising rate = (powder adding amount - powder dropping amount) / playback amount. The results are sorted in ascending order by Creator ID and total fans.
- if_follow - whether the user pays attention is 1, which means that the user pays attention to the video creator when watching the video, 0 means that the attention state has not changed before and after this interaction, and 2 means that the attention has been cancelled during this viewing.

# For each creator, every month
SELECT
A.author AS author,
A.month AS month,
ROUND(fans_situation / total_play, 3) AS fans_growth_rate,
SUM(fans_situation) OVER(PARTITION BY author ORDER BY month) AS total_fans
FROM
(SELECT
b.author AS author,
DATE_FORMAT(a.start_time,'%Y-%m') AS month,
# Change of fans
SUM(
CASE
WHEN a.if_follow = 1 THEN 1
WHEN a.if_follow = 2 THEN -1
ELSE 0
END) AS fans_situation,
# Playback volume
COUNT(*) AS total_play
FROM
tb_user_video_log AS a
INNER JOIN
tb_video_info AS b
ON
a.video_id = b.video_id
WHERE
YEAR(a.start_time) = 2021
AND YEAR(a.end_time) = 2021
GROUP BY
author, month) AS A
ORDER BY
author, total_fans
SQL5 likes and forwards of each type of video during the National Day
Level: difficult
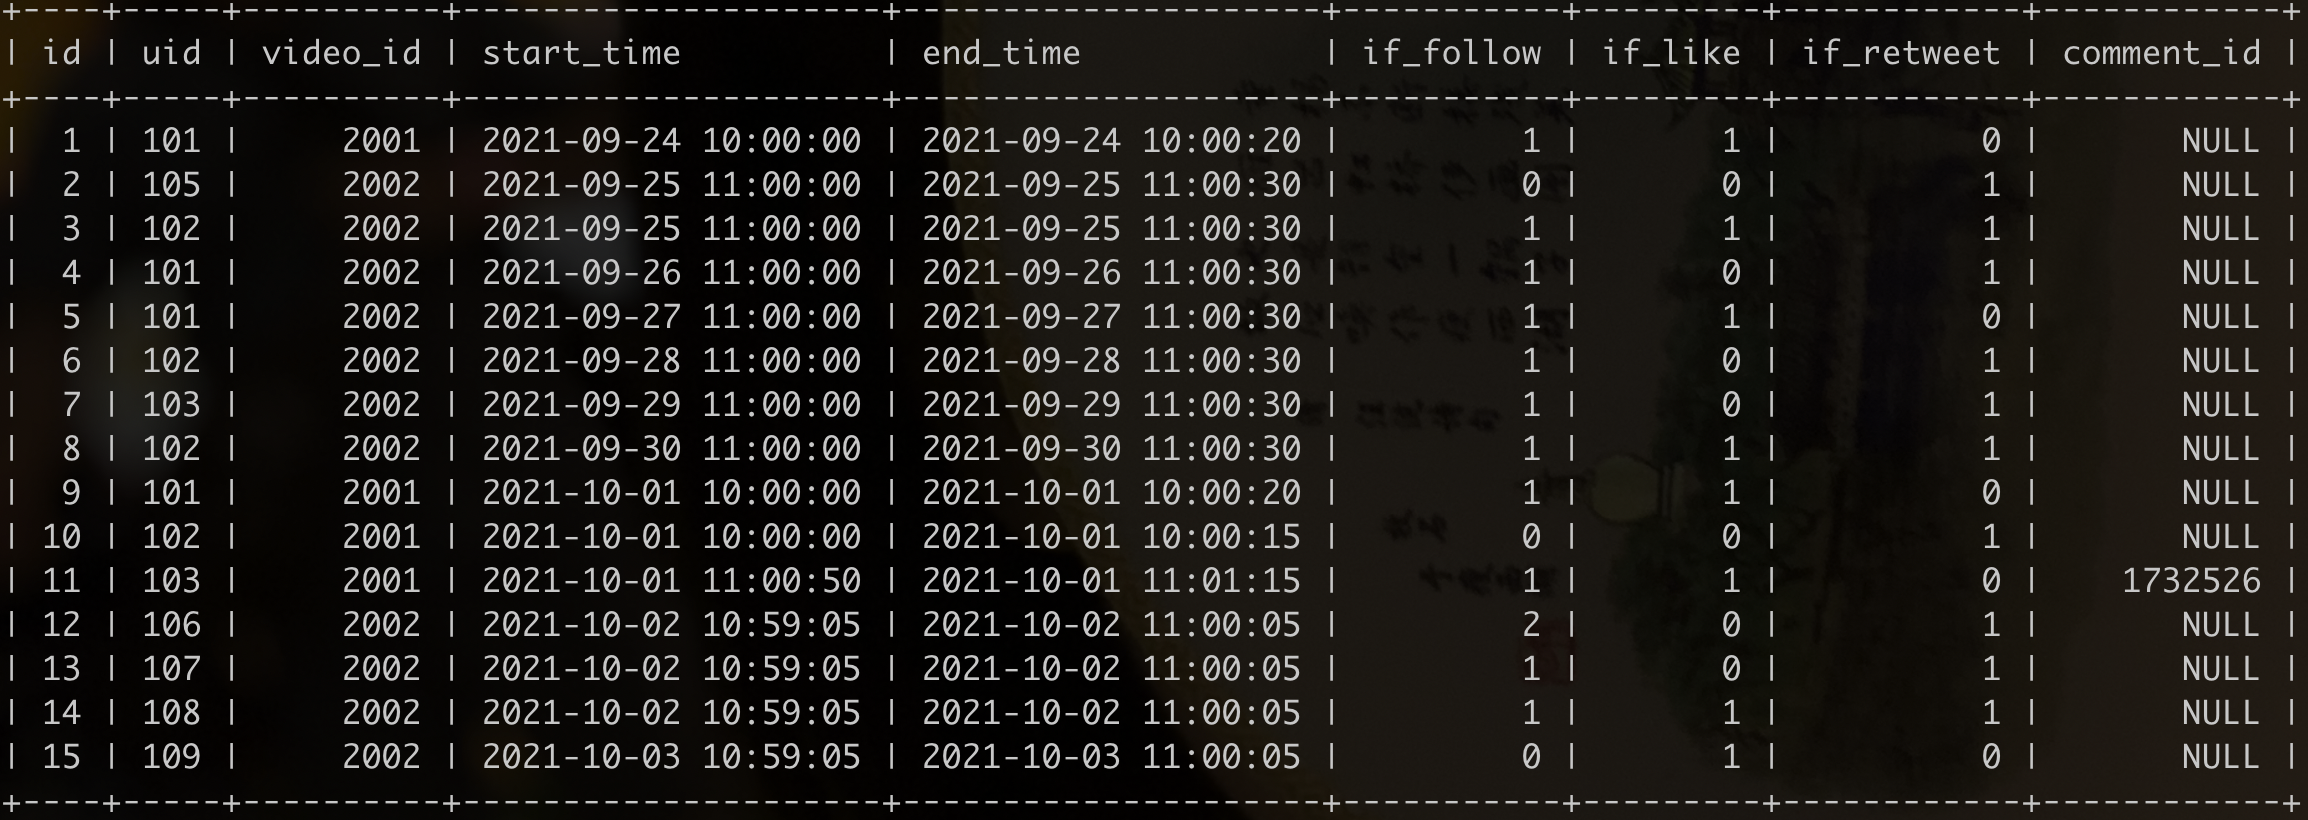
User video interaction table tb_user_video_log
Short video message table tb_video_info


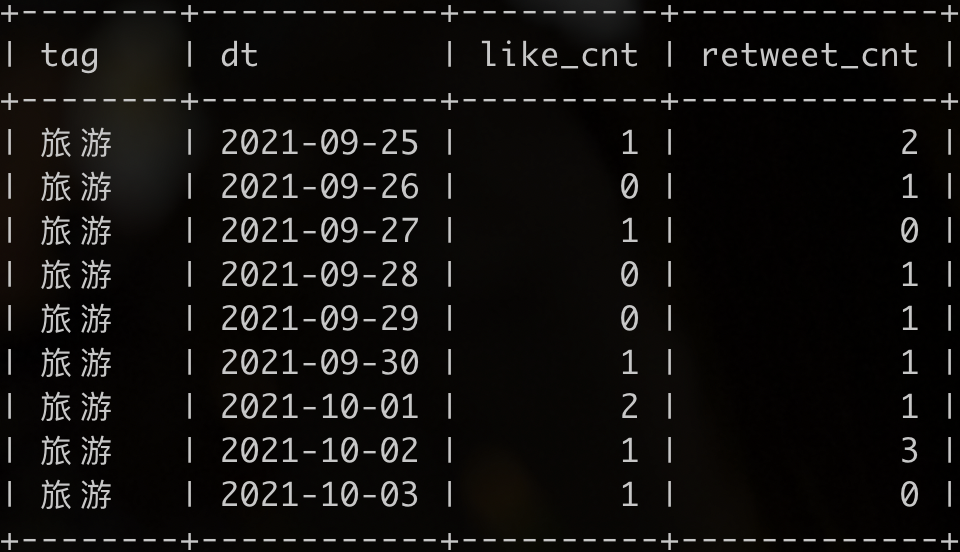
SELECT
B.tag AS tag,
B.dt AS dt,
B.sum_like_cnt_7d AS sum_like_cnt_7d,
B.max_between_cnt_7d AS max_between_cnt_7d
FROM
(SELECT
A.tag AS tag,
A.dt AS dt,
SUM(A.like_cnt) OVER(PARTITION BY A.tag ORDER BY A.dt ROWS 6 PRECEDING) AS sum_like_cnt_7d,
MAX(A.retweet_cnt) OVER(PARTITION BY A.tag ORDER BY A.dt ROWS 6 PRECEDING) AS max_between_cnt_7d
FROM
(SELECT
b.tag AS tag,
DATE_FORMAT(a.start_time, '%Y-%m-%d') AS dt,
SUM(a.if_like) AS like_cnt,
SUM(a.if_retweet) AS retweet_cnt
FROM
tb_user_video_log AS a
INNER JOIN
tb_video_info AS b
ON
a.video_id = b.video_id
WHERE
DATE_FORMAT(a.start_time, '%Y-%m-%d') BETWEEN '2021-09-25' AND '2021-10-03'
AND DATE_FORMAT(a.end_time, '%Y-%m-%d') BETWEEN '2021-09-25' AND '2021-10-03'
GROUP BY
tag, DATE_FORMAT(a.start_time, '%Y-%m-%d')
) AS A
) AS B
WHERE
B.dt BETWEEN '2021-10-01' AND '2021-10-03'
ORDER BY
B.tag DESC, B.dt ASC;
Note:
This topic examines the sliding window. In this kind of problem of how many days to take, the window function can be designed according to the needs of the topic. Take this topic as an example
Taking the situation within a week, the idea can be sorted in ascending and descending order.
1) Ascending order: 6 lines ahead of the current line
partition by tag order by dt rows 6 preceding
partition by tag order by dt rows between 6 preceding and CURRENT row
2) descending order: 6 lines from the current line
partition by tag order by dt desc rows between CURRENT row and 6 following
Remember that this method is very helpful for solving similar problems.
The top 3 video with the highest popularity among the videos released by SQL6 in recent months
Level: difficulty
describe
Existing users - video interaction table tb_user_video_log

Short video message table tb_video_info

(video_id - VIDEO ID, author - creator ID, tag - category tag, duration - VIDEO duration, release_time - release time)
- Popularity = (a * video completion rate + b * likes + c * comments + d * forwards) * freshness;
- Freshness = 1 / (no playing days recently + 1);
- The currently configured parameters a, B, C and D are 100, 5, 3 and 2 respectively.
- Last play date in end_time - the end viewing time shall prevail. Assuming T, the statistics of the last month shall be based on the closed interval of [T-29, T].
- The heat in the results is kept as an integer and sorted in descending order of heat.
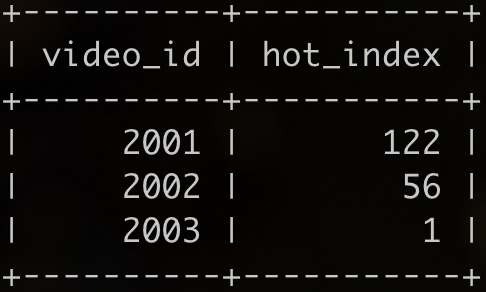
SELECT
video_id,
ROUND((100 * total_play_rate + 5 * like_num + 3 * comment_num + 2 * retweet_num) * (1 / (not_play_days + 1)),0) AS hot_index
FROM
(SELECT
a.video_id AS video_id,
# Video completion rate
AVG(CASE
WHEN TIMESTAMPDIFF(SECOND, a.start_time, a.end_time) < b.duration
THEN 0
WHEN TIMESTAMPDIFF(SECOND, a.start_time, a.end_time) >= b.duration
THEN 1
END) AS total_play_rate,
# Number of likes
SUM(a.if_like) AS like_num,
# Number of comments
COUNT(a.comment_id) AS comment_num,
# Forwarding number
SUM(a.if_retweet) AS retweet_num,
# Recent days without broadcasting
DATEDIFF(
(
SELECT MAX(end_time) FROM tb_user_video_log),
MAX(a.end_time)
) AS not_play_days
FROM
tb_user_video_log AS a
INNER JOIN
tb_video_info AS b
ON
a.video_id = b.video_id
WHERE
DATEDIFF(
(
SELECT MAX(end_time) FROM tb_user_video_log),
b.release_time
) <= 29
GROUP BY
a.video_id) AS A
ORDER BY
hot_index DESC
LIMIT 3;
Unfinished to be continued...