1. Prometheus monitoring server
1.1 problems
This case requires the deployment of prometheus monitoring server to complete the following tasks:
- Install monitoring server
- Modify profile
- Write service files and manage services
- View monitoring data
1.2 scheme
Two virtual machines are required for the experiment, and the host information is shown in TABLE-1.
All host systems are CentOS7, and IP, host name and system YUM source are configured in advance.
TABLE-1 experimental topology (network card name is for reference only and cannot be copied)

The experimental topology is shown in figure-1.
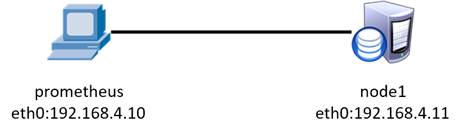
Figure-1
1.3 steps
To implement this case, you need to follow the following steps.
Step 1: install monitoring software (192.168.4.10 host operation)
1) Install the software (the software package is provided in the second stage material prometheus_soft.tar.gz).
The software needs to be copied to the virtual machine in advance. Unzip and use.
[root@prometheus ~]# tar -xf prometheus_soft.tar.gz
[root@prometheus ~]# cd prometheus_soft
[root@prometheus prometheus_soft]# tar -xf prometheus-2.17.2.linux-386.tar.gz
[root@prometheus prometheus_soft]# ls
[root@prometheus prometheus_soft]# mv prometheus-2.17.2.linux-386 /usr/local/prometheus
[root@prometheus prometheus_soft]# ls /usr/local/prometheus/
2) Modify the prometheus configuration file.
[root@prometheus ~]# vim /usr/local/prometheus/prometheus.yml
static_configs:
    - targets: ['192.168.4.10:9090']
#Modify the last line to change the IP address to the native IP address
[root@prometheus ~]# /usr/local/prometheus/promtool check config \
/usr/local/prometheus/prometheus.yml
#Check the configuration file for syntax errors
3) Write the service file and use systemd to manage the service.
[root@prometheus ~]# vim /usr/lib/systemd/system/prometheus.service
[Unit]
Description=Prometheus Monitoring System
After=network.target
[Service]
ExecStart=/usr/local/prometheus/prometheus \
  --config.file=/usr/local/prometheus/prometheus.yml \
  --storage.tsdb.path=/usr/local/prometheus/data/
[Install]
WantedBy=multi-user.target
#remarks:
#--config.file and -- storage tsdb. Path is the parameter of prometheus program
#You can use prometheus -h to see which parameters this program supports
#--config. The file parameter specifies which configuration file the program uses to start the service
#--storage. tsdb. The path parameter specifies the directory in which the program stores the data
[root@prometheus ~]# systemctl  enable prometheus.service --now
#Set the server startup self startup service, and start the service immediately
3) Set up firewall and SELinux (this step can be ignored if it is turned off).
[root@prometheus ~]#firewall-cmd --set-default-zone=trusted
[root@prometheus ~]#setenforce 0
[root@prometheus ~]#sed -i '/SELINUX/s/enforcing/permissive/' /etc/selinux/config
Step 2: view the monitoring console
1) View monitoring host and monitoring data.
Use the browser firefox or Google Chrome to access http://192.168.4.10:9090 .
View the monitoring host, click Status – Targets to view the host, and the effect is shown in figure-2.
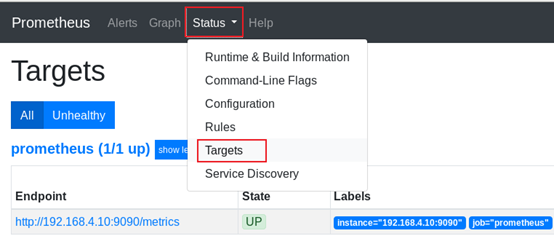
Figure-2
To view specific monitoring data, click Graph and select monitoring data, such as go_memstats_alloc_bytes, click Execute, and the effect is shown in figure-3.
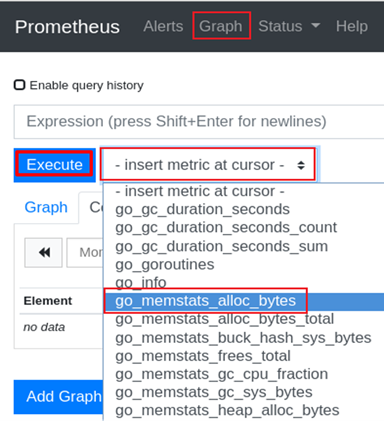
Figure-3
View the monitoring graph corresponding to the monitoring data, and the effect is shown in figure-4.
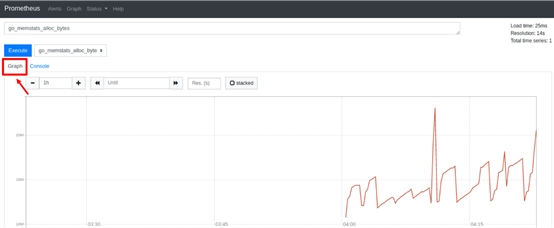
Figure-4
2. Prometheus monitored end
2.1 problems
This case requires the configuration of Prometheus monitored end host, which mainly completes the following tasks:
- Install monitored end software
- Write a service file
- Modify the monitoring server configuration file
- View monitoring data
2.2 steps
To implement this case, you need to follow the following steps.
Step 1: deploy the controlled end export
1) Install the software (192.168.4.11 host operation).
Install the software, and the software is in the second stage material prometheus_soft.tar.gz.
Copy the software to the virtual machine in advance.
[root@node1 ~]# tar -xf prometheus_soft.tar.gz
[root@node1 ~]# cd prometheus_soft
[root@node1 prometheus_soft]# tar -xf node_exporter-1.0.0-rc.0.linux-amd64.tar.gz
[root@node1 prometheus_soft]# ls
[root@node1 prometheus_soft]# mv node_exporter-1.0.0-rc.0.linux-amd64 /usr/local/node_exporter
[root@node1 prometheus_soft]# ls /usr/local/node_exporter
- Write the service file (192.168.4.11 host operation).
[root@node1 ~]# vim /usr/lib/systemd/system/node_exporter.service
[Unit]
Description=node_exporter
After=network.target
[Service]
Type=simple
ExecStart=/usr/local/node_exporter/node_exporter
[Install]
WantedBy=multi-user.target
[root@node1 ~]# systemctl  enable node_exporter --now
3) Set up firewall and SELinux (this step can be ignored if it is turned off).
[root@node1 ~]#firewall-cmd --set-default-zone=trusted
[root@node1 ~]#setenforce 0
[root@node1 ~]#sed -i '/SELINUX/s/enforcing/permissive/' /etc/selinux/config
- Modify the monitoring server configuration file (192.168.4.10 host operation).
Refer to the template at the end of the configuration file and add 3 new lines at the end of the file, as follows:
[root@prometheus ~]# vim /usr/local/prometheus/prometheus.yml
scrape_configs:
  - job_name: 'prometheus'
    static_configs:
    - targets: ['192.168.4.10:9090']
  - job_name: 'node1'                    #The monitoring task takes any name
    static_configs:
    - targets: ['192.168.4.11:9100']    #Monitored end host and port
[root@prometheus ~]# systemctl  restart prometheus.service
- View monitoring host and monitoring data.
Access with browser http://192.168.4.10:9090 .
View the list of monitoring hosts, as shown in figure-5.
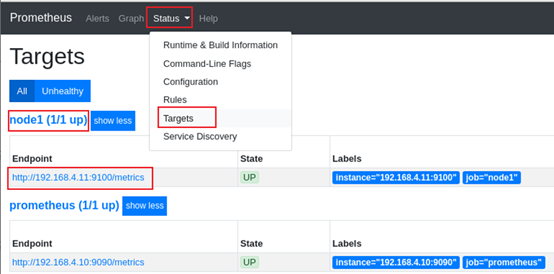
Figure-5
View the host CPU monitoring data, as shown in figure-6.
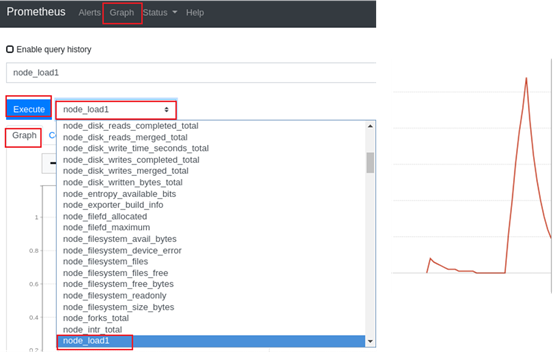
Figure-6
3. grafana visual monitoring data
3.1 problems
In this case, it is required to configure grafana to realize data visualization, and complete the following tasks:
- Installing Grafana
- Modify grafana configuration
- Import visualization template
- View monitoring chart
3.2 steps
To implement this case, you need to follow the following steps.
Step 1: install and deploy grafana (192.168.4.10 host operation)
1) Install the software (the software is provided in the second stage material prometheus_soft.tar.gz)
[root@prometheus ~]# cd prometheus_soft/
[root@prometheus prometheus_soft]# yum -y install grafana-6.7.3-1.x86_64.rpm
[root@prometheus prometheus_soft]# systemctl enable grafana-server.service --now
#Set the grafana service as the startup self startup service, and start the service immediately
Tip: grafana starts port 3000 by default.
2) Reset login password
Browser access to the Grafana console, http://192.168.4.10:3000
The default user name and password are: admin.
The effect of resetting password is shown in figure-7.
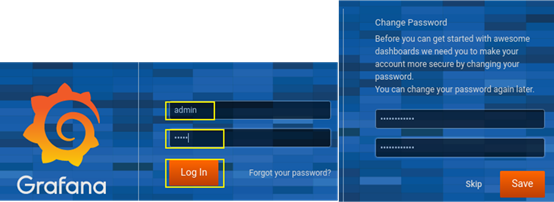
Figure-7
Additional knowledge:
For some browser problems, the password may not be reset. If the password cannot be reset, you can set grafana to allow anonymous login. The specific operations are as follows (do not perform the following operations if necessary):
[root@prometheus ~]# vim /etc/grafana/grafana.ini
[auth.anonymous]
enabled = true
org_role = Admin
[root@prometheus ~]# systemctl restart grafana-server.service
Step 2: configure Grafana
Browser access to the Grafana console, http://192.168.4.10:3000
1) Add data source
Grafana can graph data, so where does the data come from?
Click Add data source and select to obtain data from Prometheus.
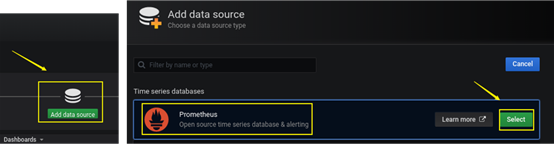
Figure-8
Fill in the basic information of Prometheus, and the effect is shown in figure-9.
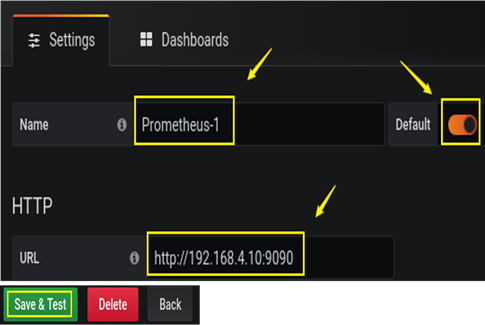
Figure-9
2) Import visualization template
Different data can be displayed graphically by using different visual templates. Now import prometheus graphical template, and the effect is shown in figure-10 and figure-11. Select Prometheus 2.0 Stats.
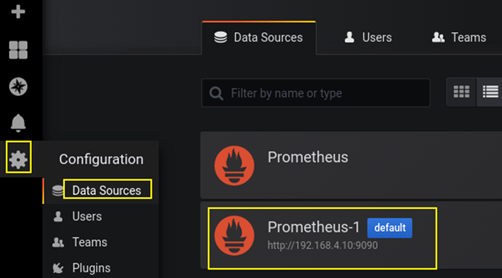
Figure-10
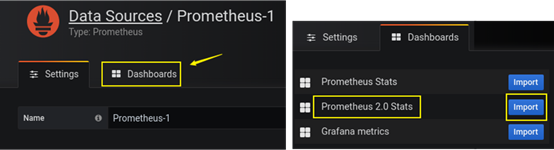
Figure-11
Check the monitoring effect, as shown in figure-12.
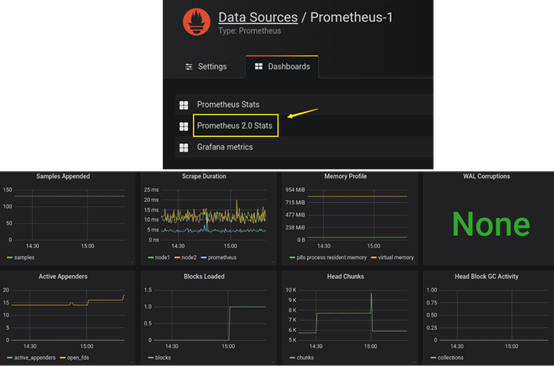
Figure-12
Step 2: view the system information of the monitored host
1) Import visual template for host monitoring (node_exporter template)
Template file in the second stage material prometheus_soft.tar.gz. The addition effect is shown in figure-13.
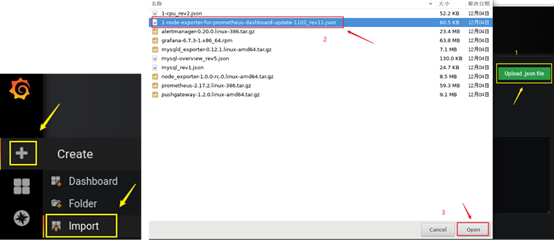
Figure-13
2) Select data source
After importing the visualization template of the monitoring host, we can view the monitoring graphics of the host. However, where to obtain the data of this graphics? We need to set prometheus as the data source, and the effect is shown in figure-14.
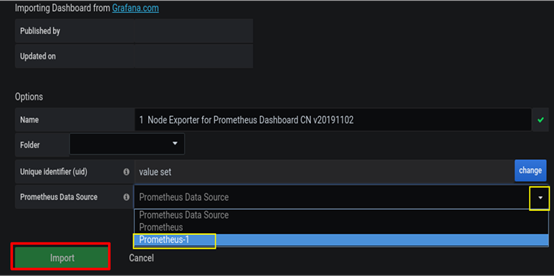
Figure-14
Return to the homepage of Grafana to view the monitoring graphics, and the effect is shown in figure-15 and figure-16.
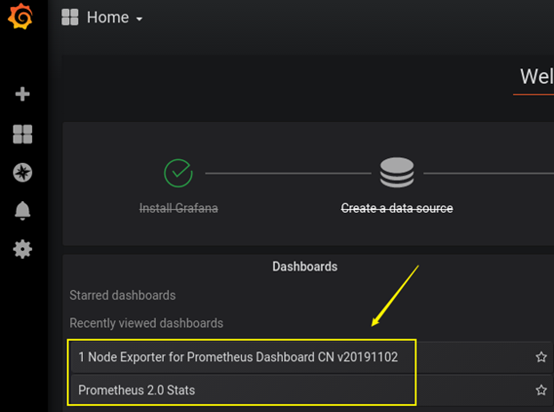
Figure-15
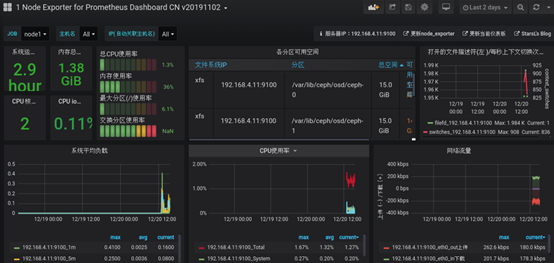
Figure-16
4. Monitoring database
4.1 problems
This case requires prometheus to monitor the MariaDB database and complete the following tasks:
- mount this database
- Install database exporter
- Configure database account and password
- Import monitoring template
4.2 steps
To implement this case, you need to follow the following steps.
Step 1: install MariaDB (monitored host 192.168.4.11 operation)
1) Install the software and start the service
[root@node1~]# yum -y install mariadb-server
[root@node1~]# systemctl enable  mariadb --now
2) Create database account and configure password
To monitor the database, you need to create an account with permission to the database and configure the password.
[root@node1~]# mysql
> grant all on *.* to 'jerry'@'127.0.0.1' identified by '123';
> exit
Note: create the user jerry, who can download 127.0.0 from this machine 0.1 log in to the server, and the user's password is 123.
Step 2: install the configuration exporter
(the software is provided in the second stage material prometheus_soft.tar.gz)
1) Install mysqld_exporter exporter (operated by the monitored host 192.168.4.11).
[root@node1 prometheus_soft]# tar -xf mysqld_exporter-0.12.1.linux-amd64.tar.gz
[root@node1 prometheus_soft]# mv mysqld_exporter-0.12.1.linux-amd64 /usr/local/mysqld_exporter
[root@node1 prometheus_soft]# vim /usr/local/mysqld_exporter/.my.cnf
[client]
host=127.0.0.1
port=3306
user=jerry
password=123
Note: create a database configuration file my.cnf, mysqld_ The exporter automatically reads the configuration file, uses the account and password information used by the configuration file to access the database and obtain the database monitoring information.
2) Write the service file. The default port is 9104 (monitored host 192.168.4.11 operation).
[root@node1~]# vim /usr/lib/systemd/system/mysqld_exporter.service
[Unit]
Description=node_exporter
After=network.target
[Service]
ExecStart=/usr/local/mysqld_exporter/mysqld_exporter \
--config.my-cnf=/usr/local/mysqld_exporter/.my.cnf
[Install]
WantedBy=multi-user.target
#remarks:
#--config. My CNF is mysqld_ The parameter of the exporter program, which specifies the configuration file of the database
#You can use mysqld_exporter -h to see which parameters the program supports
[root@node1~]# systemctl enable mysqld_exporter --now
3) Modify the monitoring server configuration file (192.168.4.10 host operation).
Referring to the original configuration template, manually add the following three lines at the end of the latest file, and restart the service after modification.
[root@prometheus ~]# vim /usr/local/prometheus/prometheus.yml
scrape_configs:
... ...
  - job_name: 'mysql'                    #Name of the monitoring task
    static_configs:
    - targets: ['192.168.4.11:9104']    #Monitored host IP and port
[root@prometheus ~]# systemctl restart prometheus.service
Step 3: configure Grafana visualization
1) View monitoring host (browser access) http://192.168.4.10:9090 ).
Check whether prometheus has identified the MariaDB database host. The effect is shown in figure-17.
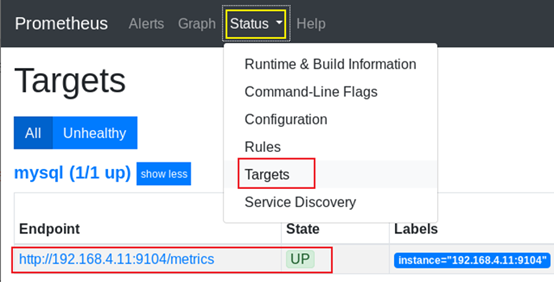
Figure-17
2) Accessing Grafana import database visualization template (browser access) http://192.168.4.10:3000 ).
Import the database visualization template, and the effect is shown in figure-18.
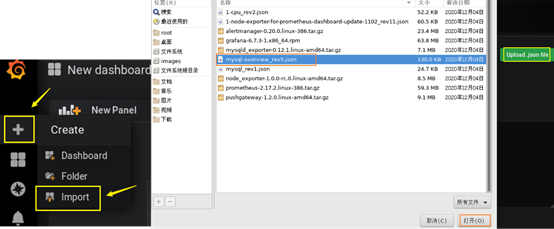
Figure-18
Set the data source from Prometheus, and the effect is shown in figure-19.
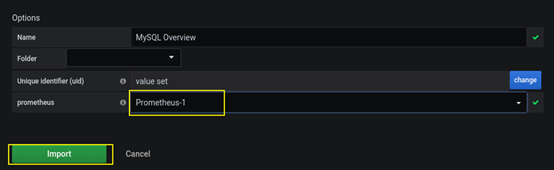
Figure-19
If you are prompted to save the monitoring graph when leaving the monitoring graph, you can enter any name, as shown in figure-20.
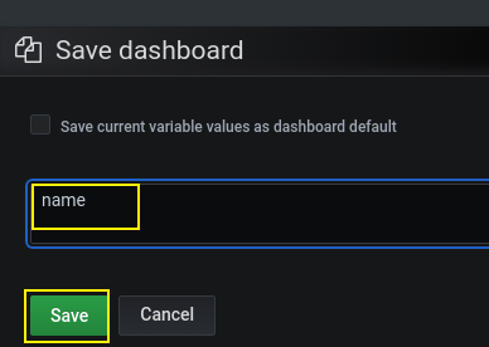
Figure-20
Exercise
1. What is the default database type of Prometheus
Time series database (time tagged database)
2. What is the default port of Prometheus?
9090 port.
3 what data sources does grafana support?
Graphite, InfluxDB, OpenTSDB, Prometheus, Elasticsearch, CloudWatch, KairosDB, etc.
4. MySQL default configuration file name?
my.cnf
In case of infringement, please contact the author to delete