preface
Hello everyone, today I'll tell you about the comprehensive practical exercise of Python - Taking the hot pot loved by the public as an example, how to use our Python language to obtain the number of hot pot stores in different cities across the country and visually display these data?
Next, I will take you to realize this operation, * * based on a certain degree of map data, obtain the data and visualize it through Python technical knowledge** It presents a more intuitive way to browse the distribution of hot pot shops in different provinces and cities across the country. At the same time, at the end of the paper, I will sort out the data required for data visualization and share it with you.
1. Web page analysis
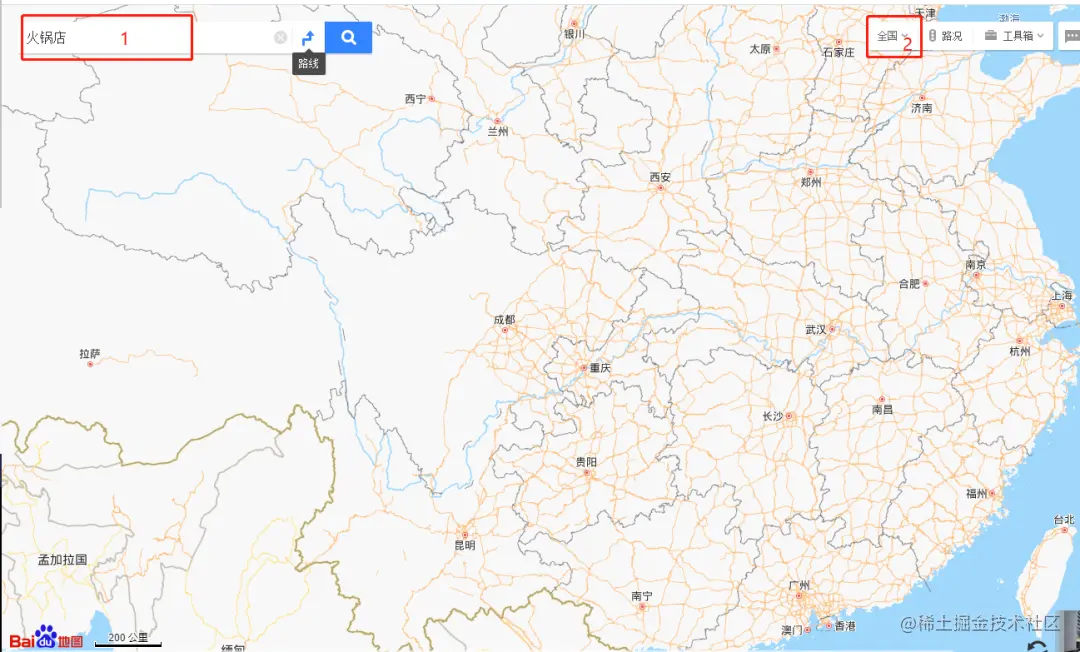
First, take a look at the data source. In a certain degree of map, follow the operation below to request the situation of hotpot stores across the country (it is not shown in the figure below, but the data can be seen through the Network)
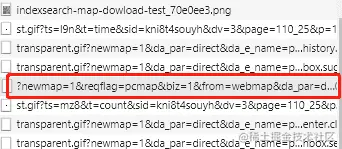
In the network, find the following packet
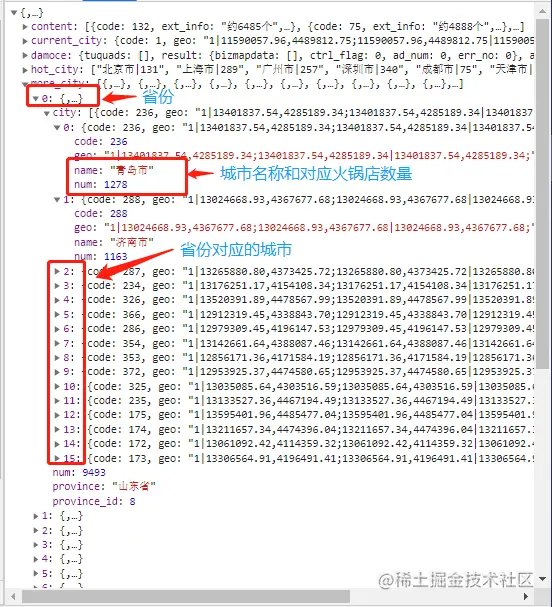
After opening, you can see the json data
2. Obtain data
After analyzing the web page, you can obtain the data with the help of Python technology and save it in excel.
Import related libraries
import json
import requests
import openpyxl</pre>
Copy code
Request data
Let's start writing the request data code (remember to bring headers when requesting)
###Request header = {"user agent": "Mozilla / 5.0 (Windows NT 10.0; win64; x64)
AppleWebKit/537.36 (KHTML, like Gecko) Chrome/89.0.4389.90 Safari/537.36",        'Referer':'https://map.baidu.com/@12949550.923158279,3712445.9716704674,6.28z',        "Cookie":";" Your cookie ",}
##Request link url =“ https://map.baidu.com/?newmap=1&reqflag=pcmap&biz=1&from=webmap&da_par=direct&pcevaname=pc4.1&qt=s&da_src=searchBox.button&wd=%E7%81%AB%E9%94%85%E5%BA%97&c=1&src=0&wd2=&pn=0&sug=0&l=6&b= (10637065.476146251,2368134.592189369;12772445.910805061,5056757.351151566)&from=webmap&biz_ forward={%22scaler%22:1,%22styles%22:%22pl%22}&sug_ forward=&auth=NTSwAZUMzIaTTdWD4WAv0731cWF3MQEauxLxREHzERRtykiOxAXXw1GgvPUDZYOYIZuVt1cv3uVtGccZcuVtPWv3GuztQZ3wWvUvhgMZSguxzBEHLNRTVtcEWe1GD8zv7ucvY1SGpuxVthgW1aDeuxtf0wd0vyMySFIAFM7ueh33uTtAffbDF&seckey=c6d9c7e05d7e627c56ed46fab5d7c5c792064779599d5e12b955a6f18a1204375d1588206c94d22e4bdd1ade0ad06e78c21917e24c6223b96bc51b75ca38651a1b203a0609f126163c 5e82fd0549a068e537303424837ab798acfc9088e5d76a66451c20ebd9599b41c9b4f1371850d20fa442ad464712f54c912422f4fa20b3052f8bb810f30d41c7c0e55af68f9d9d973537f03d0aa0a1d1617d78cae29b49c64c2d2dc3f44cf0f8799234b124a7a2dec18bfa011e097e31a508eae37b8603f97df8f935f04b3652f190eac52d04816f302a582c53971e515ff2e0e2b4cc30446e0bee48d51c4be8b6fe4185589ed9&device_ ratio=1&tn=B_ NORMAL_ MAP&nn=0&u_ loc=12677548,2604239&ie=utf-8&t=1618452491622"
###Response data response = requests get(url,headers=headers). json()
Copy code
The cookie s here can be copied in the browser network.

Through the returned json data, we can know that our target data is in more_ In the city, there is a list, and the data is the province (offer is the name of the province, Num is the number of hot pot shops). Then there is a city (list) in each province, and there is the city corresponding to the province (name is the name of the city, num is the number of hot pot shops in the corresponding city)
response = response['more_city']
for i in response:
    city = i['city']
    print(i['province'])
    print(i['num'])
    for j in city:
        print(j['name'])
        print(j['num'])
Copy code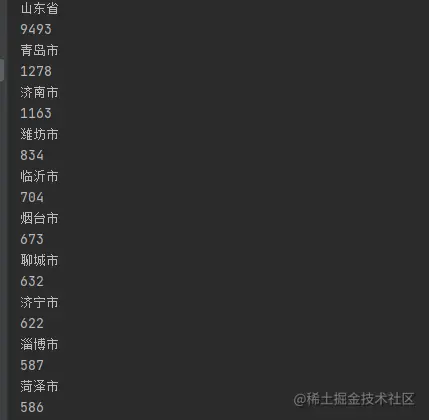
Save to excel
Provinces and cities are saved in two different excel files
outwb_p = openpyxl.Workbook()
outws_p = outwb_p.create_sheet(index=0)
outws_p.cell(row=1, column=1, value="province")
outws_p.cell(row=1, column=2, value="quantity")
outwb_c = openpyxl.Workbook()
outws_c = outwb_c.create_sheet(index=0)
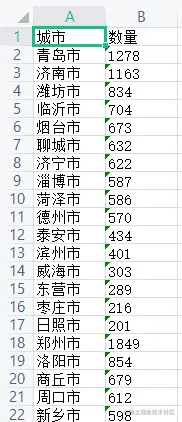
outws_c.cell(row=1, column=1, value="city")
outws_c.cell(row=1, column=2, value="quantity")
##################
###Write data in a loop
##################
### Save the number of hotpot in provinces nationwide - "Li Yunchen"
outwb_p.save("Number of hot pot in China-Li Yunchen.xls") # preservation
### Save the number of national urban hotpot - "Li Yunchen"
outwb_c.save("Number of urban hot pot in China-Li Yunchen.xls") # preservation
Copy code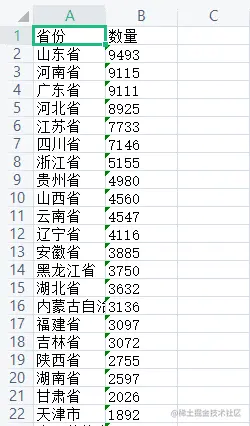
3. Data visualization
1. Number and distribution of hot pot shops in China
datafile = u'Number of hot pot in China-Li Yunchen.xls'
data = pd.read_excel(datafile)
attr = data['province'].tolist()
value = data['quantity'].tolist()
name = []
for i in attr:
    if "province" in i:
        name.append(i.replace("province",""))
    else:
        name.append(i)
from pyecharts import options as opts
from pyecharts.charts import Map
from pyecharts.faker import Faker
c = (
    Map()
        .add("quantity", [list(z) for z in zip(name, value)], "china")
        .set_global_opts(title_opts=opts.TitleOpts(title="Number and distribution of hot pot shops in China"))
        .render("Number and distribution of hot pot shops in China.html")
)
Copy code
You can also draw like this
datafile = u'Number of hot pot in China-Li Yunchen.xls'
df = pd.read_excel(datafile)
province_distribution = df[['province', 'quantity']].values.tolist()
geo = Geo()
geo.set_series_opts(label_opts=opts.LabelOpts(is_show=False))
geo.add_schema(maptype="china")
geo.set_global_opts(visualmap_opts=opts.VisualMapOpts(max_=110000))
# Add data
geo.add('Figure 2 distribution of the number of hot pot shops in China', province_distribution, type_=ChartType.EFFECT_SCATTER)
geo.render("Figure 2 distribution of the number of hot pot shops in China.html")
Copy code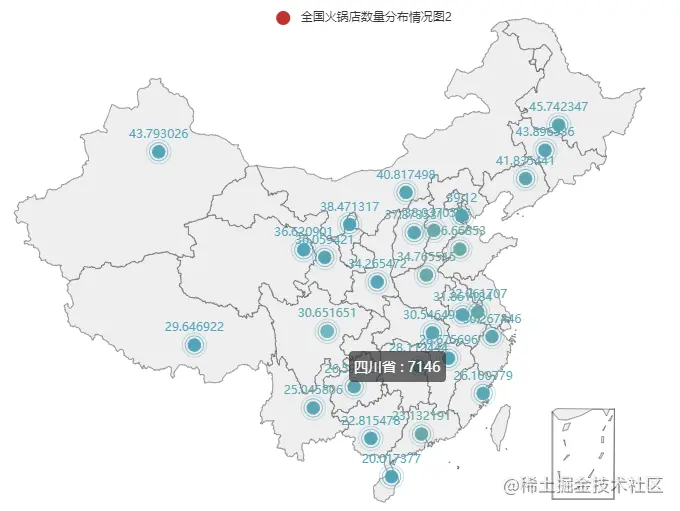
2. Number and distribution of Sichuan hotpot shops
In order to draw the distribution map of cities, Sichuan Province is selected as an example (if all cities in the country are to be drawn, the maps will be dense and unsightly)
datafile = u'Number of urban hot pot in China-Li Yunchen.xls'
data = pd.read_excel(datafile)
city = data['city'].tolist()
values2 = data['quantity'].tolist()

###Sichuan
name = []
value = []
flag = 0
for i in range(0,len(city)):
    if city[i] =="Mianyang City":
        flag = 1
    if flag:
        name.append(city[i])
        value.append(int(values2[i]))

    if city[i] =="Ganzi Tibetan Autonomous Prefecture":
        name.append(city[i])
        value.append(int(values2[i]))
        break
c = (
    Map()
        .add("Number and distribution of Sichuan hotpot shops", [list(z) for z in zip(name, value)], "Sichuan")
        .set_global_opts(
        title_opts=opts.TitleOpts(title="Number and distribution of Sichuan hotpot shops"), visualmap_opts=opts.VisualMapOpts()
    )
        .render("Number and distribution of Sichuan hotpot shops.html")
)
Copy code
Write at the end (with practical learning materials)
The purpose of this article is to make a simple example analysis of visual actual combat operation without too much in-depth discussion. The original intention of writing this article is to throw bricks and attract jade. In order to achieve real mastery, there is no doubt that deeper learning is needed. Next, I have sorted out some reference learning materials and videos for Python visual practice (here is only a simple display) for everyone to learn and give better play. Friends in need can get them here: https://docs.qq.com/doc/DV1VkTEFTYUhrZHRj