Yesterday was the first working day of 2022 and the first trading day of the domestic securities market. What investment goals and expectations do you have in the new year?
Before formulating this year's investment objectives and strategies, you might as well review and analyze the market situation and performance of the fund market in 2021. In the new year, don't be a cut leek, carry out investment activities scientifically and rationally, and unlock the secret of making money and the password of the fund!
Non fund Xiaobai can skip the first part directly.
1. Introduction to the fund
I believe everyone is familiar with the word fund. What is the fund? How is it classified? From which channels can purchase?
1.1. What is a fund
If you have a sum of money and want to invest in money market tools, bonds, stocks and other products to obtain income, but you are not professional enough and do not have enough time to study, and you don't have much money. Then you can find a professional organization for help, and this professional organization is the fund management company.
There are professionals in the fund management company to help you operate your funds and earn income. These professionals are fund managers. They earn money and can get a certain service fee and commission, and the remaining income will be distributed to the customers who buy the fund in proportion.
Of course, we are only for public funds.
1.2. Classification of funds
Generally speaking, funds can be divided into public offering and private placement. Public funds are funds that are open to the public and can be bought by anyone. Generally, the investment threshold of public funds is very low. Most funds can invest 1000 yuan or even hundreds of yuan.
And private equity funds, Xiaobai usually can't buy. These private equity funds, first of all, have a high investment threshold, and generally require investors to have hundreds of thousands or even millions of assets. In other words, we call qualified investors. If they don't have so much money, they are unqualified and unqualified for investment. You can simply understand that private equity funds are specially designed for those rich and high net worth people.
In terms of subdivision direction, funds can be classified in different ways according to different angles and different standards. For example, according to whether the fund units can be increased or redeemed, they can be divided into open-end funds and closed-end funds; According to different organizational forms, it can be divided into corporate funds and contractual funds; According to the difference of investment risk and return, it can be divided into growth fund, income fund and balance fund. We will focus on the following categories:
According to different investment directions and investment products, the more common funds in the market can be divided into: monetary funds, bond funds, stock funds, hybrid funds and index funds.
1.2.1. Monetary Fund
Monetary Fund is a fund with money market instruments as its main investment object. What is a money market tool? In short, it is a financial product similar to money, such as cash itself. In addition to cash, there are short-term treasury bonds, repurchase, time deposits within one year, central bank bills within one year, etc. These financial instruments are characterized by short term, excellent liquidity, ready to be cashed, very safe and reliable. Yu'e Bao is a typical money market fund.
Generally speaking, money market funds are low-risk and low interest rates. Our change and temporary funds are particularly suitable for investing in money market funds, but they are not suitable for long-term investment because their yield is very limited in the long run.
1.2.2. Bond Fund
Bond funds are funds with fixed income financial instruments such as treasury bonds and financial bonds as their main investment objects. When a fund invests more than 80% of its portfolio in bonds, the fund belongs to bond fund.
The risk and return of bond fund will be more stable than that of stock fund. Its characteristics are: low risk and low return; Steady income; The cost is low.
1.2.3. Equity Fund
Stock fund is a fund with equity financial instruments as the main investment object. When more than 80% of the positions in a fund's portfolio are invested in securities, the fund belongs to a stock fund.
Because most of the objects invested in stock funds are stocks, it also has the characteristics of high risk and high return. However, buying a stock fund can effectively spread the investment risk, so its risk will be reduced compared with direct investment in stocks, and the income is considerable compared with direct investment in the stock market. Therefore, it is very suitable for investors who want to invest in the stock market but lack professional investment knowledge.
1.2.4. Hybrid fund
Hybrid fund is a fund that takes money market, fixed income and equity financial instruments as the main investment objects at the same time. According to the different investment proportion of stocks and bonds and investment strategies, hybrid funds can be divided into debt biased funds, equity biased funds, allocation funds and other types.
The characteristic of hybrid fund is to realize the diversification of investment by configuring a variety of different types of assets, so as to balance the income and risk.
1.2.5. Index Fund
Index fund is essentially a kind of passive stock fund. Passive type is a kind of investment concept, which is relative to active type.
Stock index is used to reflect the overall level of various stock prices in the stock market and their changes. For example, the Shanghai Stock Exchange 50 index is a price index compiled by selecting 50 representative stocks from all stocks in the Shanghai Stock Exchange and using the parity of their price changes. For active investment, the goal of fund managers is to take the SSE 50 index as the benchmark and outperform the index for a period of time, so as to obtain more excess returns; For passive investment, the goal of the fund manager is to take the SSE 50 index as the benchmark, add it to the portfolio with similar weight, and obtain the income basically consistent with the index.
1.2.6. FOF fund
In addition to the above fund categories, there is a special fund called FOF, that is, the fund in the fund. FOF fund is a fund that takes the fund as the main investment object. In other words, the managers of such funds screen various funds in the market and select some good funds for investment.
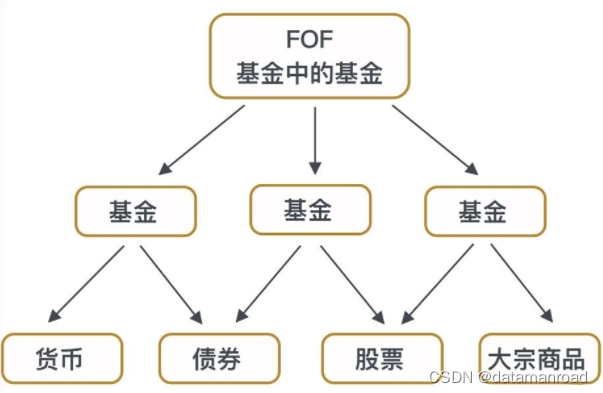
The risk of FOF fund is relatively small. For Xiaobai who has just started, in the face of thousands of funds in the market, the difficulty and risk of individual selection are not low. In fact, FOF is a fund manager who helps investors buy "one basket of funds" at one time and effectively reduces the risk through the secondary fund screening of experts.
1.2.7. Fund risk and return distribution
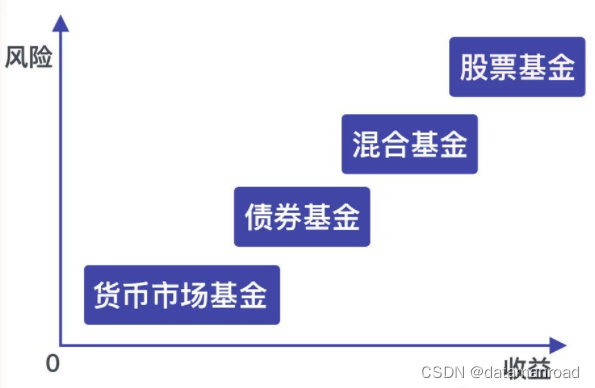
The above is the risk and return distribution diagram of different types of funds. Investors should choose the most suitable fund type according to their own ability and investment purpose.
1.3. Subscription of funds
After the establishment of the fund, the purchase of the fund is called subscription. Different types of funds have different subscription rates. The subscription rates of the fund from high to low are: stock type, mixed type, index type, bond type and currency type. The specific values are as follows:
Stock type (2% ~ 1.5%) ≥ mixed type (2% ~ 1.5%) > index type (1% ~ 1.5%) > bond type (0.5% ~ 1%) > currency type (about 0%)
There are four channels for fund subscription: banks, securities companies, fund companies and third-party fund consignment platforms. The bank has the lowest cost performance, not only has few products, but also has a high subscription rate; The products of securities companies and fund companies are relatively few; The third-party fund consignment platform not only has a large number of products, but also the subscription rate is relatively low, most of which are 10% off.
2. Preparation before fund analysis
The fund data analyzed this time comes from the "egg roll fund". Its page transmits data asynchronously through Ajax. It has a special data interface and needs to be analyzed.
In addition, this time, pyecarts is used for data visual output. Before using pyecarts, you need to install its Python library and set the corresponding parameters.
2.1. URL and message analysis
2.1.1. URL analysis
Through the developer tool of the browser, you can grab the URL submitted by turning the page of the fund list:

Analyze the parameters in its URL:
https://danjuanapp.com/djapi/v3/filter/fund?type=1&order_by=1m&size=20&page=2
The parameter analysis is as follows:
- Type: control fund type, which is the fund classification mentioned above
- order_by: control statistical time period
- size: controls the number of records on a page
- page: control the number of pages
Fund type and time period parameter Dictionary:
# Fund type
fund_type = {"Stock type": 1, "mixed type": 3, "Bond type": 2, "Currency type": 4, "Exponential type": 5, "FOF type": 6, "QDII type": 11}
# Statistical time
fund_time = {'Nearly a week': '1w', 'Last month': '1m', 'Recent March': '3m', 'Nearly June': '6m', 'Nearly a year': '1y', 'Nearly two years': '2y', 'In recent three years': '3y', 'Nearly five years': '5y'}
2.1.2. Message analysis
Check the returned message content and analyze it:
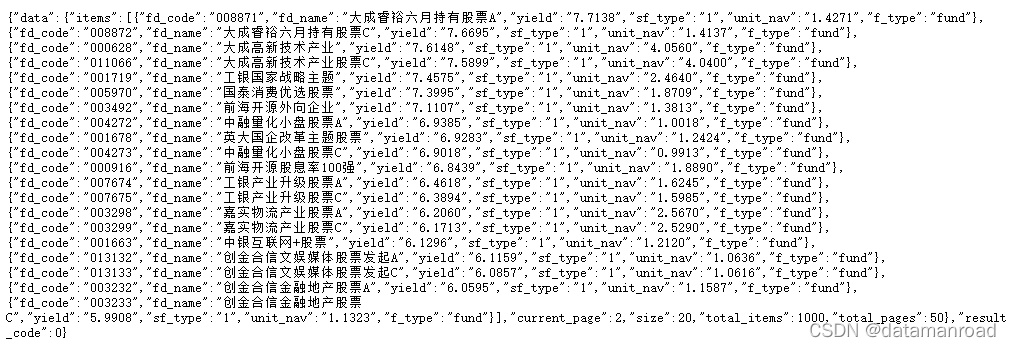
The returned message result is in json format, so it is necessary to introduce json module to process the crawled data.
The analysis methods of other transaction net value, fund size, fund position and other information are similar.
2.2. Data visualization settings
This time, the pie chart and histogram in the pyechards data visualization tool are used to configure the relevant parameters:
# Draw pie chart
def pie(name, value, savetitle, title):
    c = (
        # Initialize the configuration item, and the color can be set internally
        Pie(
            init_opts=opts.InitOpts(
                # background color
                bg_color="#2c343c"
            )
        )
            .add(
            # Series name
            series_name="Fund up and down",
            # Series data items in the format of [(key1,value1),(key2,value2)]
            data_pair=[list(z) for z in zip(name, value)],
            # Size data by radius
            rosetype="radius",
            # The radius of the pie chart, set to the default percentage, relative to half of the smaller item in the height and width of the container
            radius="55%",
            # The center of the pie chart. The first item is the width relative to the container, and the second item is the height relative to the container
            center=["50%", "50%"],
            # Label configuration item
            label_opts=opts.LabelOpts(is_show=False),
        )
            # Global settings
            .set_global_opts(
            # Set title
            title_opts=opts.TitleOpts(
                # name
                title="" + str(title),
                subtitle='hugowong Drawing attention to official account: a few people's way',
                # Location of the assembly from the left side of the container
                pos_left="center",
                # The pixel value of the component above the container
                pos_top="20",
                # Set title color
                title_textstyle_opts=opts.TextStyleOpts(color="#ffffff"),
            ),
            # Legend configuration item parameter, whether to display the components in the figure
            legend_opts=opts.LegendOpts(is_show=False),
        )
            # Series settings
            .set_series_opts(
            # Set prompt
            tooltip_opts=opts.TooltipOpts(
                trigger="item",
                # Display format
                formatter="{a} <br/>{b}: {c}% (occupy{d}%)"
            ),
            # Set label color
            label_opts=opts.LabelOpts(
                color="rgba(255, 255, 255, 0.3)",
                # Display format
                formatter="{b}: {c}%"
            ),
        )
            .render(str(savetitle) + ".html")
    )
For different analysis results, different parameters are needed to configure. The other configuration details are the full code (concerned about the official account number, the answer to the 2021 fund acquisition).
3. Fund performance analysis
Next, according to the analysis requirements, the fund data will be crawled, analyzed, processed, visualized and analyzed.
3.1. Top 10 yield in 2021
Crawl the data of the top 10 returns of various types of funds in recent one year, extract the fund name and return information in the returned json data, and visually output the results in the form of pie chart.
[Code]
# Analysis of return rate of various funds in specified time period
def fund_analyze1():
    for key in fund_type:
        # Crawling data of various funds in recent one year (top 10 each)
        res = requests.get(url=url, headers=headers)
        res.encoding = "utf-8"
        # Parse crawl data
        fund = json.loads(res.text)
        fund = fund["data"]["items"]
        name = []
        value = []
        # Extract fund name and corresponding yield information
        for i in range(0, len(fund)):
            name.append(fund[i]["fd_name"])
            value.append(fund[i]["yield"])
        # Data visual output (pie chart)
        pie(name, value, str(key) + "Top 10 fund revenue in 2021", "[" + str(key) + "]Top 10 fund revenue in 2021")
[results]
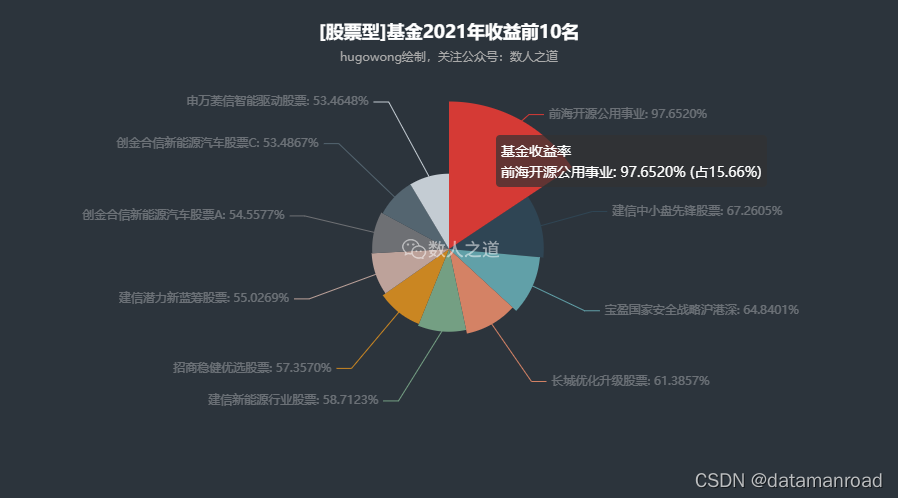
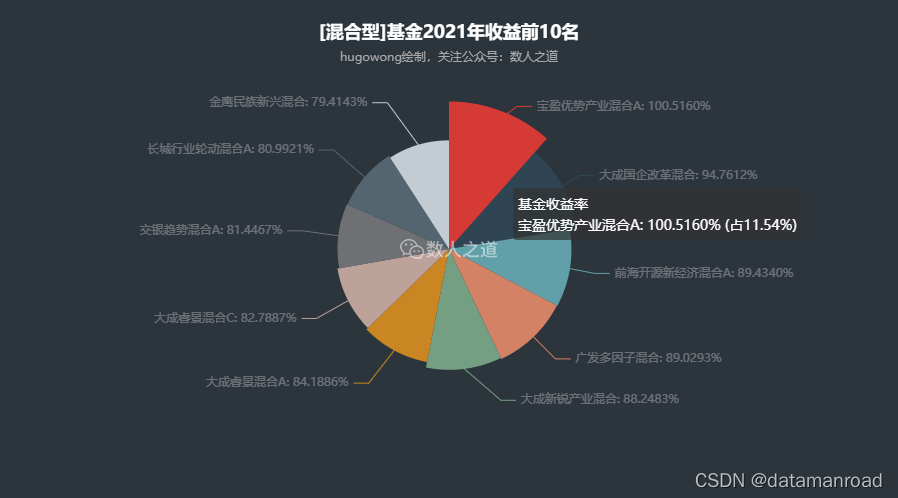
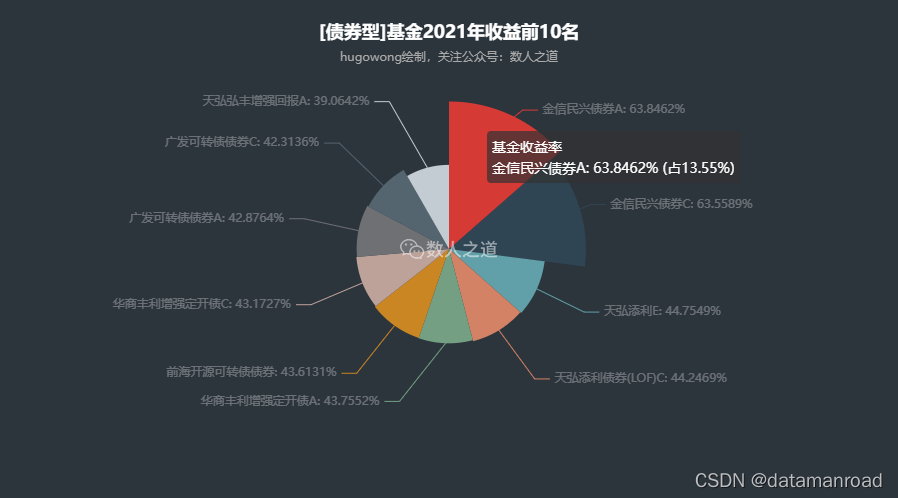
[analysis]
The first place of stock and index funds are far ahead, the top ten yield of hybrid and QDII funds are relatively close (with small standard deviation), and the top ten performance of bond funds is very bright.
3.2. Yield distribution analysis
Climb the data of the top 1000 returns of various types of funds in recent one year, count the number of funds with returns in different grouping intervals, analyze the distribution of returns of various types of funds, and visually output the statistical results in the form of histogram.
[Code]
# Analysis of return distribution of various funds in specified time period
def fund_analyze2():
    for key in fund_type:
        # Crawling data of various funds in recent one year (1000 each)
        res = requests.get(url=url, headers=headers)
        res.encoding = "utf-8"
        # Parse crawl data
        fund = json.loads(res.text)
        fund = fund["data"]["items"]
        name = []
        value = []
        # Extract fund name and corresponding yield information
        for i in range(0, len(fund)):
            name.append(fund[i]["fd_name"])
            try:
                value.append(fund[i]["yield"])
            except:
                value.append(0)

        # Create a data table and convert the yield type to float with four decimal places
        tb_fund = pd.DataFrame({"fund_name": name, "yield": value})
        tb_fund["yield"] = round(tb_fund["yield"].astype(float), 4)

        # Automatically box the yield data of various funds and count the quantity
        count_yield = tb_fund["yield"].value_counts(bins=15).sort_index(ascending=True).to_frame()
        count_yield.columns = ["count_num"]

        name = list(count_yield.index.to_tuples())
        value = count_yield["count_num"].to_list()

        # Data visualization output
        bars_non_slider2(name, value, str(key), str(key) + "Fund yield distribution", "[" + str(key) + "]Distribution of fund yield")
[results]
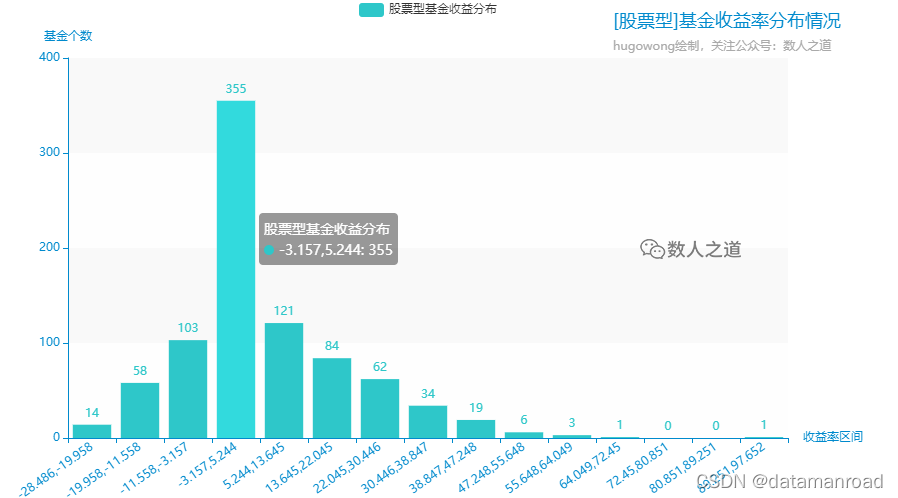
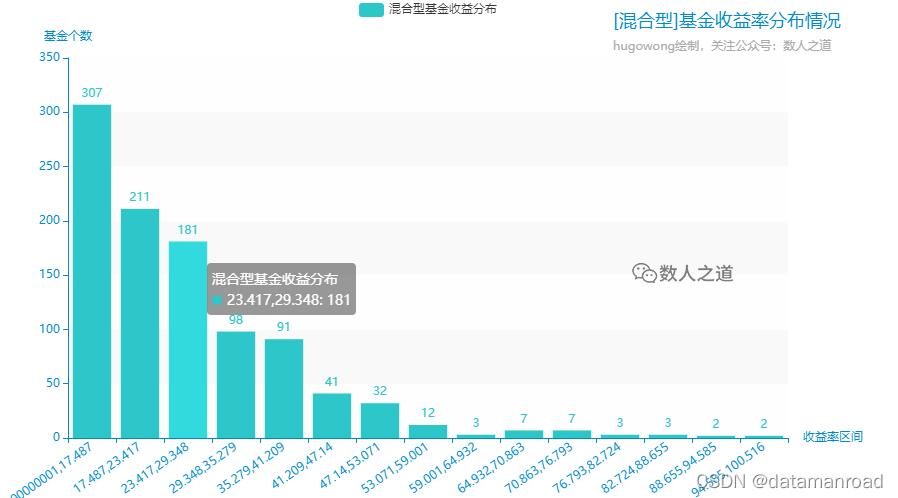
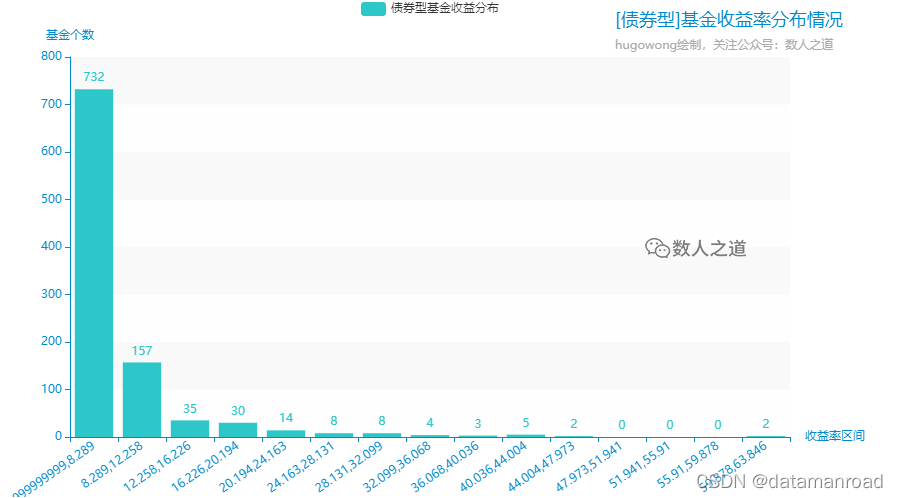

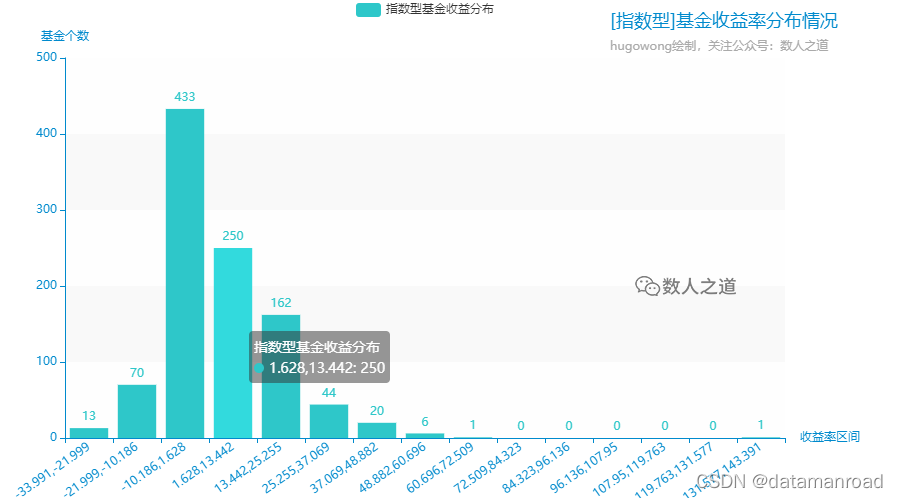
[analysis]
Most of the stock, index and QDII funds are in a loss state, and there are not a few who lose much. At the same time, a few have very high returns. It can be seen that these funds have the characteristics of coexistence of high risk and high returns. Monetary funds are stable, but their returns are less. Bond funds and FOF funds also have a few extraordinary performances in their stable performance. Hybrid funds have the best performance. There are no loss funds, the minimum return is more than 11%, and there is no lack of high return.
Among these types of funds, only hybrid, bond and monetary funds did not suffer losses. Bonds and monetary funds were expected, and such brilliant achievements of hybrid funds were indeed a little unexpected.
3.3. Analysis of rise and fall in each stage
Climb the fund data with the highest yield of all types of funds in recent one year, obtain the rise and fall of their returns in each time period, analyze the performance of excellent funds in each stage, and visually output the results in the form of multi series histogram.
[Code]
# Analysis on the rise and fall of various top ranked funds in different time periods
def fund_analyze3():
    name = ['Nearly a week', 'Last month', 'Recent March', 'Nearly June', 'Nearly a year', 'Nearly two years', 'In recent three years', 'Nearly five years']
    fund_value = {}

    for key in fund_type:
        # Crawling data of various funds in recent one year
        res = requests.get(url=url, headers=headers)
        res.encoding = "utf-8"
        fund = json.loads(res.text)
        # Get the number one fund code
        first_fd_code = fund["data"]["items"][0]["fd_code"]

        # Climb the rise and fall of the first ranked fund in each time period
        res = requests.get(url=f_url, headers=headers)
        res.encoding = "utf-8"
        fund = json.loads(res.text)
        fund = fund["data"]

        f_values = []

        # Add exception handling to avoid missing values; And the conversion rate of return is float type, taking four decimal places
        # Nearly a week
        try:
            f_values.append('%.4f' % float(fund["nav_grl1w"]))
        except:
            f_values.append(0)
        # Last month
        try:
            f_values.append('%.4f' % float(fund["nav_grl1m"]))
        except:
            f_values.append(0)
        # Recent March
        try:
            f_values.append('%.4f' % float(fund["nav_grl3m"]))
        except:
            f_values.append(0)
        # Nearly June
        try:
            f_values.append('%.4f' % float(fund["nav_grl6m"]))
        except:
            f_values.append(0)
        # Nearly a year
        try:
            f_values.append('%.4f' % float(fund["nav_grl1y"]))
        except:
            f_values.append(0)
        # Nearly two years
        try:
            f_values.append('%.4f' % float(fund["nav_grl2y"]))
        except:
            f_values.append(0)
        # In recent three years
        try:
            f_values.append('%.4f' % float(fund["nav_grl3y"]))
        except:
            f_values.append(0)
        # Nearly five years
        try:
            f_values.append('%.4f' % float(fund["nav_grl5y"]))
        except:
            f_values.append(0)

        # Add to dictionary
        fund_value[key] = f_values

    # Data visual output (histogram)
    bars(name, fund_value, "The rise and fall of various first funds in different periods", "Rise and fall of various funds in the first stage")
[results]
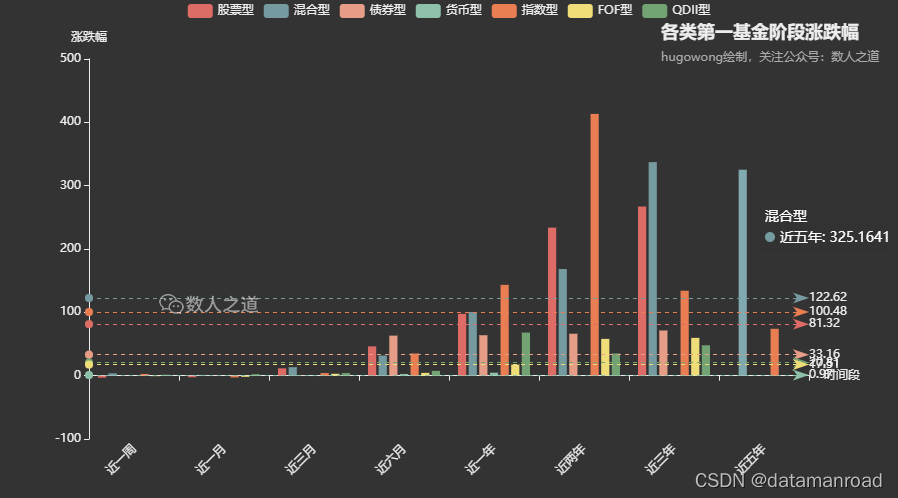
[analysis]
The first place of all types of funds has been mediocre in the past three months, and there are even signs of decline. Stocks, indexes and hybrid funds have ranked first, and their earnings have increased considerably in recent years.
3.4. Net value in recent 60 trading days
Crawl the fund data with the highest yield of all types of funds in recent one year, obtain its historical net value (unit value) data in recent 60 trading days, analyze the historical fluctuation of excellent funds, and visually output the results in the form of regional stretching and scaling histogram.
[Code]
# Analysis on the net value of the first ranked funds in nearly 60 trading days
def fund_analyze4():
    for key in fund_type:
        # Crawling data of various funds in recent one year
        res = requests.get(url=url, headers=headers)
        res.encoding = "utf-8"
        fund = json.loads(res.text)
        # Get the number one fund code
        first_fd_code = fund["data"]["items"][0]["fd_code"]

        # Obtain the net value of the first ranked funds in nearly 60 trading days
        res = requests.get(url=f_url, headers=headers)
        res.encoding = "utf-8"
        fund = json.loads(res.text)
        fund = fund["data"]["items"]
        name = []
        value = []
        for j in range(0, len(fund)):
            name.append(fund[j]["date"])
            value.append(fund[j]["nav"])
        # Visual output of data (histogram with stretching)
        bars_slider(name, value, str(key), str(key) + "Net value of the fund in recent 60 trading days", "[" + str(key) + "]Net value of the fund in recent 60 trading days")
[results]
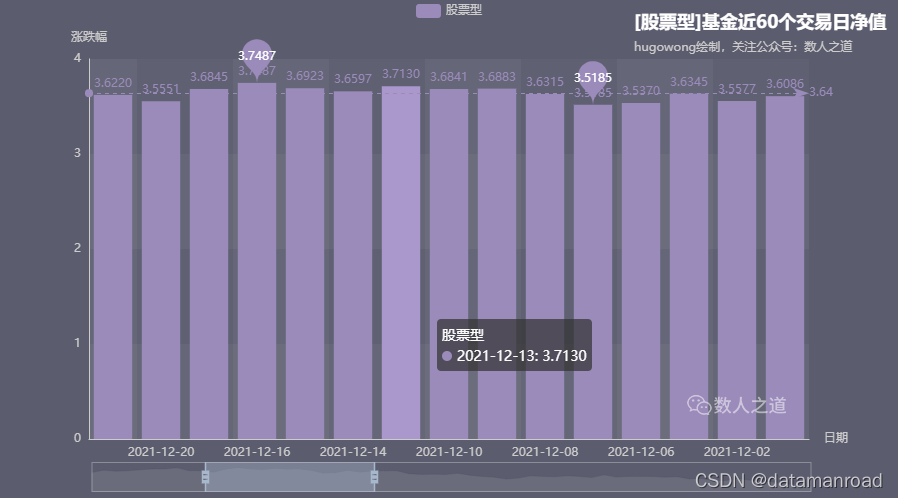

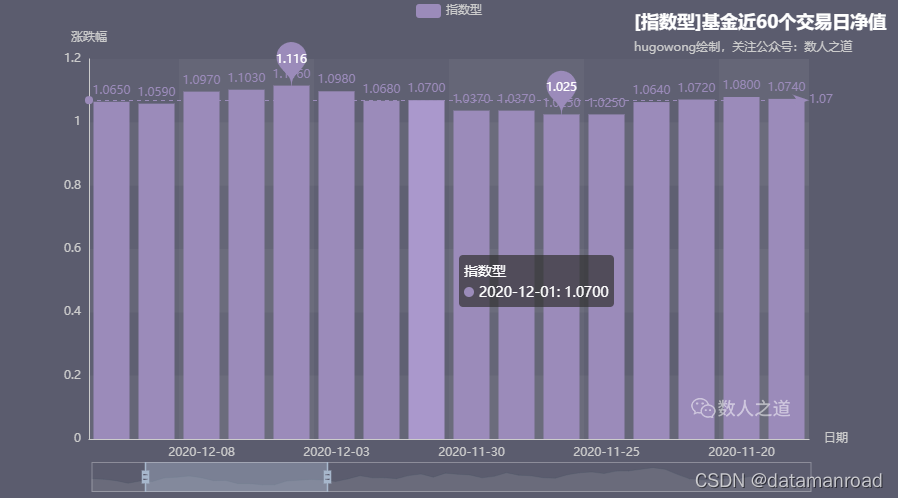
[analysis]
The first stock fund has steadily increased in nearly 60 trading days; The first hybrid fund has been rising steadily for nearly 60 trading days, falling recently and experiencing occasional twists and turns; The first bond fund has a peak in nearly 60 trading days, but it has dropped significantly recently; The first place of index fund is difficult after nearly 60 trading days; QDII fund ranks first in nearly 60 trading days, and its climbing momentum is insufficient.
3.5. Analysis of heavy position stocks
Crawling through the fund data of the top 50 return rate of stock and hybrid funds in recent one year, obtaining the names and corresponding shares of the top 10 positions of each fund, summarizing and statistics, selecting the top 20 positions of stock and hybrid funds, analyzing the most favored stocks of the fund, and visually outputting the results in the form of histogram.
[Code]
# Analysis of heavy positions in stock and hybrid funds
def fund_analyze5():
    for key in fund_type:
        # Data of crawling stock funds and hybrid funds in recent one year (take the top 50 respectively)
        if str(fund_type[key]) == '2':
            break
        res = requests.get(url=url, headers=headers)
        res.encoding = "utf-8"
        fund = json.loads(res.text)
        fund = fund["data"]["items"]
        fd_code = []
        stock_name = []
        percent = []
        # Withdrawal fund code
        for i in range(0, len(fund)):
            fd_code.append(fund[i]["fd_code"])

        # Obtain the name and share of the position shares corresponding to the fund
        for j in range(0, len(fd_code)):
            res = requests.get(url=f_url, headers=headers)
            res.encoding = "utf-8"
            stock = json.loads(res.text)
            stock = stock["data"]["stock_list"]
            for k in range(0, len(stock)):
                stock_name.append(stock[k]["name"])
                percent.append(stock[k]["percent"])
        # Set the interval for each fund request
        time.sleep(0.5)

        # Create data table
        tb_stocks = pd.DataFrame({"stock_name": stock_name, "hold_percent": percent})
        # Aggregate position share
        sum_stocks = tb_stocks.groupby("stock_name", as_index=False).sum()
        # Sort the shares from high to low, and keep two decimal places after converting the shares to format
        sum_stocks = sum_stocks.sort_values("hold_percent", ascending=False)
        sum_stocks["hold_percent"] = round(sum_stocks["hold_percent"].astype(float), 2)

        # Select the top 20 positions
        name = sum_stocks["stock_name"].head(20).to_list()
        value = sum_stocks["hold_percent"].head(20).to_list()

        # Data visualization output
        bars_non_slider(name, value, str(key), str(key) + "Top 20 stocks of the fund", "[" + str(key) + "]Top 20 stocks of the fund")
[results]
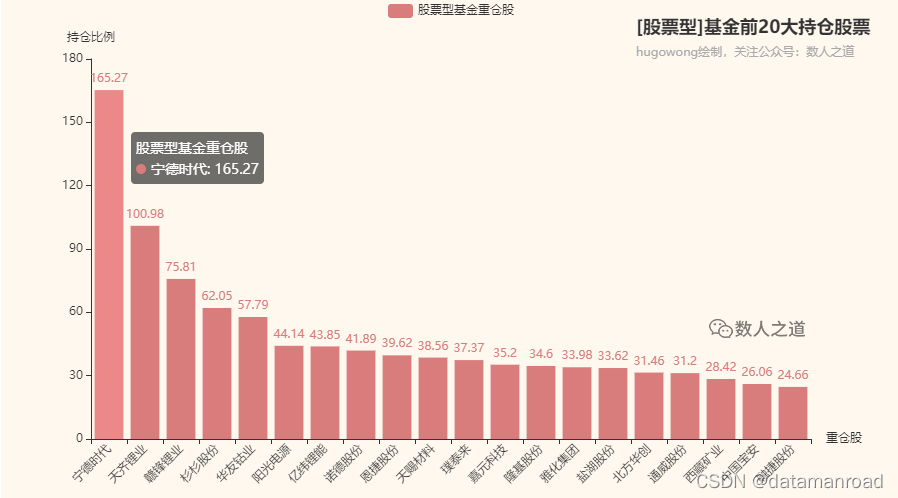
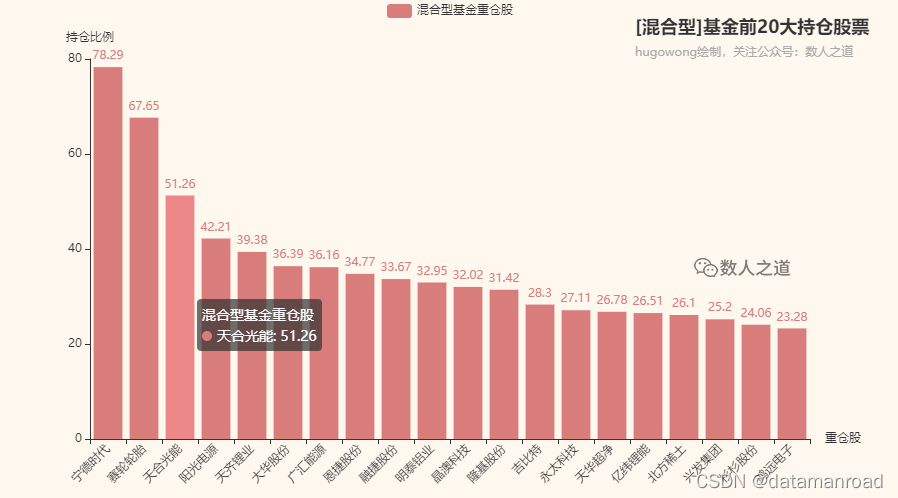
[analysis]
Among equity funds, the most popular star stock is "Ningde era", and the other top five are Tianqi lithium, Ganfeng lithium, Shanshan shares and Huayou cobalt. Four of the top five heavy positions of equity funds are enterprises in the new energy materials industry.
Among hybrid funds, the most popular star stocks are also "Ningde era", and the other top five are Sailun tire, Trina Solar, sunshine power and Tianqi lithium. Four of the top five heavy positions of hybrid funds are also enterprises in the new energy materials industry, and two positions coincide with equity funds.
It seems that investors and fund managers are unanimously optimistic about the new energy materials industry.
4. Conclusion
In view of the limited time and energy, only part of the perspective analysis is made on the crawling fund data this time. You can analyze it from other different perspectives and mine valuable information. For example, asset scale, income comparison between new funds and old funds, analysis of star fund managers and their managed funds, etc.
Finally, a reminder: investment is risky, financial management needs to be cautious! This article does not constitute any investment advice!