1: Background
1. Tell a story
Last October, a friend came to me from wechat and said that his program memory was going to blow up... The screenshot is as follows:

It took a long time and the pictures were cleaned up, but it's ironic that their own program itself is monitoring. As a result, they have a problem. It's too embarrassing 🤣🤣🤣
2: Windbg analysis
1. Managed or unmanaged
This is the first step to identify memory problems. Pass! address -summary and! eeheap -gc two commands can be basically concluded.
0:000> !address -summary
Mapping file section regions...
Mapping module regions...
Mapping PEB regions...
Mapping TEB and stack regions...
Mapping heap regions...
Mapping page heap regions...
Mapping other regions...
Mapping stack trace database regions...
Mapping activation context regions...

--- Usage Summary ---------------- RgnCount ----------- Total Size -------- %ofBusy %ofTotal
Free                                    237     7ffc`1e222000 ( 127.985 TB)           99.99%
<unknown>                               594        3`b9b20000 (  14.901 GB)  95.96%    0.01%
Heap                                    370        0`12a2a000 ( 298.164 MB)   1.88%    0.00%
Image                                  1248        0`0ee5a000 ( 238.352 MB)   1.50%    0.00%
Stack                                   315        0`06780000 ( 103.500 MB)   0.65%    0.00%
Other                                    13        0`001d7000 (   1.840 MB)   0.01%    0.00%
TEB                                     105        0`000d2000 ( 840.000 kB)   0.01%    0.00%
PEB                                       1        0`00001000 (   4.000 kB)   0.00%    0.00%

--- Type Summary (for busy) ------ RgnCount ----------- Total Size -------- %ofBusy %ofTotal
MEM_PRIVATE                            1178        3`ce03d000 (  15.219 GB)  98.00%    0.01%
MEM_IMAGE                              1409        0`0f6fd000 ( 246.988 MB)   1.55%    0.00%
MEM_MAPPED                               59        0`04694000 (  70.578 MB)   0.44%    0.00%

--- State Summary ---------------- RgnCount ----------- Total Size -------- %ofBusy %ofTotal
MEM_FREE                                237     7ffc`1e222000 ( 127.985 TB)           99.99%
MEM_COMMIT                             2326        3`c7543000 (  15.115 GB)  97.33%    0.01%
MEM_RESERVE                             320        0`1a88b000 ( 424.543 MB)   2.67%    0.00%

0:000> !eeheap -gc
Number of GC Heaps: 1
generation 0 starts at 0x0000009902B57670
generation 1 starts at 0x0000009902A56810
generation 2 starts at 0x00000095318C1000
ephemeral segment allocation context: (0x0000009902D724A8, 0x0000009902D724C0)
         segment             begin         allocated         committed    allocated size    committed size
...
00000098FFBE0000  00000098FFBE1000  0000009902D724A8  0000009902D7D000  0x31914a8(51975336)  0x319c000(52019200)
Large object heap starts at 0x00000095418C1000
         segment             begin         allocated         committed    allocated size    committed size
00000095418C0000  00000095418C1000  00000095475D8D98  00000095475D9000  0x5d17d98(97615256)  0x5d18000(97615872)
Total Allocated Size:              Size: 0x398e6cbc8 (15450164168) bytes.
Total Committed Size:              Size: 0x398e7b000 (15450222592) bytes.
------------------------------
GC Allocated Heap Size:    Size: 0x398e6cbc8 (15450164168) bytes.
GC Committed Heap Size:    Size: 0x398e7b000 (15450222592) bytes.
From the output, good guy... The process committed memory is 15G, and the managed heap is almost 15G, which indicates that the current managed memory leak is relatively simple.
2. What is leaking
To know what is leaking, you can first go to the managed heap to see if there are any abnormal objects. Use! dumpheap -stat command.
0:000> !dumpheap -stat
Statistics:
              MT    Count    TotalSize Class Name
...
00007ff8815d0f88  7260233    290409320 System.Collections.ArrayList
00007ff8815e6830  7313696    326240826 System.String
000000952fbbd2b0 12141398    509369998      Free
00007ff880685cf0  7254983    928637824 System.Diagnostics.ProcessInfo
00007ff88065f7d0  7256845   2031916600 System.Diagnostics.Process
00007ff8815e6ea8  7391338   2230744600 System.Object[]
00007ff88068fa70 186800748   8966435904 System.Diagnostics.ThreadInfo
From the perspective of divinatory symbols, it's really strange. If you know the Process class, you should know that ProcessInfo and ThreadInfo are linked under Process, and the ThreadInfo objects are as high as 180 million. It's really strange 🐂👃 It seems that the program is constantly doing Process Start operation.
The next question to explore is who is holding ThreadInfo??? You can choose a few to see them! gcroot, the first and last methods are checked, but there is no reference root, as shown below:
0:000> !gcroot 0000009531e8f760
Found 0 unique roots (run '!GCRoot -all' to see all roots).
0:000> !gcroot 0000009531e8f670
Found 0 unique roots (run '!GCRoot -all' to see all roots).
0:000> !gcroot 0000009531e8f378
Found 0 unique roots (run '!GCRoot -all' to see all roots).
3. Why is no reference root not recycled
Since the object has no reference root, why doesn't GC recycle it? Here we need to talk about experience. In many dump s I analyzed about memory leakage, I look for problems from the production side. It seems that there is no case of looking for problems from the consumer side. The reference model is as follows:
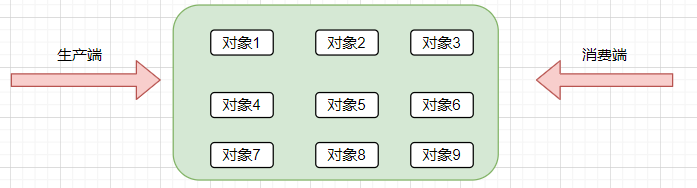
Since the producer has no problem, what problems can there be on the consumer side? You can think about it. The consumer side of the managed heap has at least two roles.
-
GC
-
Finalizer thread
GC will certainly not cause problems, so you can only suspect that there is something wrong with the Finalizer thread, which can be used! The t command calls out all threads to have a look.
0:000> !t
ThreadCount:      9566
UnstartedThread:  0
BackgroundThread: 88
PendingThread:    0
DeadThread:       9471
Hosted Runtime:   no
                                                                                                        Lock
       ID OSID ThreadOBJ           State GC Mode     GC Alloc Context                  Domain           Count Apt Exception
   0    1 40e18 000000952fbdfe50    26020 Preemptive  0000000000000000:0000000000000000 000000952fbd2e40 0     STA
   2    2 41ce8 000000952fc0e4d0    2b220 Preemptive  0000000000000000:0000000000000000 000000952fbd2e40 0     MTA (Finalizer)
   4    4 41cb4 000000954c324970    27220 Preemptive  0000000000000000:0000000000000000 000000952fbd2e40 0     STA
   5    5 41cb8 000000954c36d1e0  2027220 Preemptive  0000000000000000:0000000000000000 000000952fbd2e40 0     STA
   6    6 41c58 000000954c33f070  2027220 Preemptive  0000000000000000:0000000000000000 000000952fbd2e40 0     STA
   7    7 41c38 000000954c33f840    27220 Preemptive  0000000000000000:0000000000000000 000000952fbd2e40 0     STA
   8    8 41e0c 000000954c333580    27220 Preemptive  0000000000000000:0000000000000000 000000952fbd2e40 0     STA
   9    9 41e2c 000000954c354440    27220 Preemptive  0000000000000000:0000000000000000 000000952fbd2e40 0     STA
  10   10 41f24 000000954c355840    27220 Preemptive  0000000000000000:0000000000000000 000000952fbd2e40 0     STA
...
XXXX 9446    0 000000957a233410  8039820 Preemptive  0000000000000000:0000000000000000 000000952fbd2e40 0     MTA (Threadpool Completion Port)
XXXX 9447    0 0000009579f83e30  8039820 Preemptive  0000000000000000:0000000000000000 000000952fbd2e40 0     MTA (Threadpool Completion Port)
XXXX 9450    0 000000957a46dcf0  8039820 Preemptive  0000000000000000:0000000000000000 000000952fbd2e40 0     MTA (Threadpool Completion Port)
XXXX 9449    0 000000957967c6e0  8039820 Preemptive  0000000000000000:0000000000000000 000000952fbd2e40 0     MTA (Threadpool Completion Port)
XXXX 9448    0 000000957aee0010  8039820 Preemptive  0000000000000000:0000000000000000 000000952fbd2e40 0     MTA (Threadpool Completion Port)
XXXX 9452    0 00000095796824a0  8039820 Preemptive  0000000000000000:0000000000000000 000000952fbd2e40 0     MTA (Threadpool Completion Port)
XXXX 9451    0 000000957af05df0  8039820 Preemptive  0000000000000000:0000000000000000 000000952fbd2e40 0     MTA (Threadpool Completion Port)
I'm surprised to see that there are 9566 processes and 9471 dead threads. Based on past experience, this boy doesn't use thread pool and uses new Thread, 🐂👃🦆 , Make complaints about what Finalizer threads are doing, and use ~2s &! dumpstack
0:002> ~2s
ntdll!NtWaitForSingleObject+0xa:
00007ff8`8e220c8a c3              ret
0:002> !dumpstack
OS Thread Id: 0x41ce8 (2)
Current frame: ntdll!NtWaitForSingleObject+0xa
Child-SP         RetAddr          Caller, Callee
0000009549e4e120 00007ff88b591118 KERNELBASE!WaitForSingleObjectEx+0x94, calling ntdll!NtWaitForSingleObject
0000009549e4e1c0 00007ff88da3e334 combase!MTAThreadWaitForCall+0x54 [d:\9147\com\combase\dcomrem\channelb.cxx:5657], calling KERNELBASE!WaitForSingleObject
0000009549e4e210 00007ff88d8fe089 combase!MTAThreadDispatchCrossApartmentCall+0x75 [d:\9147\com\combase\dcomrem\chancont.cxx:193], calling combase!MTAThreadWaitForCall [d:\9147\com\combase\dcomrem\channelb.cxx:5619]
0000009549e4e240 00007ff88da3e13d combase!CRpcChannelBuffer::SendReceive2+0x64b [d:\9147\com\combase\dcomrem\channelb.cxx:4796], calling combase!MTAThreadDispatchCrossApartmentCall [d:\9147\com\combase\dcomrem\chancont.cxx:156]
0000009549e4e2b0 00007ff88e1bb6f7 ntdll!RtlAllocateHeap+0xd7, calling ntdll!RtlpLowFragHeapAllocFromContext
...
0000009549e4f5d0 00007ff8827d79cd clr!ManagedThreadBase_DispatchOuter+0x75, calling clr!ManagedThreadBase_DispatchMiddle
0000009549e4f5e0 00007ff8828601af clr!EEConfig::GetConfigDWORD_DontUse_+0x3b, calling clr!EEConfig::GetConfiguration_DontUse_
0000009549e4f660 00007ff8828574fa clr!FinalizerThread::FinalizerThreadStart+0x10a, calling clr!ManagedThreadBase_DispatchOuter
0000009549e4f6a0 00007ff8827d55b9 clr!EEHeapFreeInProcessHeap+0x45, calling kernel32!HeapFreeStub
0000009549e4f700 00007ff882882e8f clr!Thread::intermediateThreadProc+0x86
0000009549e4f780 00007ff882882e6f clr!Thread::intermediateThreadProc+0x66, calling clr!_chkstk
0000009549e4f7c0 00007ff88dcd13d2 kernel32!BaseThreadInitThunk+0x22
0000009549e4f7f0 00007ff88e2003c4 ntdll!RtlUserThreadStart+0x34
From the stack information, it turns out that the terminator thread is stuck. From the mtathreaddispatchcrossapatmentcall method, it seems that MTA made a call to STA. Experienced friends here should know that this has something to do with COM components, that is, the Finalizer thread cannot release COM objects created by STA threads, Which thread creates COM components that are not reasonably released?
4. Find the thread that creates the COM component
To tell you the truth, it's hard to find the answer if you don't know about COM components, but there's no unique way. When I look back at the thread list, I find that there are 38 STA threads. The screenshot is as follows:
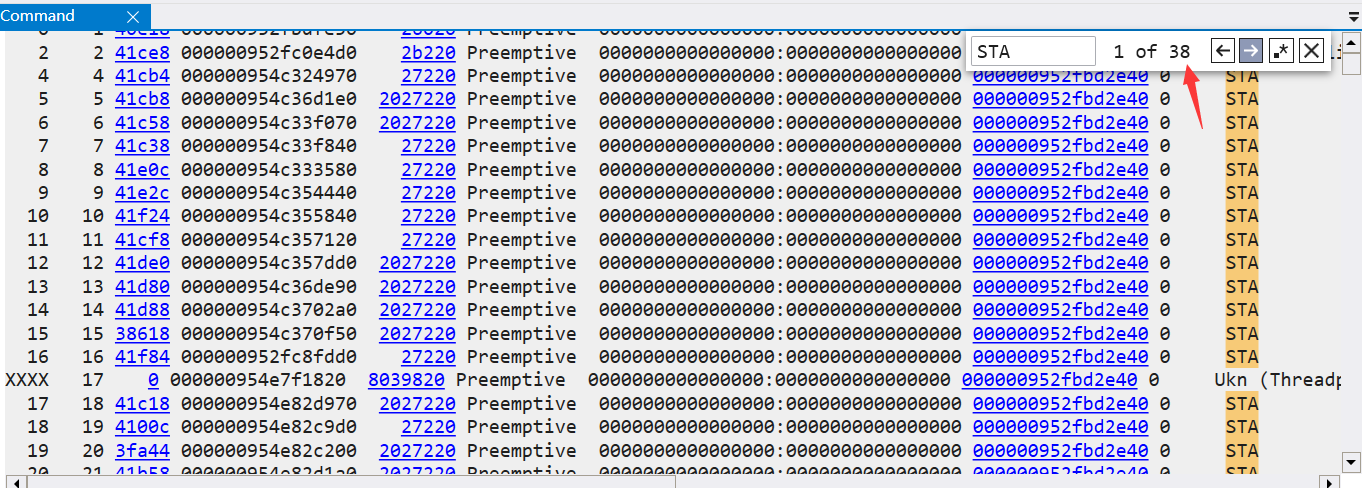
There must be a problem. Next, take a thread to see how the call stack works.
0:004> !clrstack
OS Thread Id: 0x41cb4 (4)
        Child SP               IP Call Site
000000954da1ee38 00007ff88e220c8a [HelperMethodFrame: 000000954da1ee38] System.Threading.Thread.SleepInternal(Int32)
000000954da1ef30 00007ff88138c20a *** WARNING: Unable to verify checksum for mscorlib.ni.dll
System.Threading.Thread.Sleep(Int32)
000000954da1ef60 00007ff82322437f xxx.CFileLogTask.DoWork()
000000954da1f160 00007ff8232234d6 xxx.CTask.InitStart()
000000954da1f240 00007ff8813c31d3 System.Threading.ExecutionContext.RunInternal(System.Threading.ExecutionContext, System.Threading.ContextCallback, System.Object, Boolean)
000000954da1f310 00007ff8813c3064 System.Threading.ExecutionContext.Run(System.Threading.ExecutionContext, System.Threading.ContextCallback, System.Object, Boolean)
000000954da1f340 00007ff8813c3032 System.Threading.ExecutionContext.Run(System.Threading.ExecutionContext, System.Threading.ContextCallback, System.Object)
000000954da1f390 00007ff8813bc812 System.Threading.ThreadHelper.ThreadStart()
000000954da1f5e8 00007ff8827d6bb3 [GCFrame: 000000954da1f5e8]
000000954da1f938 00007ff8827d6bb3 [DebuggerU2MCatchHandlerFrame: 000000954da1f938]
Next, decompile XXX CFileLogTask. The dowork () method to see how it is executed by the Thread.
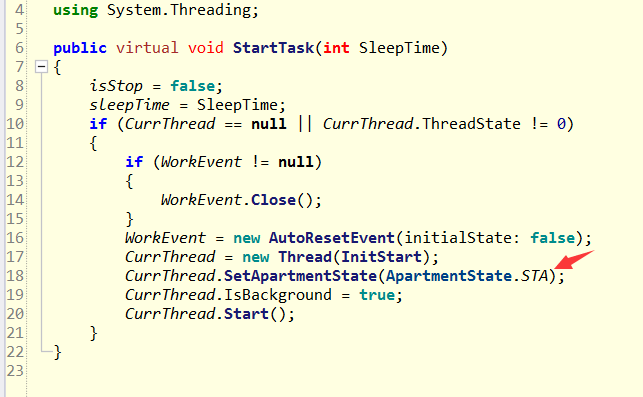
It finally came out here. The culprit was currthread SetApartmentState(ApartmentState.STA); In this sentence, I don't know why to open a Thread and give an sta...
3: Summary
This accident is mainly due to the use of COM components on the STA Thread, which causes the Finalizer Thread of MTA model to get stuck when releasing, and this Thread is useless Run starts the message cycle, and the STA is also in Sleep state. I personally feel that the two cannot communicate. The suggestion to my friend is to remove the STA of Thread.
In fact, a good point here is that when memory soars, it is not necessarily a problem on the production side, but also on the consumer side.