Original link: http://tecdat.cn/?p=18359
Original source: Tuo end data tribal official account
Power load forecasting is the basis of power grid planning, and its level will directly affect the quality of power grid planning. In order to accurately predict power load, it is necessary to model. In this paper, quantile regression, GAM spline curve, exponential smoothing and SARIMA model are used in R language to predict and compare power load time series.
Electricity consumption
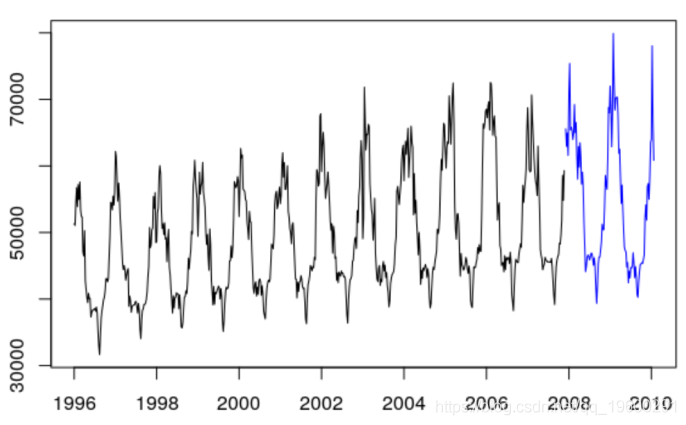
The data used in this paper is the weekly power consumption data from 1996 to 2010
load ("Load.RData")
plot (ts( data = Load , start= 1996 , frequency = 52) )
Electricity consumption variables and their influencing factors:
• day of the week (discrete)
• time hours (discrete or nonparametric)
• years (continuous)
Interaction:
• date and time
• year and time
activity
• public holidays
Effect of temperature on the model: high temperature, low temperature and extreme cold temperature
Model:
Piecewise linear function,
Spline curve in GAM model
Data exploration
Influence of time on power load
> plot ( NumWeek , Load )

Effect of temperature on power load, (Tt, Yt)
> plot ( Temp , Load )

The influence of autocorrelation of load series (Yt),
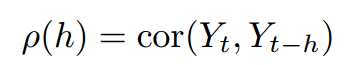

> acf (Load )
OLS and median regression
The median regression is stable by monotonic transformation. 


lm(y˜x, data =df)
lm(y˜x, data =df , tau =.5)
Now, the median regression will always have two observations.
which ( predict ( fit ))
21 46


Quantile regression and exponential smoothing
Simple exponential smoothing: 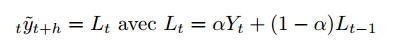
Classically, we seek to minimize the prediction error α, Namely 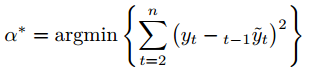
X=as. numeric ( Nile )
SimpleSmooth = function (a){

for (t in 2:T{L\[t=a\*X\[t+(1 -a)\*L\[t -1

}lines ( SimpleSmooth (.2) ,col =" red ")
V= function (a){

for (t in 2:T){
L\[t\]=a\*X\[t\]+(1 -a)\*L\[t -1\]
erreur \[t\]=X\[t\]-L\[t -1\] }
return ( sum ( erreur ˆ2) )

optim (.5 ,V)$ par
\[1\] 0.2464844
hw= HoltWinters (X, beta =FALSE
hw$ alpha
\[1\] 0.2465579
We can consider quantile error 
HWtau = function ( tau ){
loss = function (e) e*(tau -(e< ;=0) *1)
V= function (a){


for (t in 2:T){
L\[t\]=a\*X\[t+(1 -a)\*L\[t -1
erreur \[t=X\[t-L\[t -1
return ( sum ( loss ( erreur

optim (.5 ,V)$ par
plot (X, type ="b",cex =.6

lines ( SimpleSmooth ( HWtau (.8,col=" blue ",
lwd =2)


Double exponential smoothing
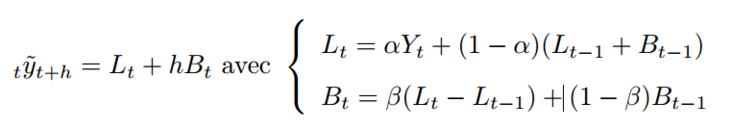
We consider quantile error 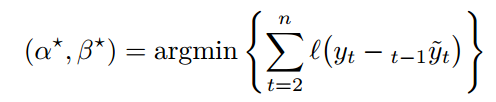
among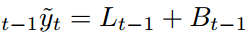 .
.
hw= HoltWinters (X, gamma =FALSE ,l. start =X\[1\])
hw$ alpha
alpha
0.4223241
hw$ beta
beta
0.05233389

DouSmo = function (a,b){

for (t in 2:T){
L\[t\]=a\*X\[t+(1 -a\*(L\[t -1\]+ B\[t -1\]
B\[t\]=b*(L\[t\]-L\[t -1\]) +(1 -b*B\[t -1\]
return (L+B)

forecast
Mathematical statistics is based on the estimation of probability model parameters and hypothesis test.
Prediction in Statistics: when the model fits the observed values, it will provide good prediction.
Instead, we use scenarios that have not occurred before, which enables us to assess major trends in the future rather than the ability to predict extreme events.
Construction of prediction variables
plot (ts( data = Load $Load , start =
1996 , frequency = 52) ,col =" white "
regression
plot (ts( data = Temp , start =
1996 , frequency = 52) ,
lines (ts( data = train $Temp , start =
1996 , frequency = 52) )
lines (ts( data = test $Temp , start =
1996+620 /52, frequency = 52)

SARIMA model, s = 52 
ARIMA = arima (z, order =c(1 ,0 ,0 ,seasonal =list ( order =c(0 ,1 ,0 ,period =52
plot ( forecast (ARIMA ,h =112 )


Most popular insights
1.Using lstm and python for time series prediction in Python
2.Using long-term and short-term memory model lstm to predict and analyze time series in python
3.Time series (arima, exponential smoothing) analysis using r language
4.r language multivariate copula GARCH model time series prediction
5.r language copulas and financial time series cases
6.Using r language random fluctuation model sv to deal with random fluctuations in time series
7.tar threshold autoregressive model of r language time series
8.r language k-shape time series clustering method for stock price time series clustering