I don't know how many little friends stay in place for the new year this year. Although I can't go back to my hometown this year, I have to buy new year goods and give gifts to my family and elders. So out of curiosity, I used the crawler to obtain the data of a treasure, and combined with Python data analysis and third-party visualization platform to analyze what we bought for the new year. The analysis results are as follows:
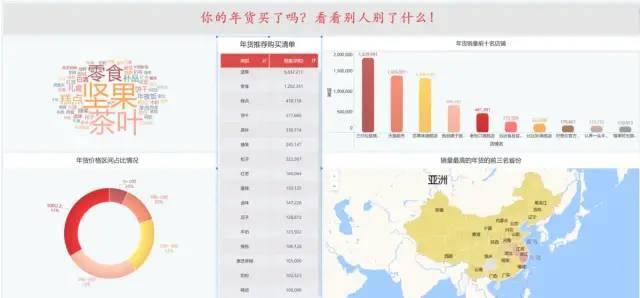
After using the cleaned data, it is completed with finebi third-party visualization tool. The following is the implementation process in Python. The description of this article is mainly divided into the following five steps:
- Analysis ideas
- Reptile part
- Data cleaning
- Data visualization and analysis
- Conclusions and recommendations
1, Analysis ideas
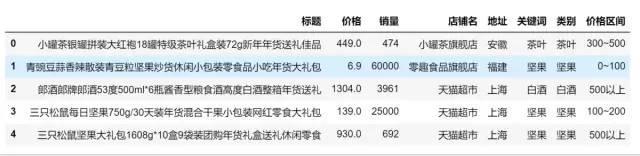
In fact, in terms of today's data, we mainly do exploratory analysis; First, sort out the existing fields, including title (extracted product category), price, sales volume, store name and place of shipment. Here are the detailed dimension splitting and visual graphic selection:
Category:
- What are the TOP 10 categories of sales? (table or horizontal bar chart)
- Popular (most frequent) category display; (word cloud)
Price: price range distribution of annual goods; (doughnut, observation proportion)
Sales volume and store name:
- What are the TOP 10 stores with the highest sales volume? (bar chart)
- Linkage with categories, such as ordering nuts, corresponding to the stores displaying sales ranking; (linkage, using tripartite tools)
Place of shipment: which cities have the highest sales volume? (map)
2, Crawl data
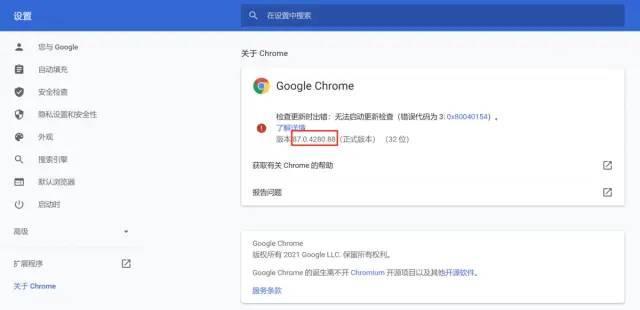
Crawling mainly uses selenium to simulate clicking on the browser. The premise is that selenium and browser driver have been installed. Here I use Google browser. After finding the corresponding version number and downloading the corresponding version driver, I must correspond to the version number of the browser.
pip install selenium
After successful installation, run the following code, enter the keyword "annual goods", scan the code, and wait for the program to collect slowly.
# coding=utf8
import re
from selenium.webdriver.chrome.options import Options
from selenium import webdriver
import time
import csv


# Search for products and get product page number
def search_product(key_word):
    # Positioning input box
    browser.find_element_by_id("q").send_keys(key_word)
    # Define the button and click
    browser.find_element_by_class_name('btn-search').click()
    # Maximize window: for our convenience, scan the code
    browser.maximize_window()
    # Wait 15 seconds, give us enough time to scan the code
    time.sleep(15)
    # Locate the "page number" and get "100 pages of text"
    page_info = browser.find_element_by_xpath('//div[@class="total"]').text
    # It should be noted that findall() returns a list. Although there is only one element, it is also a list.
    page = re.findall("(\d+)", page_info)[0]
    return page


# get data
def get_data():
    # Through page analysis, it is found that all information is under the items node
    items = browser.find_elements_by_xpath('//div[@class="items"]/div[@class="item J_MouserOnverReq  "]')
    for item in items:
        # parameter information
        pro_desc = item.find_element_by_xpath('.//div[@class="row row-2 title"]/a').text
        # Price
        pro_price = item.find_element_by_xpath('.//strong').text
        # Number of payers
        buy_num = item.find_element_by_xpath('.//div[@class="deal-cnt"]').text
        # Flagship store
        shop = item.find_element_by_xpath('.//div[@class="shop"]/a').text
        # Place of shipment
        address = item.find_element_by_xpath('.//div[@class="location"]').text
        # print(pro_desc, pro_price, buy_num, shop, address)
        with open('{}.csv'.format(key_word), mode='a', newline='', encoding='utf-8-sig') as f:
            csv_writer = csv.writer(f, delimiter=',')
            csv_writer.writerow([pro_desc, pro_price, buy_num, shop, address])


def main():
    browser.get('https://www.taobao.com/')
    page = search_product(key_word)
    print(page)
    get_data()
    page_num = 1
    while int(page) != page_num:
        print("*" * 100)
        print("Crawling to No{}page".format(page_num + 1))
        browser.get('https://s.taobao.com/search?q={}&s={}'.format(key_word, page_num * 44))
        browser.implicitly_wait(25)
        get_data()
        page_num += 1
    print("Data crawling completed!")


if __name__ == '__main__':
    key_word = input("Please enter the item you want to search for:")
    option = Options()
    browser = webdriver.Chrome(chrome_options=option,
                               executable_path=r"C:\Users\cherich\AppData\Local\Google\Chrome\Application\chromedriver.exe")
    main()
The acquisition results are as follows:
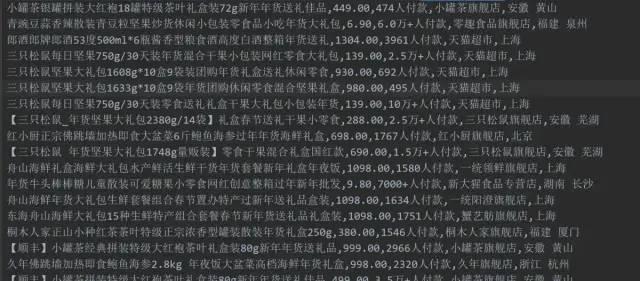
The data preparation is completed, and the process of extracting categories from the title is time-consuming. It is recommended that you use the sorted data directly.
The general idea is to segment the title, name entity recognition, mark nouns, and find out category names, such as nuts, tea, etc.
3, Data cleaning
The file cleaning here is almost done with Excel. The data set is small and the efficiency of using Excel is very high. For example, a price range is made here. By now, data cleaning has been completed (visualization can be done with three-party tools). If everyone likes to toss, you can go on to see how to analyze with Python.
4, Data visualization and analysis
1. Read file
import pandas as pd
import matplotlib as mpl
mpl.rcParams['font.family'] = 'SimHei'
from wordcloud import WordCloud
from ast import literal_eval
import matplotlib.pyplot as plt
datas = pd.read_csv('./New year goods.csv',encoding='gbk')
datas
2. Visualization: word cloud
li = []
for each in datas['key word'].values:
    new_list = str(each).split(',')
    li.extend(new_list)
def func_pd(words):
    count_result = pd.Series(words).value_counts()
    return count_result.to_dict()

frequencies = func_pd(li)
frequencies.pop('other')

plt.figure(figsize = (10,4),dpi=80)
wordcloud = WordCloud(font_path="STSONG.TTF",background_color='white', width=700,height=350).fit_words(frequencies)
plt.imshow(wordcloud)
plt.axis("off")
plt.show()

Chart Description: we can see the word cloud chart. The font of the popular (most frequent) categories is the largest, followed by nuts, tea, cakes, etc.
3. Visualization: drawing doughnuts
# plt.pie(x,lables,autopct,shadow,startangle,colors,explode)
food_type = datas.groupby('Price range').size()
plt.figure(figsize=(8,4),dpi=80)
explodes= [0,0,0,0,0.2,0.1]
size = 0.3
plt.pie(food_type, radius=1,labels=food_type.index, autopct='%.2f%%', colors=['#F4A460','#D2691E','#CDCD00','#FFD700','#EEE5DE'],
       wedgeprops=dict(width=size, edgecolor='w'))
plt.title('Proportion of annual price range',fontsize=18)
plt.legend(food_type.index,bbox_to_anchor=(1.5, 1.0))
plt.show()
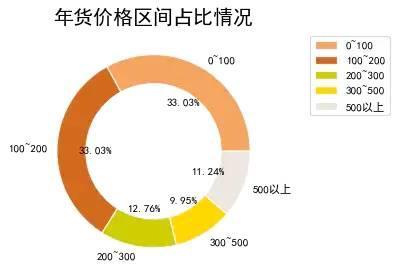
Chart Description: the doughnut chart is similar to the pie chart, which represents the proportion of parts relative to the whole. It can be seen that the annual goods of 0 ~ 200 yuan are about 33%, and that of 100 ~ 200 yuan is also 33%. It shows that the price of most annual goods tends to be less than 200.
4. Visualization: drawing bar charts
data = datas.groupby(by='Shop name')['sales volume'].sum().sort_values(ascending=False).head(10)
plt.figure(figsize = (10,4),dpi=80)

plt.ylabel('sales volume')
plt.title('Top 10 stores in annual sales',fontsize=18)
colors = ['#F4A460','#D2691E','#CDCD00','#EEE5DE', '#EEB4B4', '#FFA07A', '#FFD700']
plt.bar(data.index,data.values, color=colors)
plt.xticks(rotation=45)
plt.show()
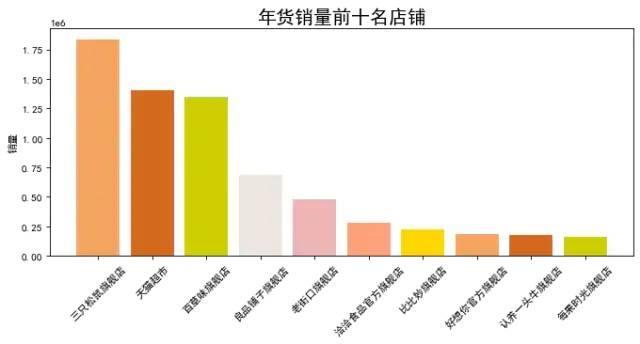
Chart Description: the above is the ranking of stores by sales volume. You can see that the first is the flagship store of three squirrels. It seems that everyone likes to eat dry goods during the new year.
5. Visualization: drawing horizontal bars
foods = datas.groupby(by='category')['sales volume'].sum().sort_values(ascending=False).head(10)
foods.sort_values(ascending=True,inplace=True)
plt.figure(figsize = (10,4),dpi=80)
plt.xlabel('sales volume')
plt.title('Annual recommended purchase list',fontsize=18)
colors = ['#F4A460','#D2691E','#CDCD00','#CD96CD','#EEE5DE', '#EEB4B4', '#FFA07A', '#FFD700']
plt.barh(foods.index,foods.values, color=colors,height=1)
plt.show()
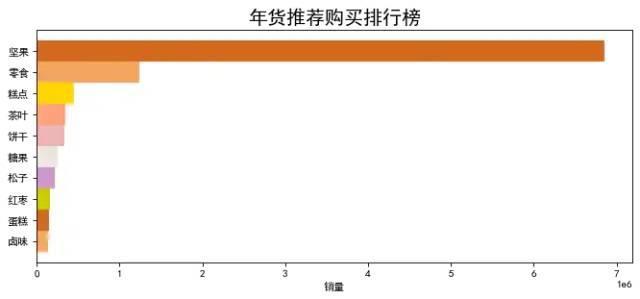
Chart Description: according to the category sales ranking, the first is nuts, which verifies the above hypothesis. Everyone likes to eat nuts.
Conclusions and recommendations
Special purchases for the Spring Festival of Taobao: nuts, tea, cakes, biscuits, candy, Baijiu, walnuts, mutton, sea cucumber and medlar.
Recommended list of annual goods (by sales): nuts, snacks, cakes, biscuits, tea, candy, pine nuts, red dates, cakes, stewed, melon seeds, milk and walnuts;
Annual price reference: more than 66% of annual prices are between 0 and 200 yuan;
Popular shops: three mice, tmall supermarket, baicaowei and liangpin shop;