1. Use of alarm platform
Here, we choose to combine with Ruixiang cloud to build the alarm platform;
- register
Link: link Register;

After registration, click the CA on the left to enter the alarm platform for configuration, combined with zabbix;
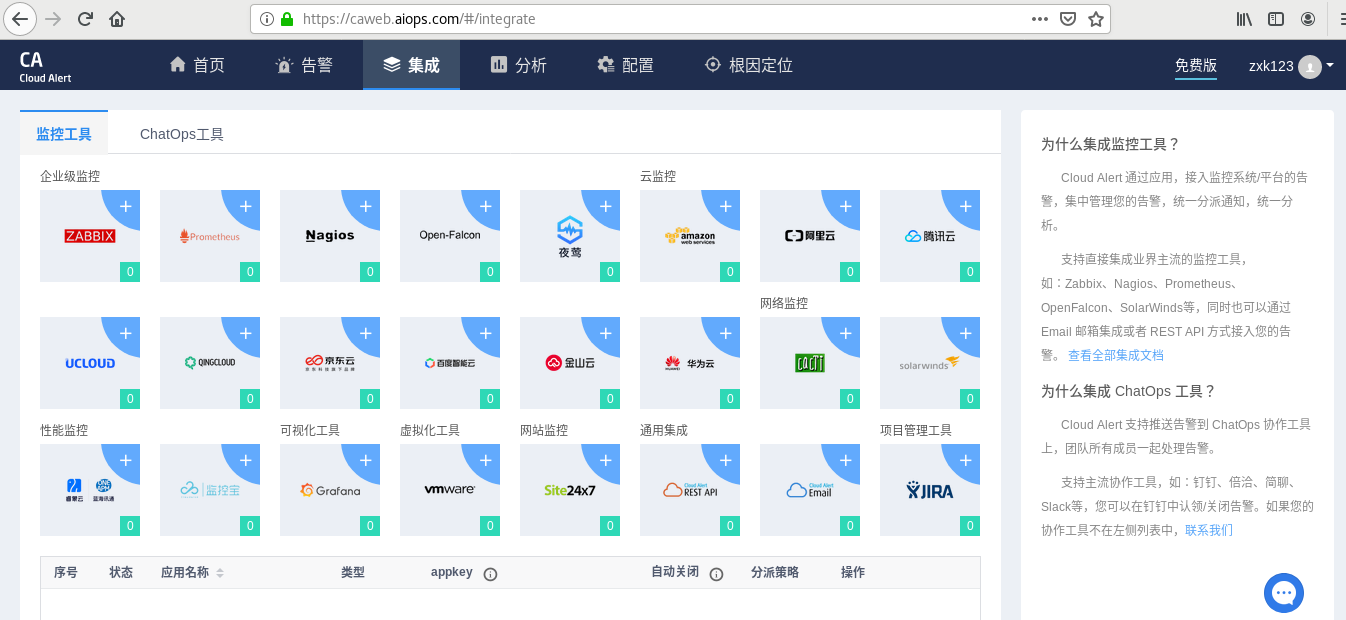
Click the monitoring zabbix to be combined; Then the following interface appears:

Enter the application name, click save and get the application key; Then you will get a key, as shown below;
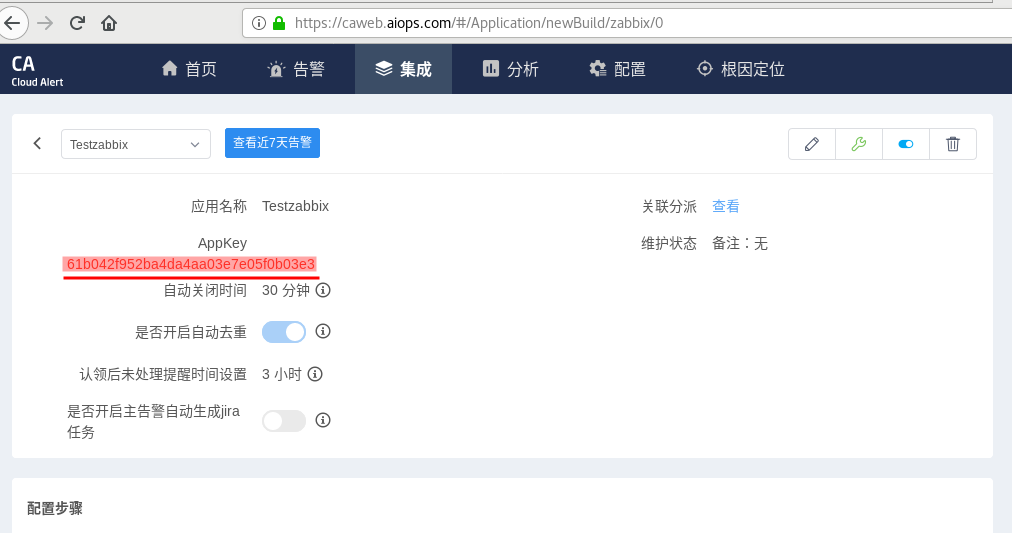
Next, start the configuration according to the prompt information;
Find the alarm path according to the main configuration file:
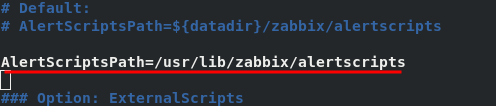
- to configure
Under this path, use the command wget https://download.aiops.com/ca_agent/zabbix/ca_zabbix_release-3.0.1.tar.gz Download the required probe;
[root@server1 zabbix]# cd /usr/lib/zabbix/alertscripts
[root@server1 alertscripts]# ls
[root@server1 alertscripts]# ls
ca_zabbix_release-3.0.1.tar.gz
[root@server1 alertscripts]# tar zxf ca_zabbix_release-3.0.1.tar.gz
[root@server1 alertscripts]# ls
ca_zabbix_release-3.0.1.tar.gz cloudalert
[root@server1 alertscripts]# cd cloudalert/
[root@server1 cloudalert]# ls
bin
[root@server1 cloudalert]# cd bin/
[root@server1 bin]# ls
alert.sh funcs install.sh uninstall.sh
#The following keys are generated keys. Make sure you can access the Internet here
[root@server1 bin]# ./install.sh 61b042f952ba4da4aa03e7e05f0b03e3
Please enter Zabbix Management address: http://172.25.25.1/zabbix
Check connection success!
Please enter Zabbix Administrator account: Admin
Please enter Zabbix Administrator password: % Total % Received % Xferd Average Speed Time Time Time Current
Dload Upload Total Spent Left Speed
100 170 100 70 100 100 1119 1599 --:--:-- --:--:-- --:--:-- 1612
Authentication success!
% Total % Received % Xferd Average Speed Time Time Time Current
Dload Upload Total Spent Left Speed
100 108 100 41 100 67 1003 1640 --:--:-- --:--:-- --:--:-- 1634
Check api version success!
% Total % Received % Xferd Average Speed Time Time Time Current
Dload Upload Total Spent Left Speed
100 313 100 56 100 257 992 4555 --:--:-- --:--:-- --:--:-- 4589
Create new media type success!
% Total % Received % Xferd Average Speed Time Time Time Current
Dload Upload Total Spent Left Speed
100 192 100 54 100 138 932 2383 --:--:-- --:--:-- --:--:-- 2421
Create new group success!
% Total % Received % Xferd Average Speed Time Time Time Current
Dload Upload Total Spent Left Speed
100 397 100 51 100 346 895 6078 --:--:-- --:--:-- --:--:-- 6178
Create new user success!
% Total % Received % Xferd Average Speed Time Time Time Current
Dload Upload Total Spent Left Speed
100 1572 100 51 100 1521 778 23214 --:--:-- --:--:-- --:--:-- 23400
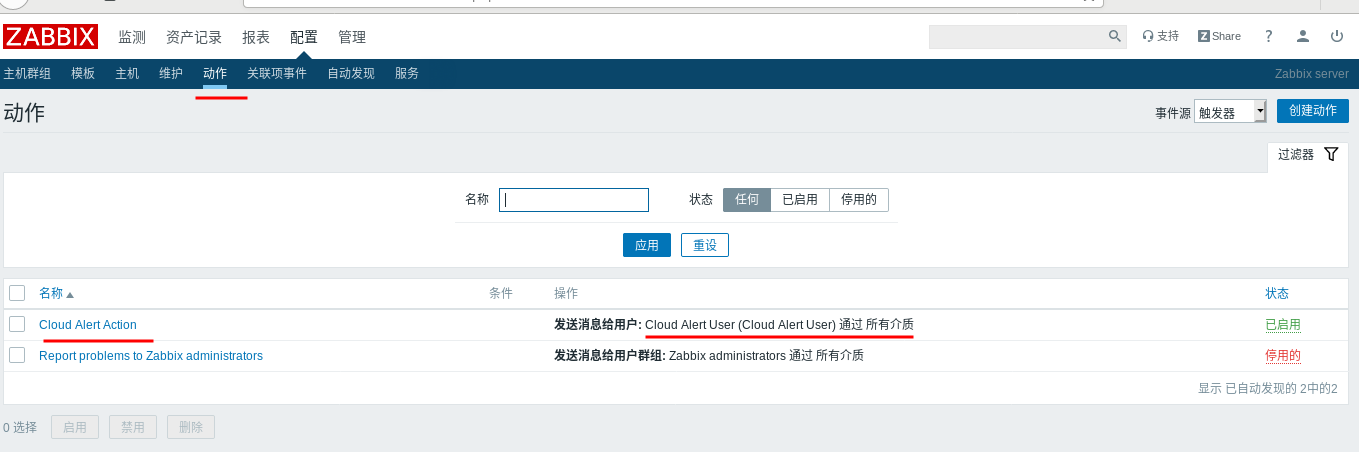
Create new action success!
Install zabbix agent success!
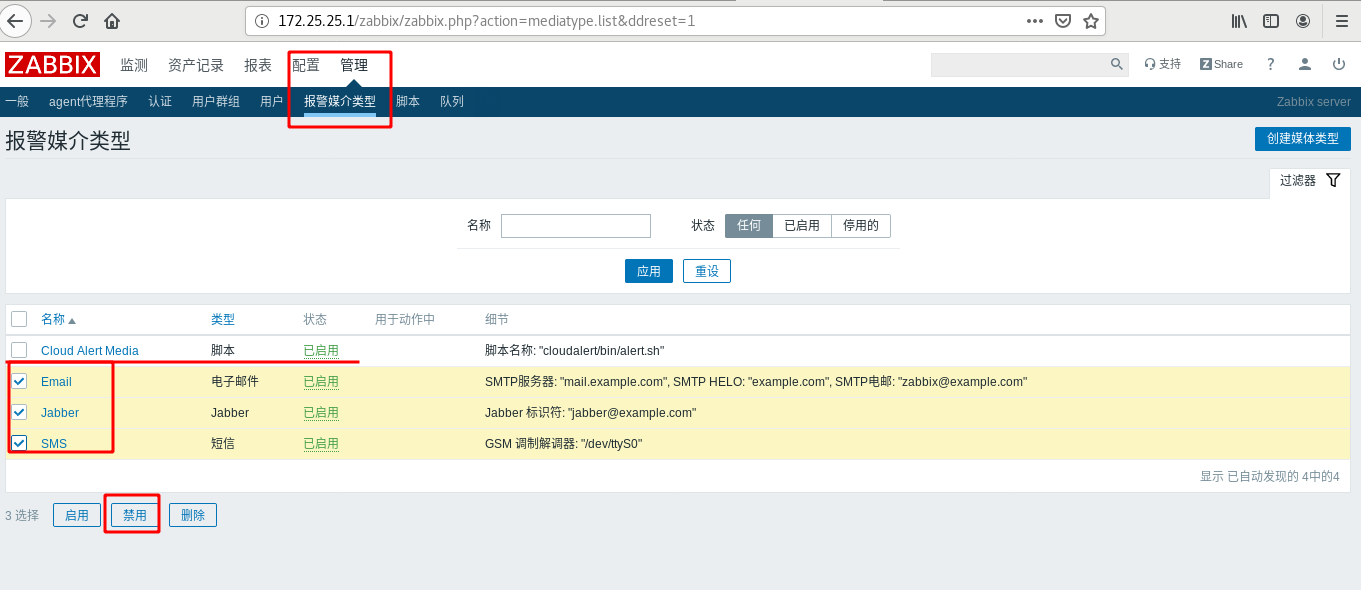
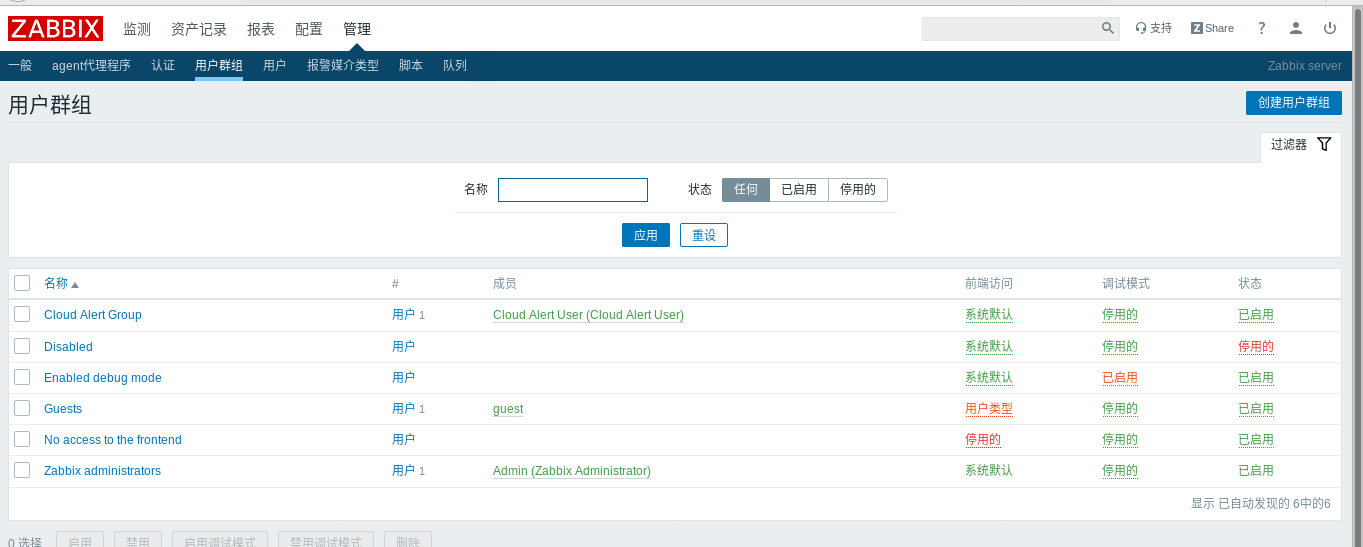
- Setting of alarm media:
Disable the other three built-in on this page to ensure the success of the current media test;
Alarm user:
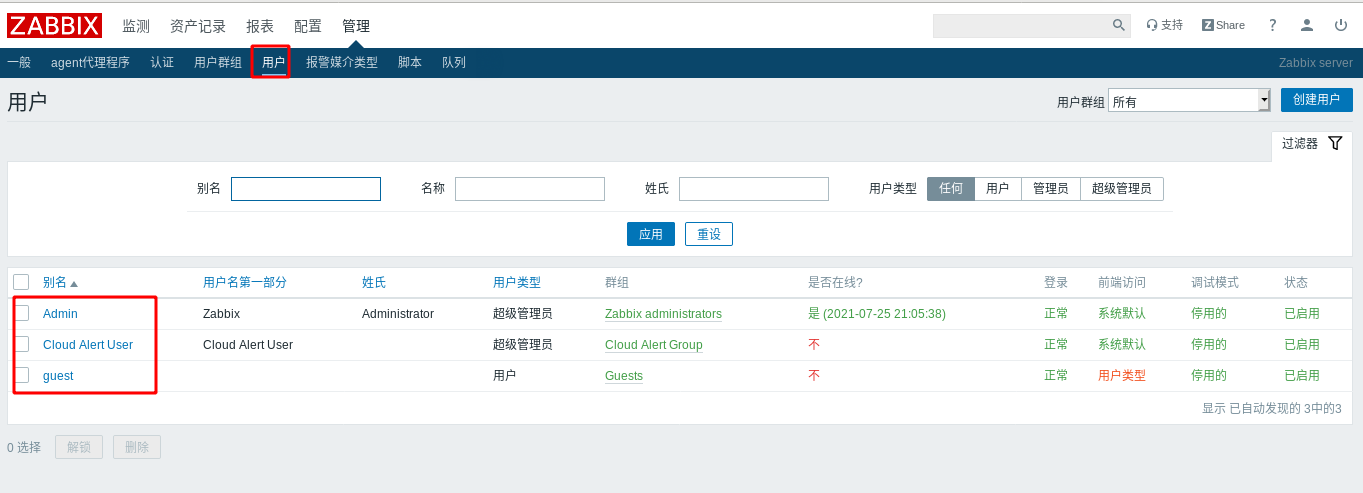
The default is through all media, so other media will be disabled before;
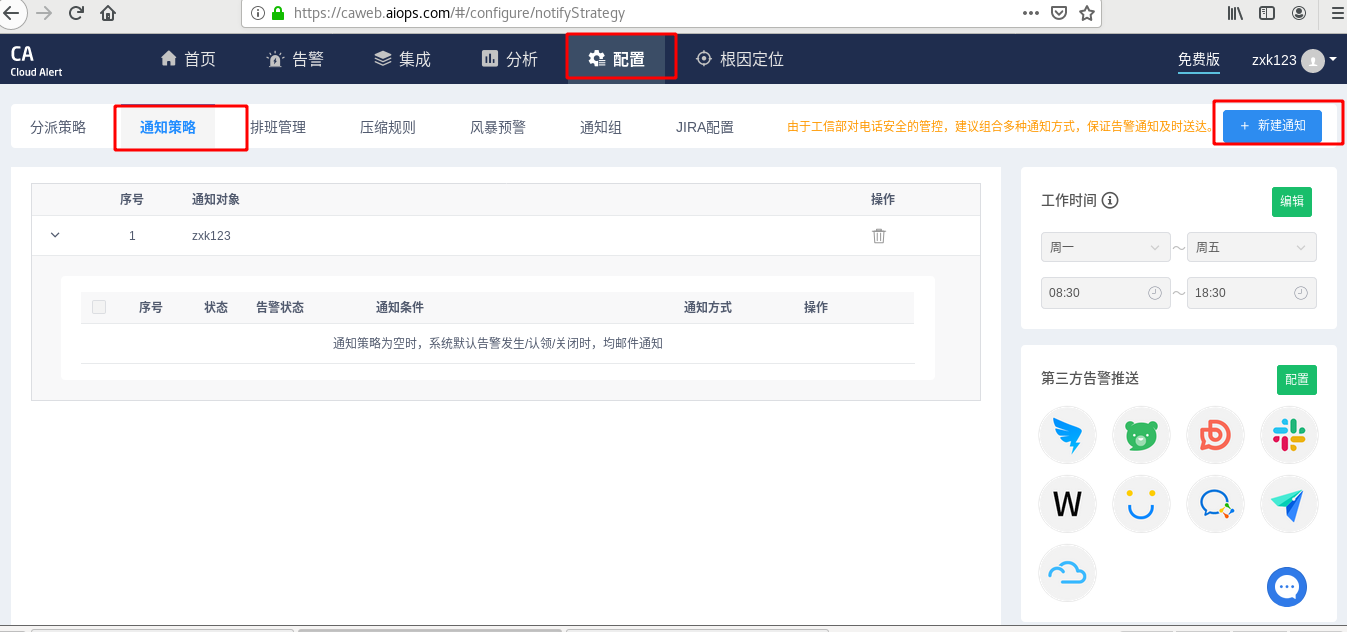
- Notification policy settings
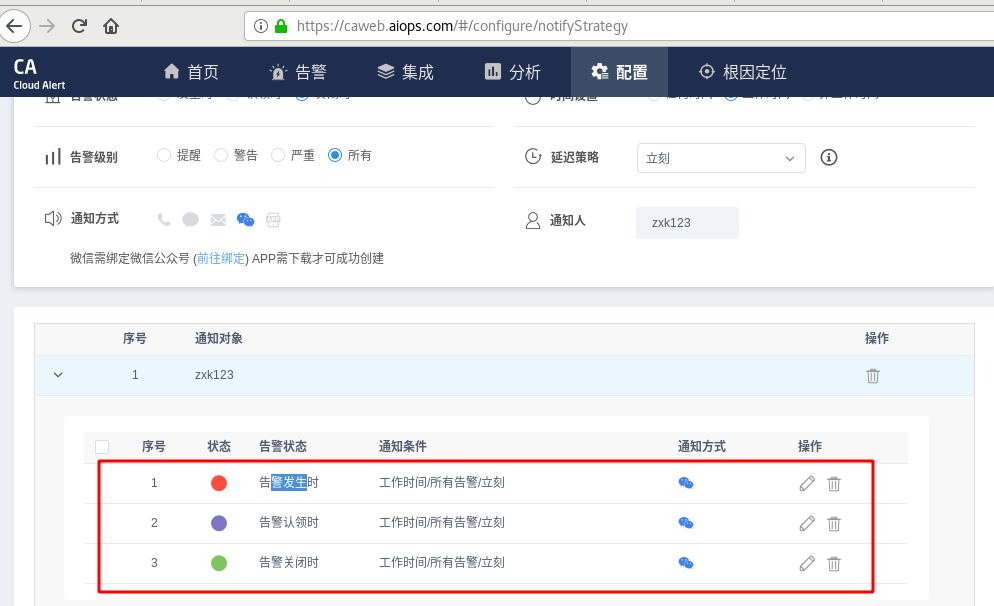
- Simulation error
systemctl stp zabbix-agent
After the waiting time arrives, the message will be sent, but it has not been processed;
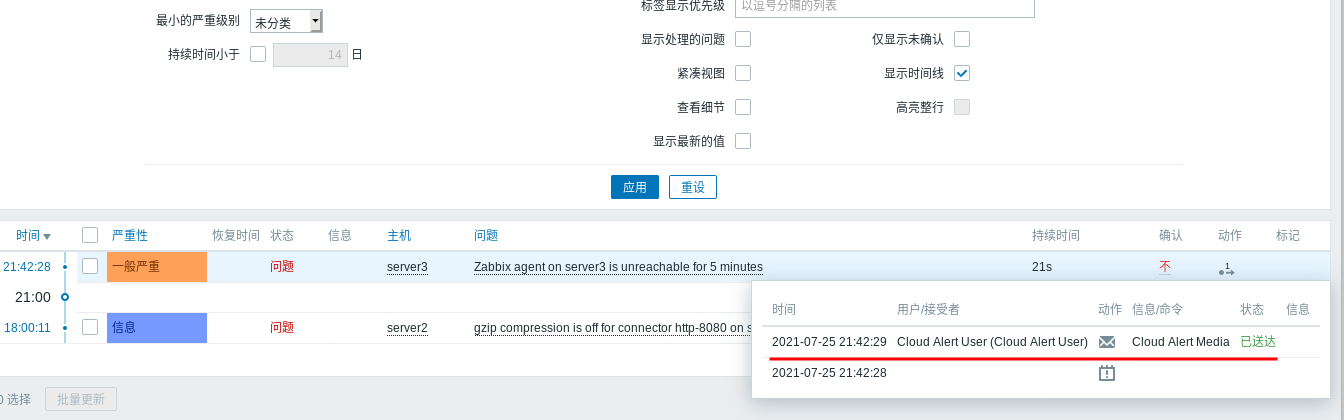
The alarm information can be seen on the alarm platform and the receiving end. If combined with the app, it can also be claimed and solved on the app end;
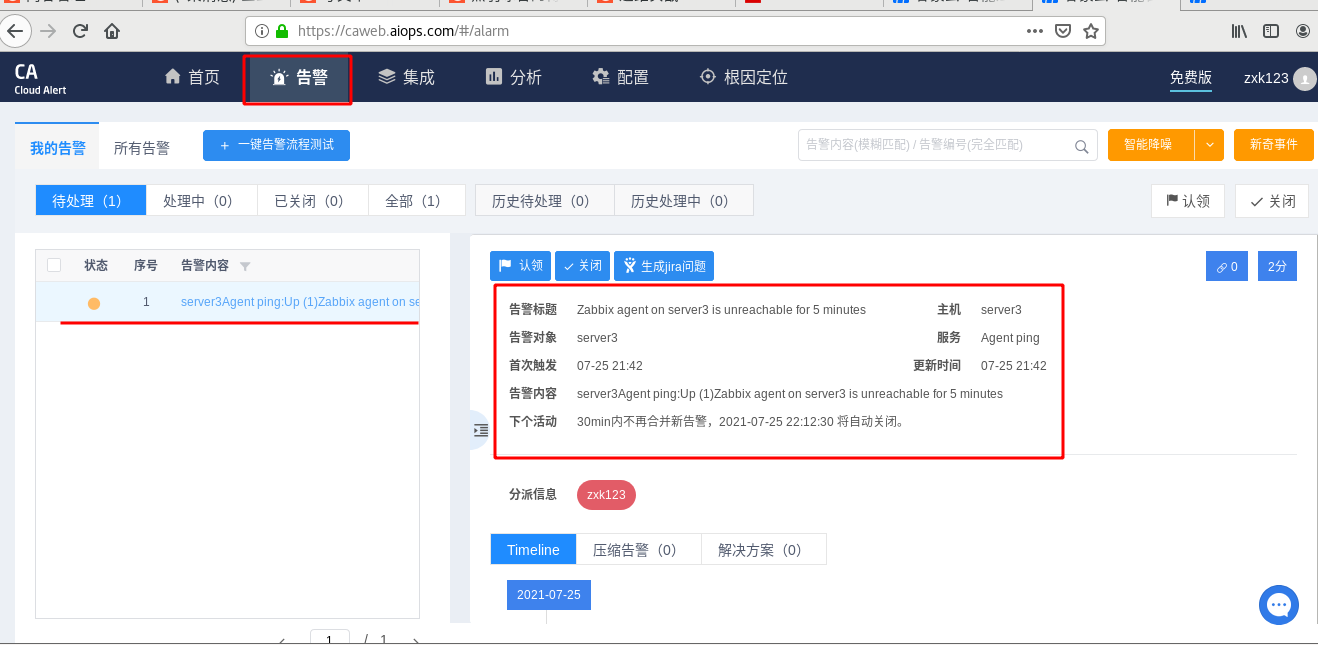
Problem solving: systemctl start ZABBIX agent
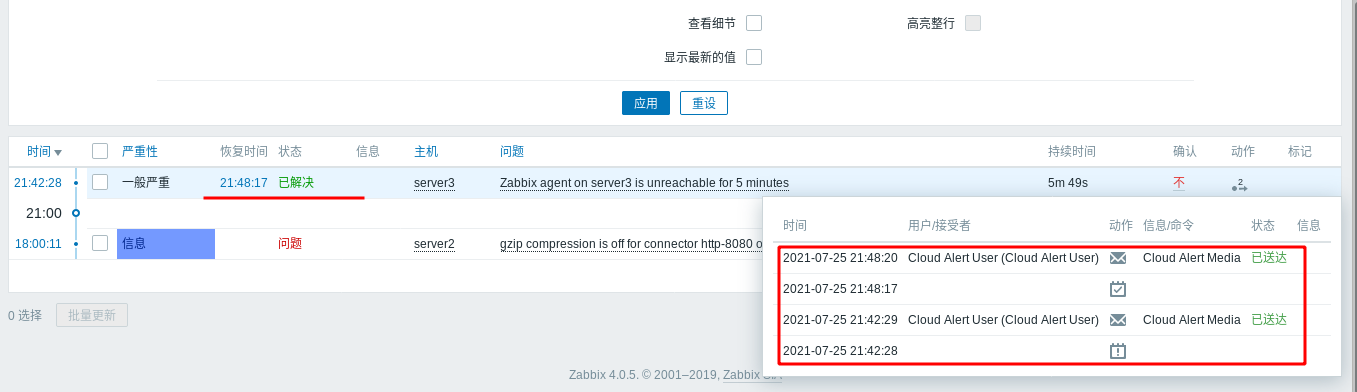
You can also see who claimed it, who solved it, and how the problem was solved.
2. Agent active mode
By default, the Server side periodically connects to the monitoring information that the Agent side mobile phone wants.
It is not difficult to imagine that when the number of Agent ends increases, the pressure on the Server end also increases.
If the order of magnitude is huge, it will also become a hot spot of business; It's great that the Agent can actively submit information to the Server.
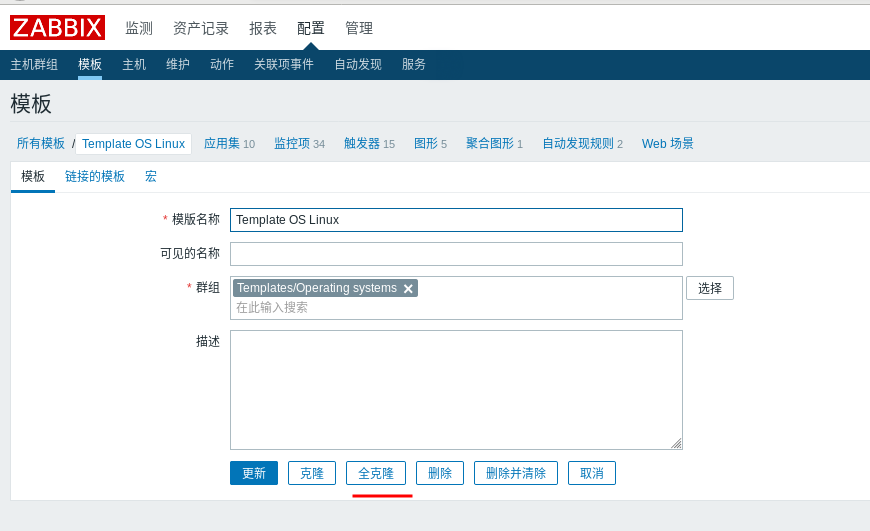
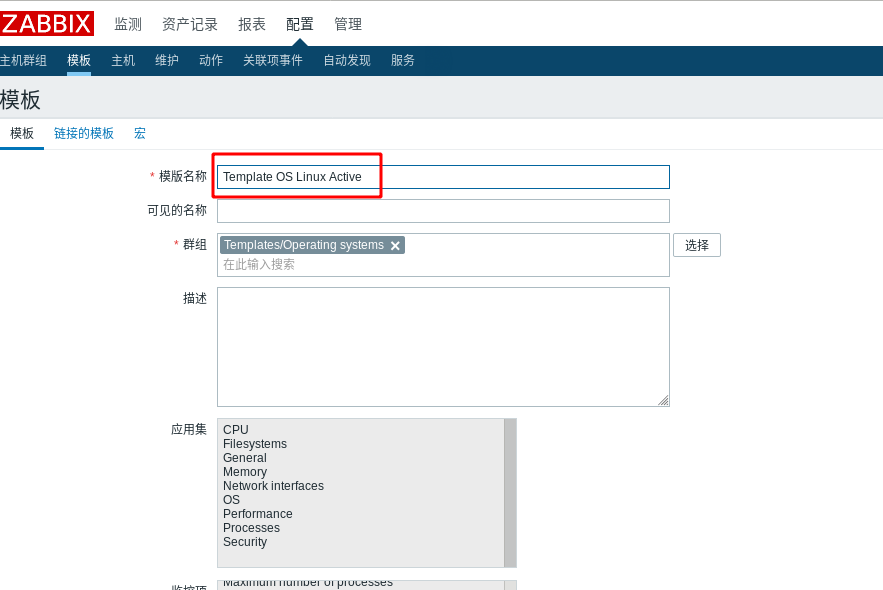
Click the template to fully clone it, and rename the new template to Active template:
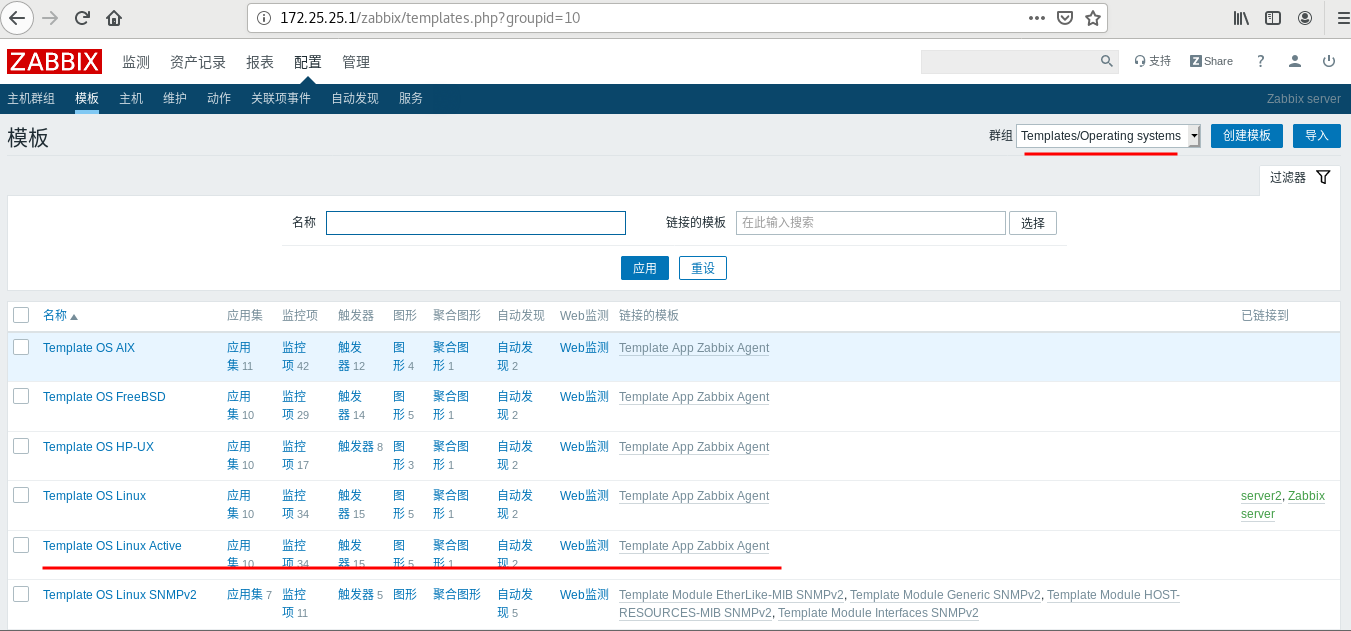
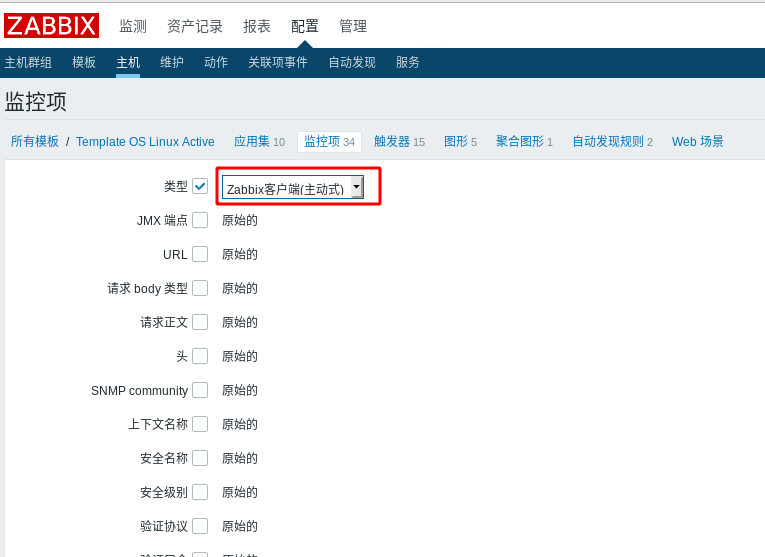
At this time, Cologne has completed, and then click batch update after modifying the monitoring items: select all;
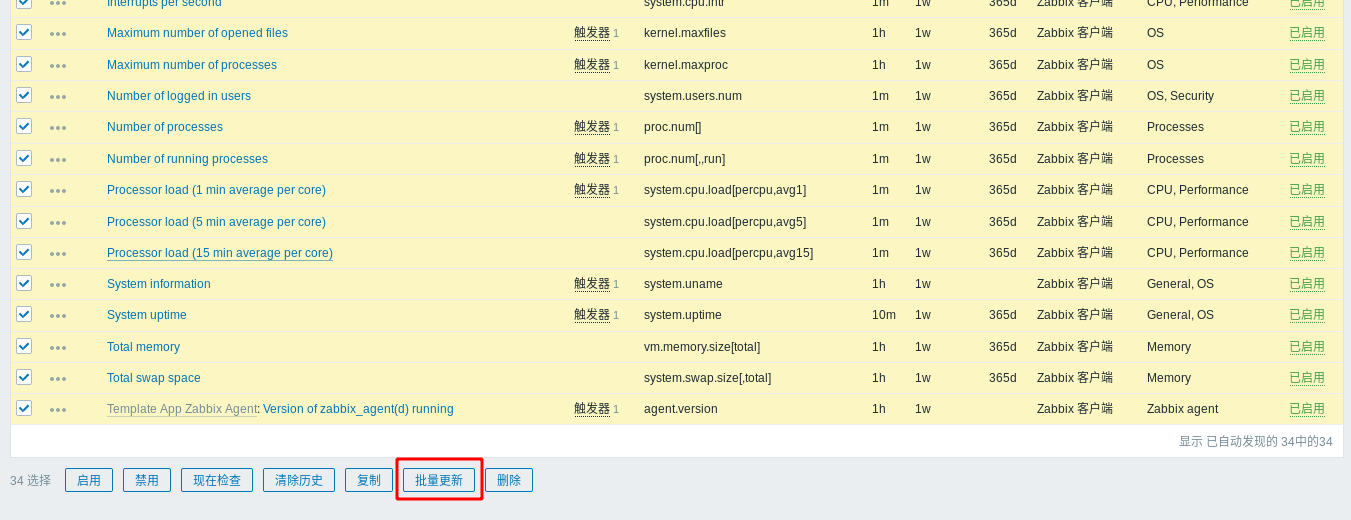
Change the mode, and then click Update. At this time, the batch update is completed:
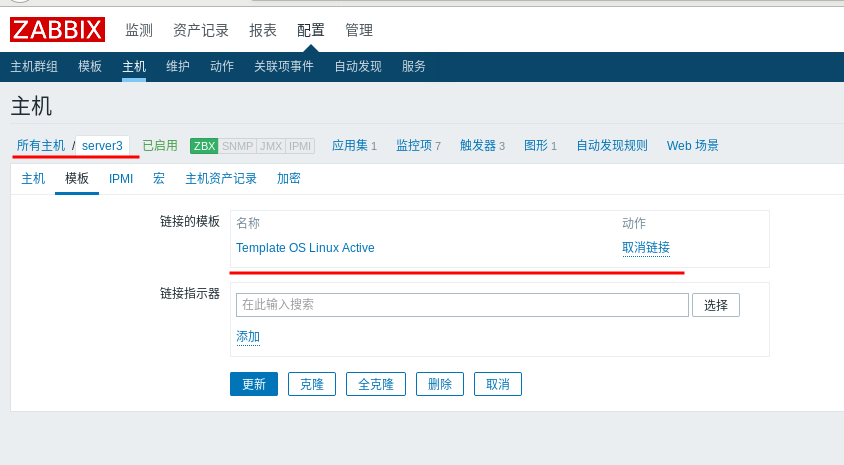
Then change the template on server3 to the new clone changed template, and it will be sent actively at this time;
New data can be seen after waiting for a certain time:
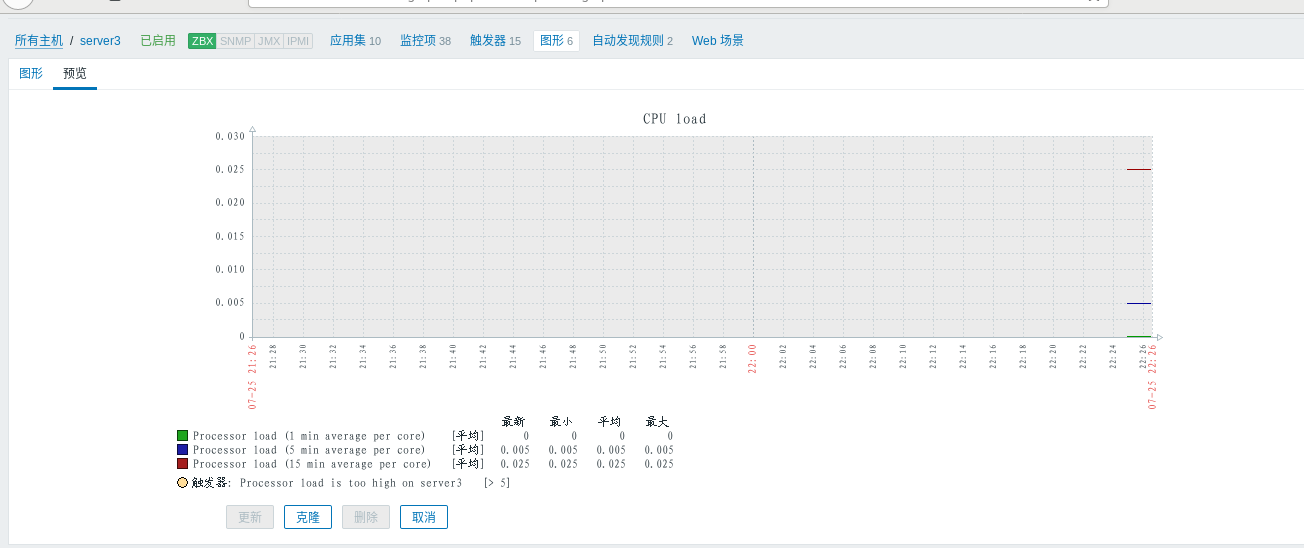
The above is the result of the agent actively sending data to the server, which can reduce the load on the server; When this is possible, there is no need to add distributed consumption resources.
If you can't meet your needs, consider distributed.
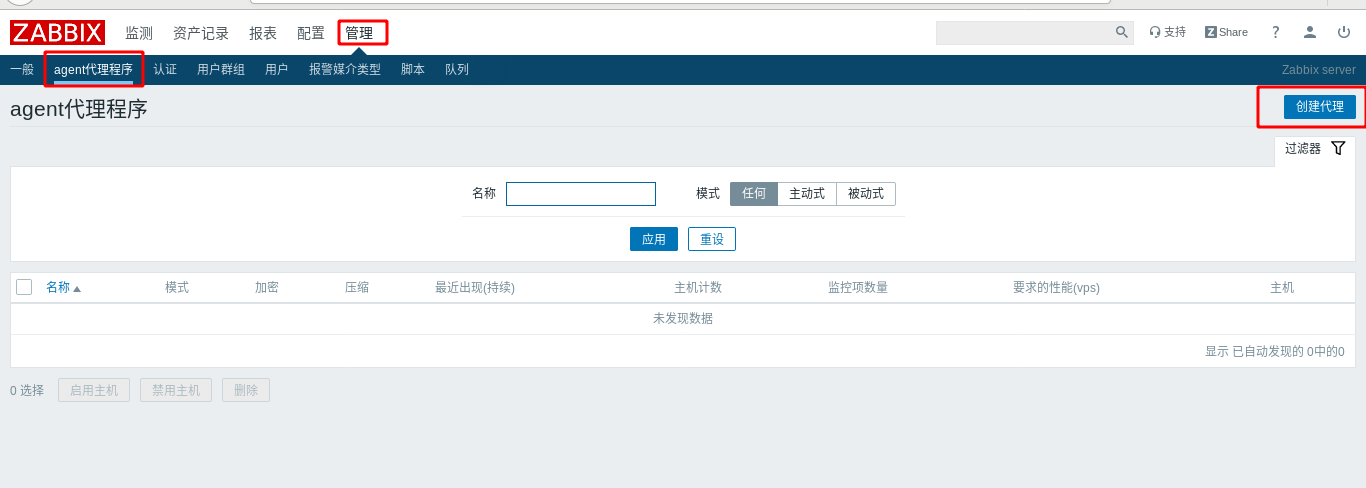
3. proxy distributed
zabbix proxy can collect performance and availability data instead of zabbix server, and then report the data to zabbix server, and share the pressure of zabbix server to a certain extent.
In addition, when all agents and proxies are reported to a Zabbix server and all data are collected centrally, using proxy is the simplest way to realize centralized and distributed monitoring.
Usage scenario of zabbix proxy:
Monitoring remote area equipment
 Monitor unstable area of local network
 When zabbix When monitoring thousands of equipment,Use it to reduce server Pressure of
 Simplify maintenance of distributed monitoring
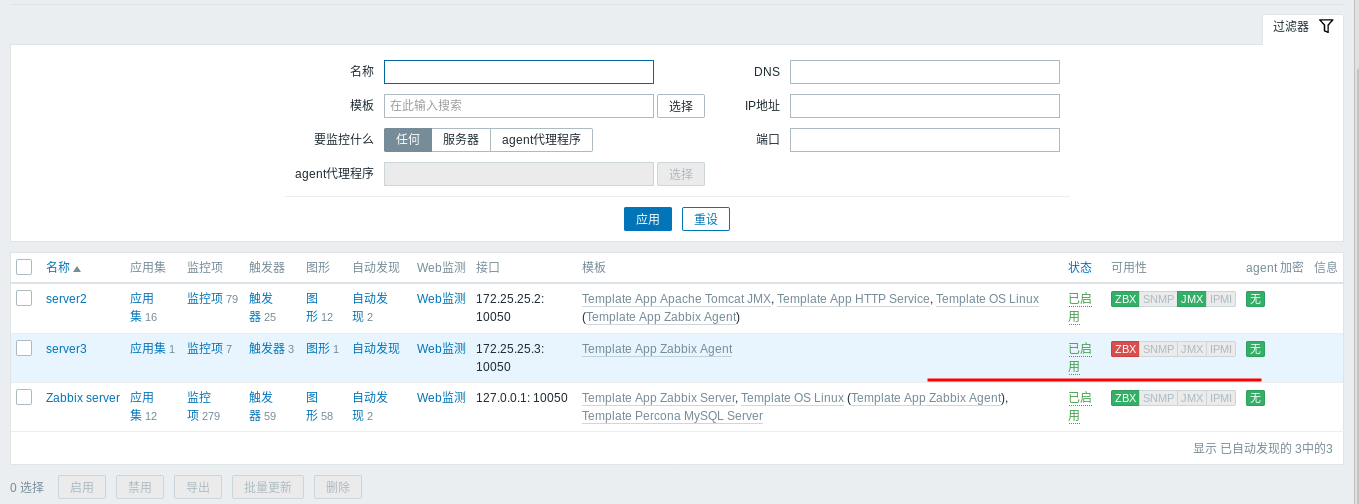
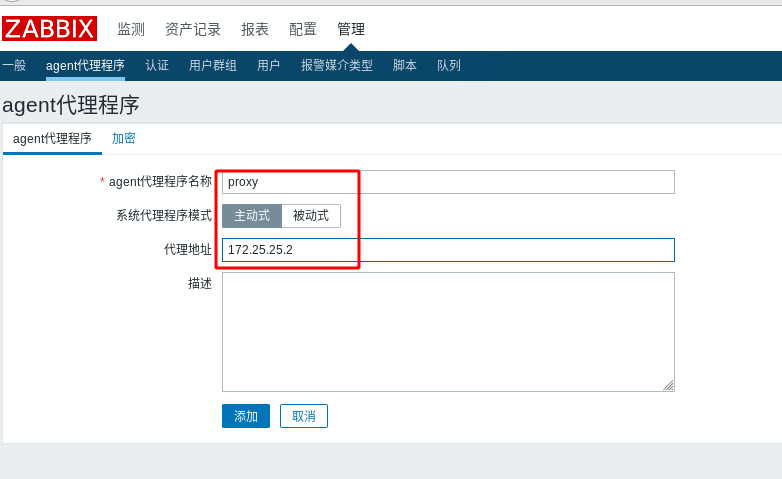
Here you can open another host as an agent; Select server2 as the proxy here.
First delete the server2 host on the monitoring page, then stop the unnecessary services, install the required software packages, and modify the configuration file;
- Stop unnecessary services
[root@server2 bin]# ./shutdown.sh
Using CATALINA_BASE:   /usr/local/tomcat
Using CATALINA_HOME:   /usr/local/tomcat
Using CATALINA_TMPDIR: /usr/local/tomcat/temp
Using JRE_HOME:        /usr
Using CLASSPATH:       /usr/local/tomcat/bin/bootstrap.jar:/usr/local/tomcat/bin/tomcat-juli.jar
[root@server2 bin]# systemctl stop httpd
[root@server2 bin]# systemctl disable --now zabbix-agent
- Install and configure proxy
Since the open port of this proxy is also 10051, the agent must be stopped; The information of the database in the proxy should correspond to the newly created database;
[root@server2 ~]# yum install -y zabbix-proxy
[root@server2 ~]# cd /etc/zabbix/
[root@server2 zabbix]# vim zabbix_proxy.conf

 30 Server=172.25.25.1
 49 Hostname=proxy
 196 DBPassword=westos
#Database password
[root@server2 zabbix]# hostnamectl set-hostname proxy
[root@server2 zabbix]# vim /etc/hosts	#Add resolution to all nodes
[root@proxy zabbix]# yum install -y mariadb-server
[root@proxy zabbix]# systemctl start mariadb.service
[root@proxy zabbix]# mysql
MariaDB [(none)]> create database zabbix_proxy character set utf8 collate utf8_bin;
MariaDB [(none)]> create user 'zabbix'@'localhost' identified by 'westos';
MariaDB [(none)]> grant all privileges on zabbix_proxy.* to 'zabbix'@'localhost';

#Login database test
[root@proxy zabbix]# mysql -u zabbix -p zabbix_proxy
Enter password:
MariaDB [zabbix_proxy]>

[root@proxy zabbix-proxy-mysql-4.0.5]# pwd
/usr/share/doc/zabbix-proxy-mysql-4.0.5
[root@proxy zabbix-proxy-mysql-4.0.5]# ls
AUTHORS  ChangeLog  COPYING  NEWS  README  schema.sql.gz
[root@proxy zabbix-proxy-mysql-4.0.5]# zcat schema.sql.gz | wc -l
1967
[root@proxy zabbix-proxy-mysql-4.0.5]# zcat schema.sql.gz | mysql -uzabbix -pwestos zabbix_proxy
[root@proxy zabbix-proxy-mysql-4.0.5]# systemctl enable --now zabbix-proxy
Created symlink from /etc/systemd/system/multi-user.target.wants/zabbix-proxy.service to /usr/lib/systemd/system/zabbix-proxy.service.
[root@proxy zabbix-proxy-mysql-4.0.5]# netstat -antlp | grep :10051
tcp        0      0 0.0.0.0:10051           0.0.0.0:*               LISTEN      24455/zabbix_proxy
tcp6       0      0 :::10051                :::*                    LISTEN      24455/zabbix_proxy
[root@proxy ~]# cat /var/log/zabbix/zabbix_proxy.log
 24461:20210726:085331.141 cannot send heartbeat message to server at "172.25.25.1": proxy "proxy" not found
 24462:20210726:085331.536 cannot send proxy data to server at "172.25.25.1": proxy "proxy" not found
 24462:20210726:085332.537 cannot send proxy data to server at "172.25.25.1": proxy "proxy" not found
 24462:20210726:085333.539 cannot send proxy data to server at "172.25.25.1": proxy "proxy" not found
 24462:20210726:085334.541 cannot send proxy data to server at "172.25.25.1": proxy "proxy" not found
 24462:20210726:085335.542 cannot send proxy data to server at "172.25.25.1": proxy "proxy" not found
 24462:20210726:085336.544 cannot send proxy data to server at "172.25.25.1": proxy "proxy" not found
 24462:20210726:085337.545 cannot send proxy data to server at "172.25.25.1": proxy "proxy" not found
 24462:20210726:085338.547 cannot send proxy data to server at "172.25.25.1": proxy "proxy" not found
 24462:20210726:085339.548 cannot send proxy data to server at "172.25.25.1": proxy "proxy" not found
 24462:20210726:085340.550 cannot send proxy data to server at "172.25.25.1": proxy "proxy" not found
 24462:20210726:085341.552 cannot send proxy data to server at "172.25.25.1": proxy "proxy" not found
 24462:20210726:085342.554 cannot send proxy data to server at "172.25.25.1": proxy "proxy" not found
 24462:20210726:085343.555 cannot send proxy data to server at "172.25.25.1": proxy "proxy" not found
At this time, you can see from the log that you can't connect to the server. At this time, you need to set the agent:
After that, restart ZABBIX proxy again and view the log again;
[root@proxy ~]# systemctl restart zabbix-proxy.service
[root@proxy ~]# cat /var/log/zabbix/zabbix_proxy.log

 24455:20210726:090009.604 Zabbix Proxy stopped. Zabbix 4.0.5 (revision 90164).
 24601:20210726:090009.644 Starting Zabbix Proxy (active) [proxy]. Zabbix 4.0.5 (revision 90164).
 24601:20210726:090009.644 **** Enabled features ****
 24601:20210726:090009.644 SNMP monitoring:       YES
 24601:20210726:090009.644 IPMI monitoring:       YES
 24601:20210726:090009.644 Web monitoring:        YES
 24601:20210726:090009.644 VMware monitoring:     YES
 24601:20210726:090009.644 ODBC:                  YES
 24601:20210726:090009.644 SSH2 support:          YES
 24601:20210726:090009.644 IPv6 support:          YES
 24601:20210726:090009.644 TLS support:           YES
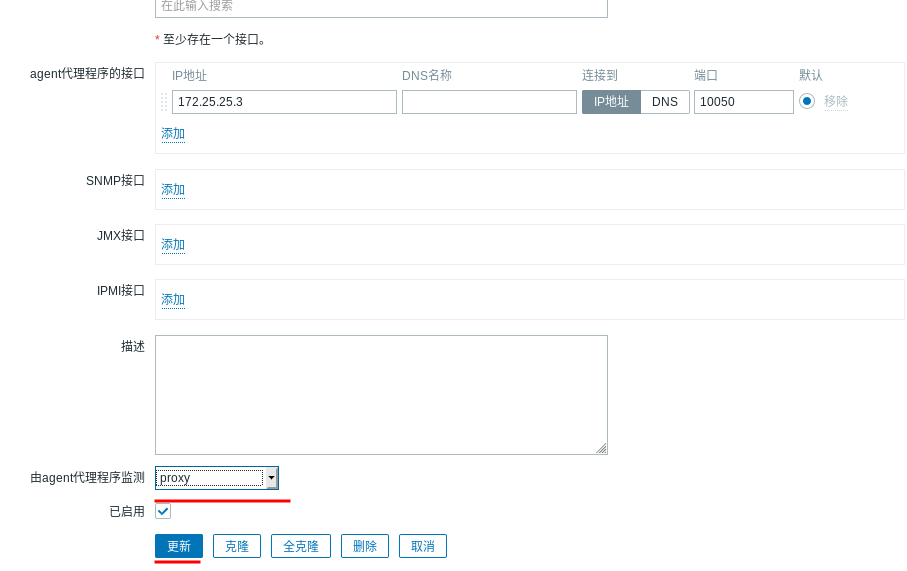
At this time, you need to change the direction of the agent. You should point it to the proxy instead of directly pointing to the server; At this time, the access process is server < - proxy - > agent;
[root@server3 zabbix]# vim zabbix_agentd.conf

 98 Server=172.25.25.2
139 ServerActive=172.25.25.2
[root@server3 zabbix]# systemctl restart zabbix-agent
[root@server3 zabbix]# cat /var/log/zabbix/zabbix_agentd.log
At this time, when viewing the log, you will be prompted that the server (172.25.25.2) is not found and the agent needs to be configured;
You need to restart the proxy on the server side (172.25.25.2), and then restart the agent again to observe the effect;
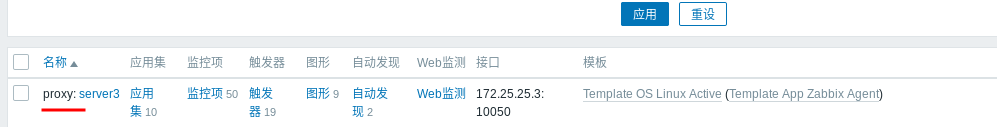
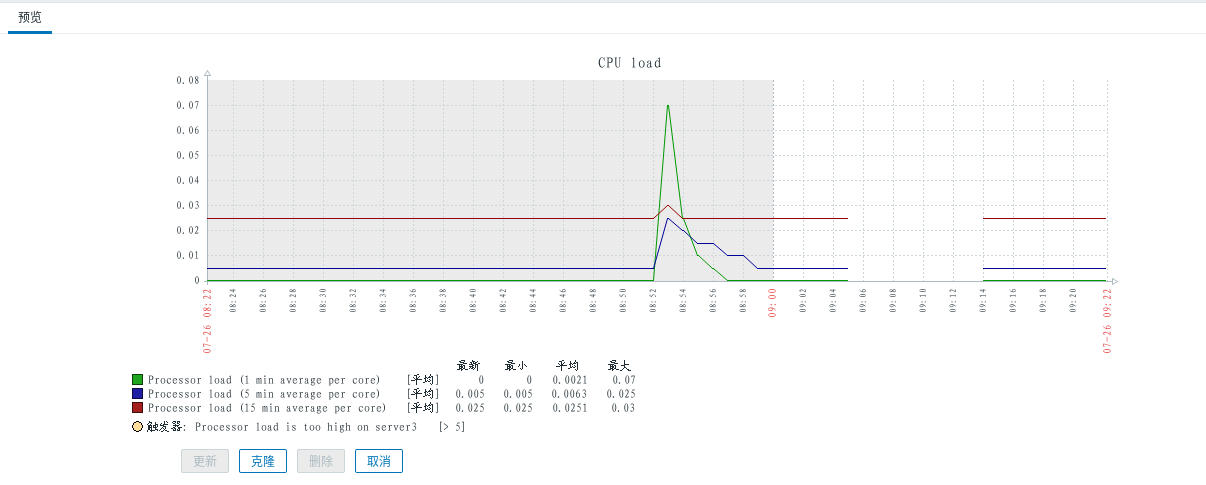
[root@proxy ~]# systemctl restart zabbix-proxy.service
[root@server3 zabbix]# systemctl restart zabbix-agent
[root@server3 zabbix]# cat /var/log/zabbix/zabbix_agentd.log
 23967:20210726:091404.964 Starting Zabbix Agent [server3]. Zabbix 4.0.5 (revision 90164).
 23967:20210726:091404.964 **** Enabled features ****
 23967:20210726:091404.964 IPv6 support:          YES
 23967:20210726:091404.964 TLS support:           YES
 23967:20210726:091404.964 **************************
 23967:20210726:091404.964 using configuration file: /etc/zabbix/zabbix_agentd.conf
 23967:20210726:091404.965 agent #0 started [main process]
 23968:20210726:091404.967 agent #1 started [collector]
 23970:20210726:091404.967 agent #3 started [listener #2]
 23969:20210726:091404.968 agent #2 started [listener #1]
 23971:20210726:091404.970 agent #4 started [listener #3]
 23972:20210726:091404.971 agent #5 started [active checks #1]
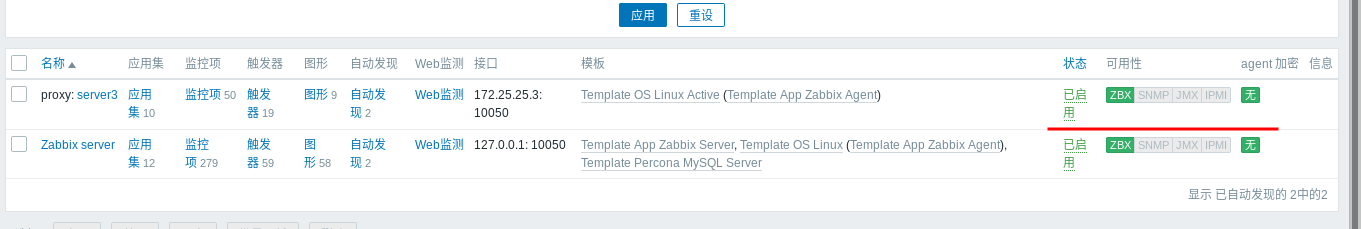
You can see that there will be an intermittent time when converting to proxy, but it will continue to be started automatically;
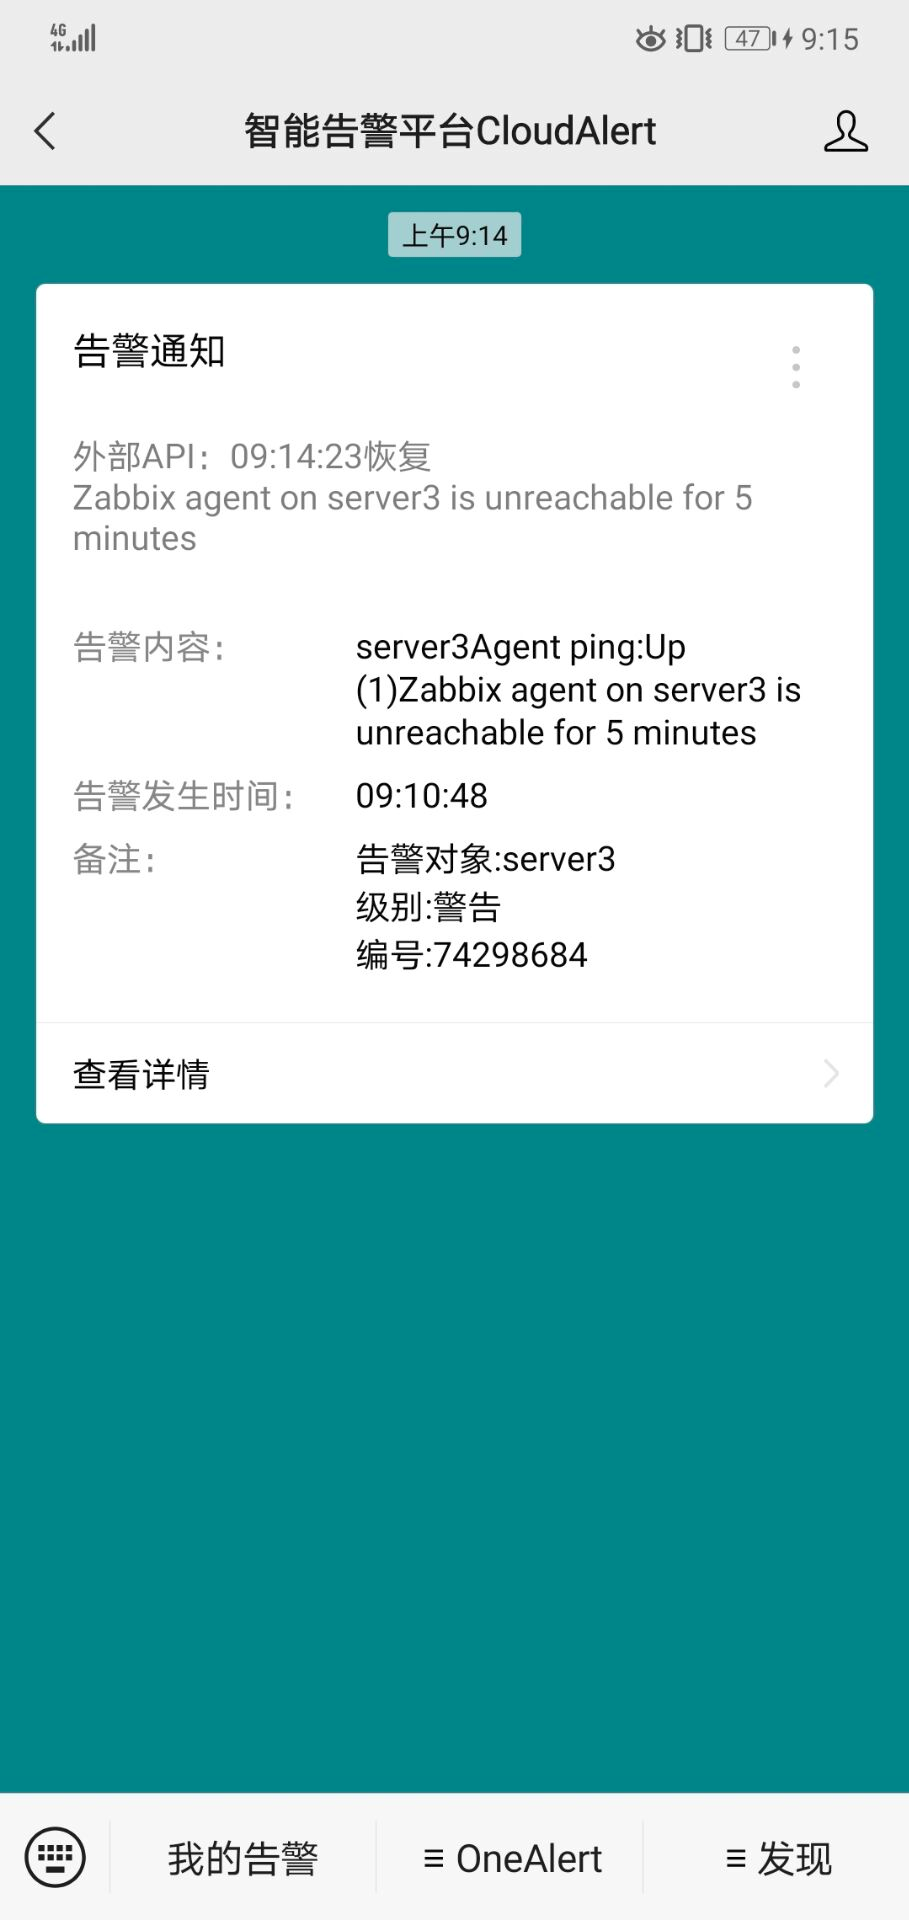
This process also received alarm information:

As before, when monitoring java, you can also set the gateway and process:
[root@proxy zabbix]# vim zabbix_proxy.conf

330 JavaGateway=172.25.25.1
345 StartJavaPollers=5
[root@proxy zabbix]# systemctl restart zabbix-proxy.service