I First look at the effect:
Hello, everyone, ⭐⭐⭐⭐⭐, Adhering to the principle of sharing happiness, I'm here again~
Ecarts is to copy and paste on the official website. Why package?
1. Reduce the amount of code. As long as the width, height and option configuration items are transmitted each time, the chart can be generated quickly.
2. The original ecarts can not adapt to the change of screen size.
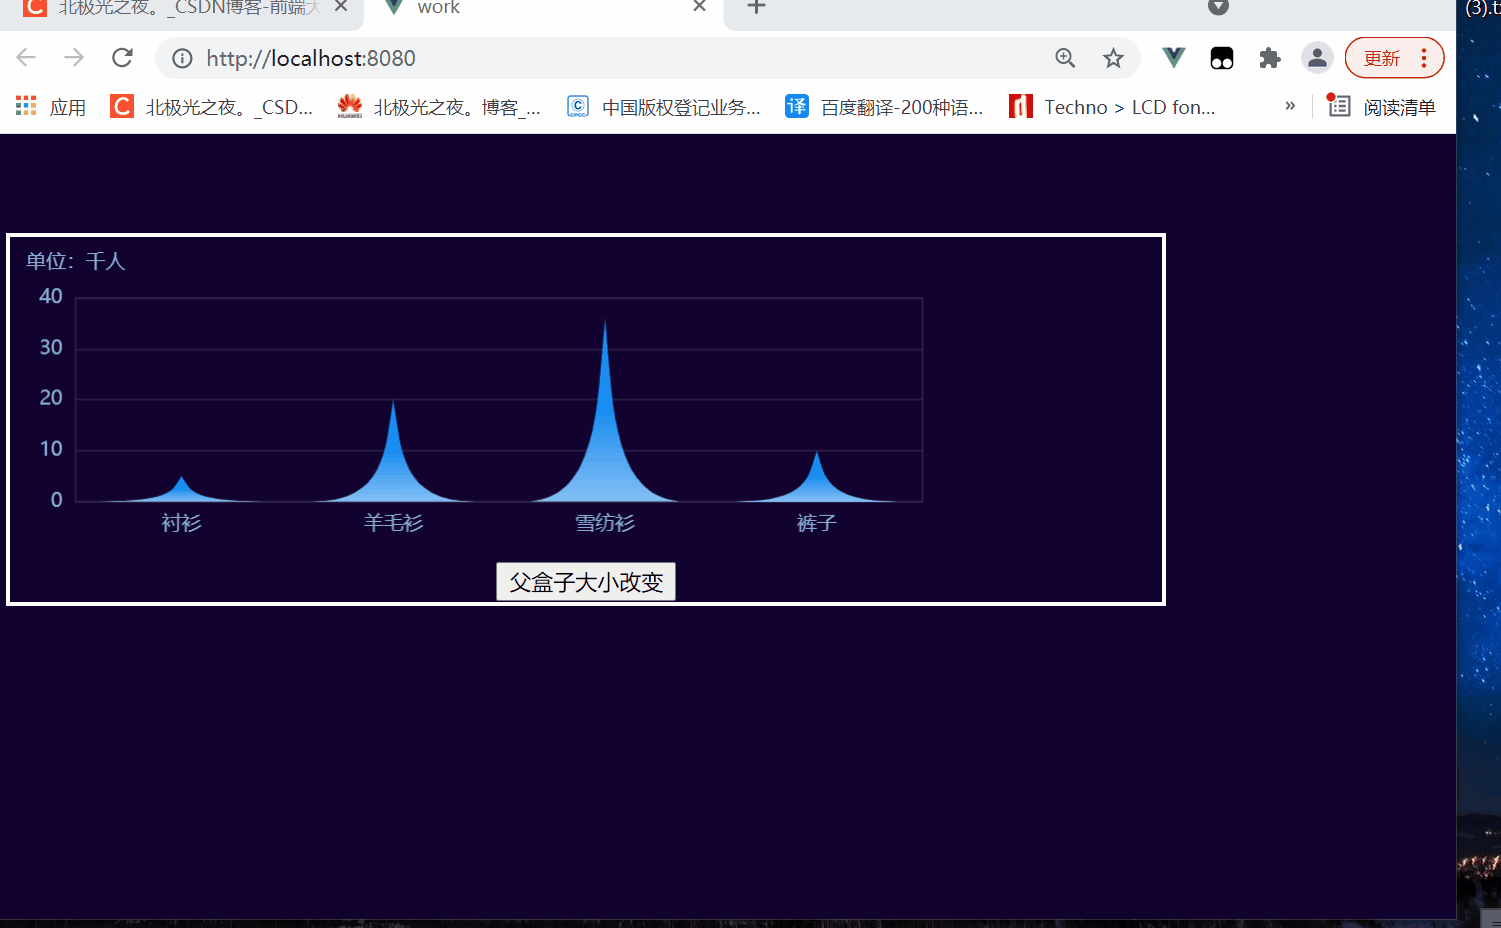
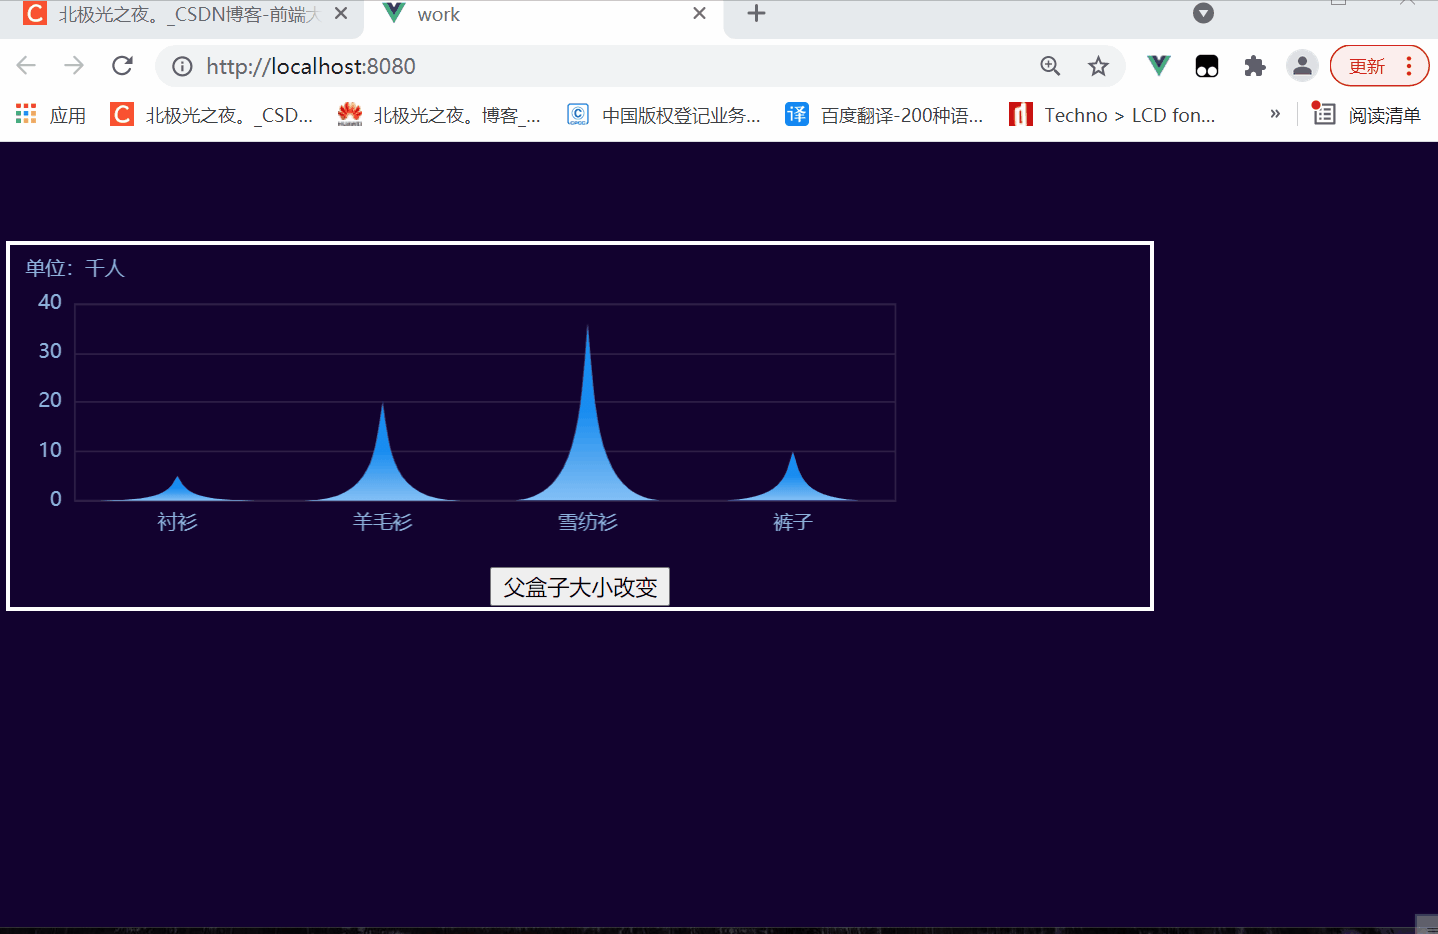
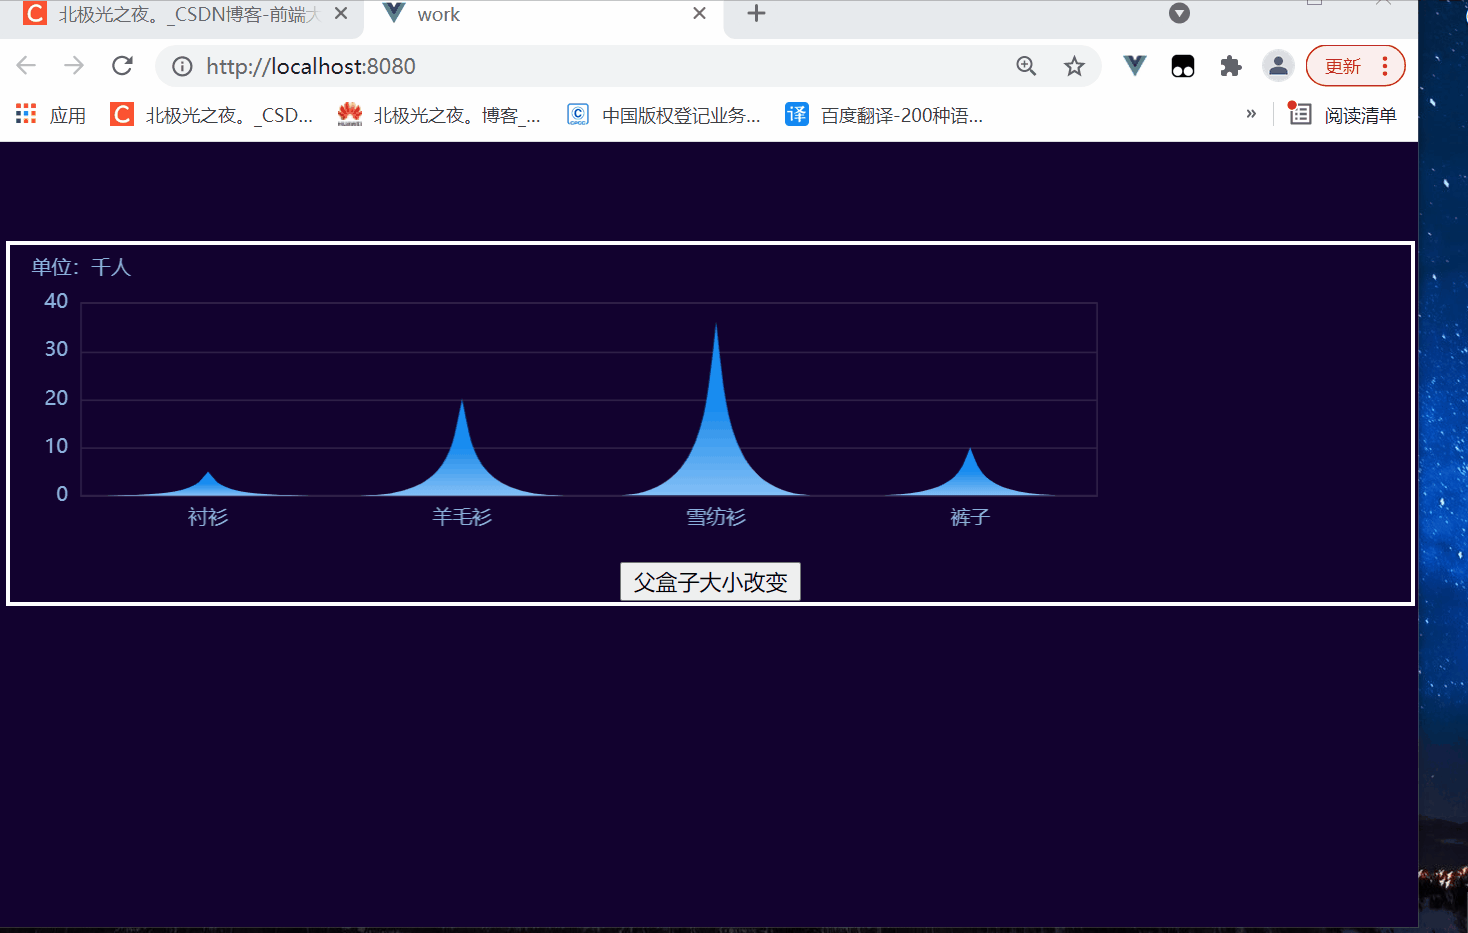
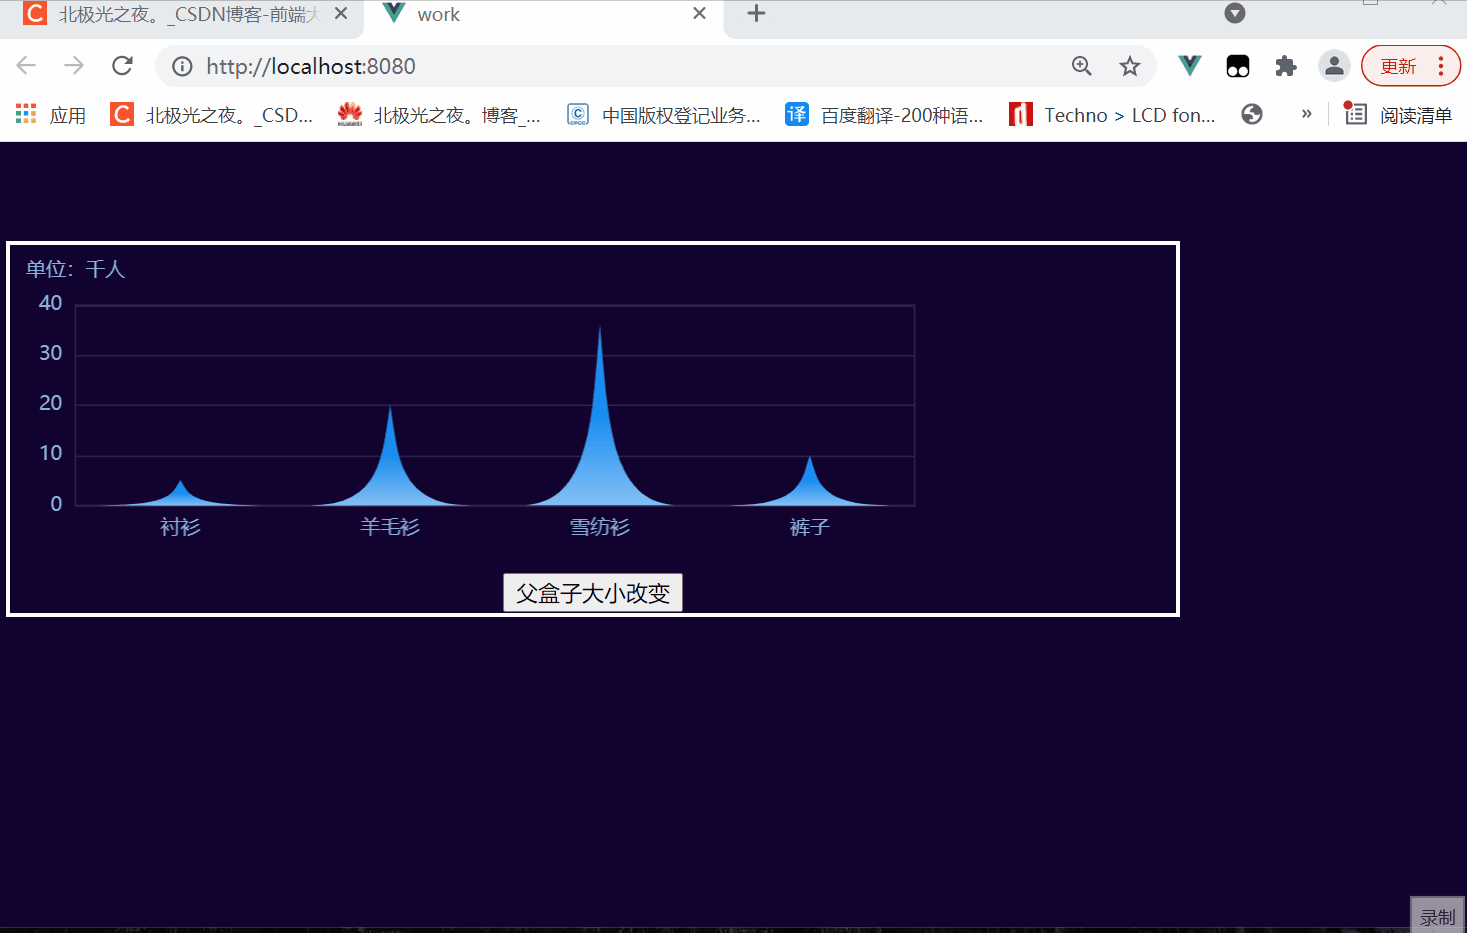
3. The original ecarts cannot adapt to the size change of the parent box.
There is a problem with the original adaptation (RE):
1. When the screen changes, the chart will not be dynamically changed and rendered again:
2. When the size of the parent box of the chart label changes, the chart will not be dynamically changed and rendered again:
3. When the screen changes, the chart will not be dynamically changed and rendered again (after solution):

4. When the size of the parent box of the chart label changes, the chart will not be dynamically changed and rendered again (after solution):

II Detailed implementation:
1. Value to be transmitted by the component:
First analyze the requirements. For example, the component name is my charts. Generally, it can be passed to three: width, height and option, such as:
  <my-echarts
        :width="'80%'"
        :height="'20vw'"
        :option="option1"
  ></my-echarts>
2. Implementation component code:
In a vue scaffold project, you can create a new myeckarts. Net in the components directory vue file. See notes for specific function code:
<template>
  <!-- Define label -->
  <div
    :id="id"
    :style="{
      width: width,
      height: height,
    }"
  ></div>
</template>

<script>
import * as echarts from "echarts";
// 2. Generate an id value for the tag to prevent id duplication when the component is used multiple times
const uid = function () {
  return new Date().getTime();
};
export default {
  //1. Get the passed value
  props: {
    width: {
      typeof: String,
    },
    height: {
      typeof: String,
    },
    option: {
      typeof: Object,
      default() {
        return null;
      },
    },
  },
  data() {
    return {
      //3. Define id and myChart chart instances here to facilitate management
      id: null,
      myChart: null,
    };
  },
  created() {
    // 4.id assignment
    this.id = uid();
  },
  mounted() {
    //   5. Create an instance of the charts
    this.myChart = echarts.init(document.getElementById(this.id));
    // Specify configuration items and data for the chart
    var option = this.option;
    // Display the chart using the configuration item and data you just specified.
    this.myChart.setOption(option);
  },
};
</script>
3. Basic use:
At this point, you can use my charts components in other places, such as my app Vue uses this component:
Import:
import MyEcharts from "./components/MyEcharts.vue";
Registration:
 components: {
    MyEcharts,
  },
Define the option data (you can copy one on the official website of echarts):
data() {
    return {
      //Triangular histogram
      option1: {
        tooltip: {
          trigger: "axis",
          formatter: `{b}<br/>
                {a}:  {c} Thousand people`,
        },
        //Inside margin of chart
        grid: {
          left: "3%",
          top: "20%",
          right: "3%",
          bottom: "1%",
          show: true,
          borderColor: "rgb(47,32,71)",
          containLabel: true,
        },
        xAxis: {
          data: ["shirt", "cardigan", "Chiffon shirt", "trousers"],
          type: "category",
          axisLabel: {
            show: true,
            color: "rgb(142,175,220)",
          },
          axisTick: {
            //Do not display tick marks
            show: false,
          },
          axisLine: {
            show: true,
            lineStyle: {
              width: 1,
              color: "rgba(47,32,71)",
            },
          },
          // Area division line
          splitLine: {
            show: false,
            lineStyle: {
              color: "rgba(204, 204, 204,0.3)",
            },
          },
        },
        yAxis: {
          name: "Unit: 1000 persons",
          nameTextStyle: {
            color: "rgb(142,175,220)",
          },
          // Area division line
          splitLine: {
            lineStyle: {
              color: "rgba(47,32,71)",
            },
          },
          axisTick: {
            show: false,
          },
          axisLabel: {
            show: true,
            color: "rgb(142,175,220)",
          },
          axisLine: {
            lineStyle: {
              show: true, //Whether to display the axis,
              color: "white", //Color of y axis
              width: 0.5, //x-axis thickness
            },
          },
        },
        series: [
          {
            name: "sales volume",
            //Triangular histogram
            type: "pictorialBar",
            barCategoryGap: "30",
            symbol:
              "path://M0,10 L10,10 C5.5,10 5.5,5 5,0 C4.5,5 4.5,10 0,10 z",
            //Gradient
            itemStyle: {
              color: new echarts.graphic.LinearGradient(0, 0, 0, 1, [
                { offset: 0, color: "#188df0" },
                { offset: 0.5, color: "#188df0" },
                { offset: 1, color: "#83bff6" },
              ]),
            },
            data: [5, 20, 36, 10],
          },
        ],
      },
    };
  },
Define label:
      <my-echarts
        :width="'80%'"
        :height="'20vw'"
        :option="option1"
      ></my-echarts>
4. When the screen changes, the chart changes dynamically and renders again (focus):
Ecarts comes with a resize () method that can re render and draw the chart, but to call it manually, we use window Onresize event method. When the screen size changes, it calls the resize () method of echorts.
At myecharts Add in Vue component file:
. . . slightly
 mounted() {
    // When the screen changes, the chart changes dynamically and renders again
    var that = this;
    window.onresize = function () {
      that.myChart.resize();
    };
  },
  . . . slightly
You can:
5. When the size of the parent box of the chart label changes, the chart will be re rendered (RE):
In this method, we create a mixin JS file is written and built at random. At that time, the import path is written correctly, and then in myecharts Mix mixin in Vue JS file can be reused more easily. See the notes for code implementation:
// echarts adaptive parent box size change
const myMixin = {
  methods: {
    resize() {
      // It will be executed when the width and height change
      //Perform some operations to change the chart again, pass parameters and set animation effects at the same time
      this.myChart.resize({animation: {duration:1000}});
    },
  },
    //Custom instruction: the width of the chart is in percentage. If the width of the parent box changes, the size of the chart box also changes, but the chart will not be drawn again
  //Principle: judge that the width of the box itself has changed, and then call the resize method of eckarts to redraw
  directives: {
    // How to use local registration instructions
    resize: {
      // Name of the instruction
      bind(el, binding) {
        // el is the bound element and binding is the object bound to the instruction
        let width = "",
          height = "";
        function isReize() {
          //This method can get the css style object of the element
          const style = document.defaultView.getComputedStyle(el);
          //Compare whether the width has changed with the last time. If so
          if (width !== style.width || height !== style.height) {
            //Call the resize method
            binding.value(); // crux
          }
          //Record current width and height
          width = style.width;
          height = style.height;
        }
        //Set up a listener and compare it every other period of time
        el.__vueSetInterval__ = setInterval(isReize, 300);
      },
      //Called only once when the instruction is unbound from the element
      unbind(el) {
        //Clear timer
        clearInterval(el.__vueSetInterval__);
      },
    },
  },
}

export {myMixin};
At myecharts Vue mixing:
Define custom instructions first:
 <div
    v-resize="resize"
    :id="id"
    :style="{
      width: width,
      height: height,
    }"
  ></div>
Then mix in mixin js:
import { myMixin } from "../assets/mixins/mixin.js";

export default {
  mixins: [myMixin],
//..... slightly
}
At this point, the following is achieved:
6. Digression:
The fifth step, in the final analysis, is to monitor the changes of DOM elements. I use a timer to monitor every other period of time. In fact, it is not good and wastes performance. The new feature of the ResizeObserver API can help us monitor the changes of a DOM node. But this is a function in the experiment. If you are interested, you can check it yourself. I can also write a special article, if necessary, ha ha~
III Summary:
The above is the realization of all functions. It's relatively simple. If you don't understand, you can leave a message in the comment area~ 😆😆😆
See you next time. Bye ~ (^ 0 ^) ^
Recommend a movie to you --- little forest (super cure ~)

My beeper beeper space
Gitee warehouse address: All special effects source code
Q group chat (welcome): 629596039
Other articles:
~Follow me to see more simple creative effects:
Text smoke effect html+css+js
Surround reflection loading effect html+css
Bubble floating background effect html+css
Simple clock effect html+css+js
Cyberpunk style button html+css
Simulated Netease cloud official website rotation map html+css+js
Water wave loading animation html+css
Navigation bar scrolling gradient effect html+css+js
Book page turning html+css
3D album html+css
Neon painting board effect html+css+js
Remember some css attribute summary (I)
Sass summary notes
... wait
Go to my home page to see more~