thank
First of all, we need to thank the colleagues who participated in the investigation together. Without them, we can't complete the analysis.
Finally, the problem has not been solved. If it is solved, I hope the students of operation and maintenance can share it on the network to make up for the defects of this article.
background
At present, all Java applications use Spring Boot Actuator in Kubernetes as health check and readiness check. Some problems are encountered in the actual use process:
- Some middleware e-mail implementation problems lead to excessive middleware pressure (insufficient resource evaluation), resulting in inspection failure
- Simply, some nodes have HTTP request timeout (occasionally), the service is not under pressure, and the thread pool is very idle
For problem 1, we closed the relevant after evaluation, which may lead to excessive middleware pressure, but it is difficult for problem 2. This article introduces the methods and tools used in our analysis and solution process, Among them, Arthas has become the last trump card (there is no online environment. If you use restart for troubleshooting, the time will be unpredictable and cannot be solved at one time)
story
production accident
There are problems in the production system, and everyone is discharging their own problems (I'm also drunk). There are two computer rooms, one of which has more services than the other. We carry out health inspection, and we come up with solutions.
One of the development students said: without the health check, the service did not restart so many times. I just want to express that the low-frequency access of health examination will put pressure on the system. The number of requests has really increased. Is there any service capability?
Intervention investigation
We checked from the following aspects
- Whether the master node is under pressure, CPU, memory and disk are stable, troubleshooting
- Whether there is GC in the service, which can be excluded from the log and monitoring of the interruption time
- Whether the service has the problem of processing concurrency. From the monitoring, there are idle threads and they are not up to the maximum value. It is ruled out
- Whether the POD has network bandwidth and the disk IO is busy. The average monitoring score is not affected. It is excluded
How can a simple health check delay (not an error, no log for analysis) occur on a work node with little service pressure, which has exceeded my understanding.
At the same time point, from the analysis of Kubernetes' health check verification, it was caused by the health check timeout (it is difficult to get the correct result by using the command line [curl]). Compared with the monitored return time, it can be judged that the health check failed due to the health check processing timeout, but from the troubleshooting results, There is no solution (is restart a solution?), Out of the exploration of the problem, I thought of the heat map. From the results of Baidu, it led me to Alibaba's Arthas. Can it solve my current problem? I'll try.
Arthas
We are technology porters. Remember that the document must be subject to the official, and do not copy in this document.
Arthas official documents: https://arthas.aliyun.com/doc/#
Arthas online tutorial: https://arthas.aliyun.com/doc/arthas-tutorials.html?language=cn
What can Arthas do for you?

Arthas is an open source Java diagnostic tool of Alibaba, which is deeply loved by developers.
When you encounter the following similar problems and are helpless, Arthas can help you solve them:
- Which jar package is this class loaded from? Why are all kinds of related exceptions reported?
- Why didn't the code I changed execute? Am I not commit ted? Wrong branch?
- You can't debug online when you encounter a problem. Can you only republish it by adding a log?
- There is a problem with the data processing of a user online, but it is also impossible to debug online and reproduce offline!
- Is there a global perspective to view the health of the system?
- Is there any way to monitor the real-time running status of the JVM?
- How to quickly locate application hotspots and generate flame diagrams?
- How do I find an instance of a class directly from within the JVM?
Arthas supports JDK 6 +, Linux/Mac/Windows, adopts command-line interaction mode, and provides rich Tab automatic completion functions to further facilitate problem location and diagnosis.
Originally, we only wanted to find a flame diagram tool, but as a result, we found a new solution.
Full installation
Why? Production environment, unable to install online without full enjoyment.
Click to download the latest version: https://arthas.aliyun.com/download/latest_version?mirror=aliyun
After decompression, there is Arthas boot in the folder Jar, which can be started directly in Java jar mode:
java -jar arthas-boot.jar
Print help information:
java -jar arthas-boot.jar -h
analysis
Arthas online analysis
$ java -jar arthas-boot.jar
[INFO] arthas-boot version: 3.5.2
[INFO] Found existing java process, please choose one and input the serial number of the process, eg : 1. Then hit ENTER.
* [1]: 36 <you application>.jar
Select the first process, Enter 1, and then Enter / Enter:
After the Attach succeeds, the Arthas LOGO will be printed. Enter help to get more help information.
[INFO] Start download arthas from remote server: https://arthas.aliyun.com/download/3.5.2?mirror=center
[INFO] Download arthas success.
[INFO] arthas home: /root/.arthas/lib/3.5.2/arthas
[INFO] Try to attach process 36
[INFO] Attach process 36 success.
[INFO] arthas-client connect 127.0.0.1 3658
  ,---.  ,------. ,--------.,--.  ,--.  ,---.   ,---.
 /  O  \ |  .--. ''--.  .--'|  '--'  | /  O  \ '   .-'
|  .-.  ||  '--'.'   |  |   |  .--.  ||  .-.  |`.  `-.
|  | |  ||  |\  \    |  |   |  |  |  ||  | |  |.-'    |
`--' `--'`--' '--'   `--'   `--'  `--'`--' `--'`-----'


wiki       https://arthas.aliyun.com/doc
tutorials  https://arthas.aliyun.com/doc/arthas-tutorials.html
version    3.5.2
main_class
pid        36
time       2021-07-24 03:27:21

[arthas@36]$
Appear**[ arthas@36 ]$* * indicates that Arthas has successfully injected into the service.
Remember that the target process launches arthas. You must execute the stop command on the command line, otherwise the target process also runs the arthas program.
Locating Http problems
There is a problem with Http access. spring boot uses a servlet, so locate it through the following:
trace javax.servlet.Servlet * '#cost>1000' -n 1000 > /tmp/servlet.txt
Regular matching log
\[[0-9]{3,}.
+---[0.002946ms] org.springframework.web.context.request.ServletWebRequest:checkNotModified() #95
+---[0.004987ms] org.springframework.web.servlet.HandlerExecutionChain:applyPreHandle() #986
+---[0.001835ms] org.springframework.web.servlet.HandlerExecutionChain:getHandler() #991
+---[5960.628644ms] org.springframework.web.servlet.HandlerAdapter:handle() #95
+---[0.003077ms] org.springframework.web.context.request.async.WebAsyncManager:isConcurrentHandlingStarted() #993
+---[0.02907ms] org.springframework.web.servlet.DispatcherServlet:applyDefaultViewName() #997
|   `---[0.007616ms] org.springframework.web.servlet.DispatcherServlet:applyDefaultViewName()
+---[0.007406ms] org.springframework.web.servlet.HandlerExecutionChain:applyPostHandle() #998
+---[0.058581ms] org.springframework.web.servlet.DispatcherServlet:processDispatchResult() #1008
The main problem is that the service processing is time-consuming.
Positioning health check
trace org.springframework.boot.actuate.health.* -n 5000 --skipJDKMethod false > /tmp/actuate.txt
Be careful not to use trace.org springframework. boot. actuate.*, Otherwise, it will cause accidents.
Before all operations, you need to confirm the memory and limit of VM, otherwise it will cause accidents.
Remember to clean up the site before exiting, reset/stop, otherwise all operations will reside in the target process, which will cause a certain performance attenuation.
If possible, reduce the concurrent flow before operation to avoid production accidents.
Through the investigation, we obtained the following results
[3674.863706ms] org.springframework.boot.actuate.health.CompositeHealthIndicator:health()
 +---[min=0.326528ms,max=3673.201185ms,total=3673.967636ms,count=3] org.springframework.boot.actuate.health.HealthIndicator:health() #57
 |   +---[min=0.318738ms,max=0.425684ms,total=0.744422ms,count=2] org.springframework.boot.actuate.health.AbstractHealthIndicator:health()
 |   |   +---[min=0.017501ms,max=0.021212ms,total=0.038713ms,count=2] org.springframework.boot.actuate.health.Health$Builder:<init>() #82
 |   |   +---[min=0.198909ms,max=0.27063ms,total=0.469539ms,count=2] org.springframework.boot.actuate.health.AbstractHealthIndicator:doHealthCheck() #84
 |   |   |   +---[0.258485ms] org.springframework.boot.actuate.system.DiskSpaceHealthIndicator:doHealthCheck()
 |   |   |   `---[0.181693ms] org.springframework.cloud.health.RefreshScopeHealthIndicator:doHealthCheck()
 |   |   `---[min=0.076515ms,max=0.11343ms,total=0.189945ms,count=2] org.springframework.boot.actuate.health.Health$Builder:build() #94
 |   `---[0.111383ms] org.springframework.boot.actuate.health.AbstractReactiveHealthIndicator:health()
 |       +---[0.013442ms] org.springframework.boot.actuate.health.Health$Builder:<init>() #34
 |       +---[0.073209ms] org.springframework.boot.actuate.health.AbstractReactiveHealthIndicator:doHealthCheck() #57
 |       `---[0.003341ms] reactor.core.publisher.Mono:onErrorResume() #57
 +---[min=0.005404ms,max=0.026611ms,total=0.039894ms,count=3] java.util.Map:put() #57
From the log, we can see three health checks, but from the stack, there are only two, namely, DiskSpaceHealthIndicator and RefreshScopeHealthIndicator. The third is redis (the Lettuce client does not appear in the trace). Next, check the specific reasons.
org.springframework.boot.actuate.health.CompositeHealthIndicator is the entrance of health examination. Check the source code.
	@Override
	public Health health() {
		Map<String, Health> healths = new LinkedHashMap<>();
		for (Map.Entry<String, HealthIndicator> entry : this.indicators.entrySet()) {
			healths.put(entry.getKey(), entry.getValue().health());
		}
		return this.healthAggregator.aggregate(healths);
	}
Through breakpoint observation, redis check instance is found, as shown in the following figure:
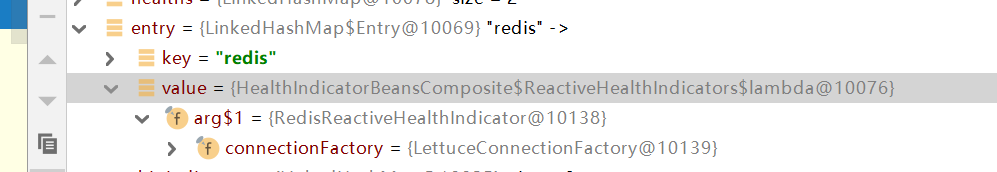 Because the implementation of HealthIndicatorBeansComposite is in org. Org springframework. boot. actuate. autoconfigure. Under the health package, so Arthas's trace cannot be tracked.
Let's take a look at the key implementation of HealthIndicatorBeansComposite. Through the ReactiveHealthIndicator reflection, lambda is added to the health check list through the adapt function. All asynchronous checks are executing block waiting.
private static class ReactiveHealthIndicators {
        private ReactiveHealthIndicators() {
        }

        public Map<String, HealthIndicator> get(ApplicationContext applicationContext) {
            Map<String, HealthIndicator> indicators = new LinkedHashMap();
            applicationContext.getBeansOfType(ReactiveHealthIndicator.class).forEach((name, indicator) -> {
                HealthIndicator var10000 = (HealthIndicator)indicators.put(name, this.adapt(indicator));
            });
            return indicators;
        }

        private HealthIndicator adapt(ReactiveHealthIndicator indicator) {
            return () -> {
                return (Health)indicator.health().block();
            };
        }
    }
Therefore, the lettue client uses the asynchronous reactivehealth indicator to check asynchronously. All the key is the blocking waiting mode implemented in the lambda expression sub implementation. The code is as follows:
() -> {
   return (Health)indicator.health().block();
};
hot fix
Since it is found that the formula may be blocked here, how to verify it? In order to avoid failure to locate the problem after restart, Arthas is used to hot fix the problem for verification.
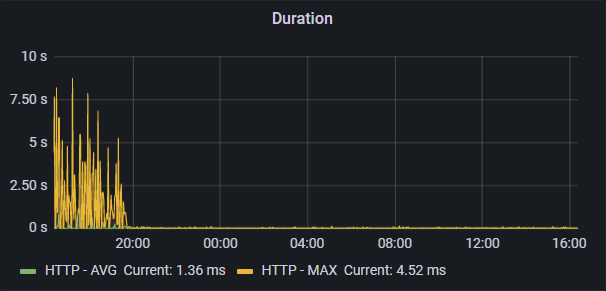
Let's take a look at the effect, as shown in the figure below:
 How? Refer to official documents? This time, we mainly modify org springframework. boot. actuate. health. Compositehealthindicator class for hot repair.
Decompile
You can decompile the code through the jad command. You can print only the decompiled source code through the – source only parameter:
jad --source-only org.springframework.boot.actuate.health.CompositeHealthIndicator > /tmp/CompositeHealthIndicator.java
Modify source code
...
public class CompositeHealthIndicator
       implements HealthIndicator {
           private final Map<String, HealthIndicator> indicators;
           private final HealthAggregator healthAggregator;

           public Health health() {
               LinkedHashMap<String, Health> healths = new LinkedHashMap<String, Health>();
               for (Map.Entry<String, HealthIndicator> entry : this.indicators.entrySet()) {
                   if (entry.getKey().equals("redis")) continue;
/*68*/             healths.put(entry.getKey(), entry.getValue().health());
               }
/*70*/         return this.healthAggregator.aggregate(healths);
           }
           ...
Add redis check and close
if (entry.getKey().equals("redis")) continue;
compile
sc find ClassLoader that loads UserController
$ sc -d org.springframework.boot.actuate.health.CompositeHealthIndicator  | grep classLoaderHash
 classLoaderHash   <classLoaderHash-id>
You can also use MC - c / TMP / compositehealthindicator Java - D / tmp, specify ClassLoaderHash with the - c parameter:
$ mc -c <classLoaderHash-id> /tmp/CompositeHealthIndicator.java -d /tmp
redefine
Then use the redefine command to reload the newly compiled compositehealth indicator class:
redefine /tmp/org/springframework/boot/actuate/health/CompositeHealthIndicator.class
$ redefine /tmp/org/springframework/boot/actuate/health/CompositeHealthIndicator.class
redefine success, size: 1
Problem location
Through hot repair and closing the health check of redis, we obtained this problem online. Indeed, we can reduce this problem by closing the health check of redis, but we still need to have the thinking of engineers. This problem can't be let go.
tcpdump
When problems are found, we reset and do tcpdump packet capture for problem analysis.
Through the message, we found that redis is a long link. The following is a screenshot of the message with the problem:
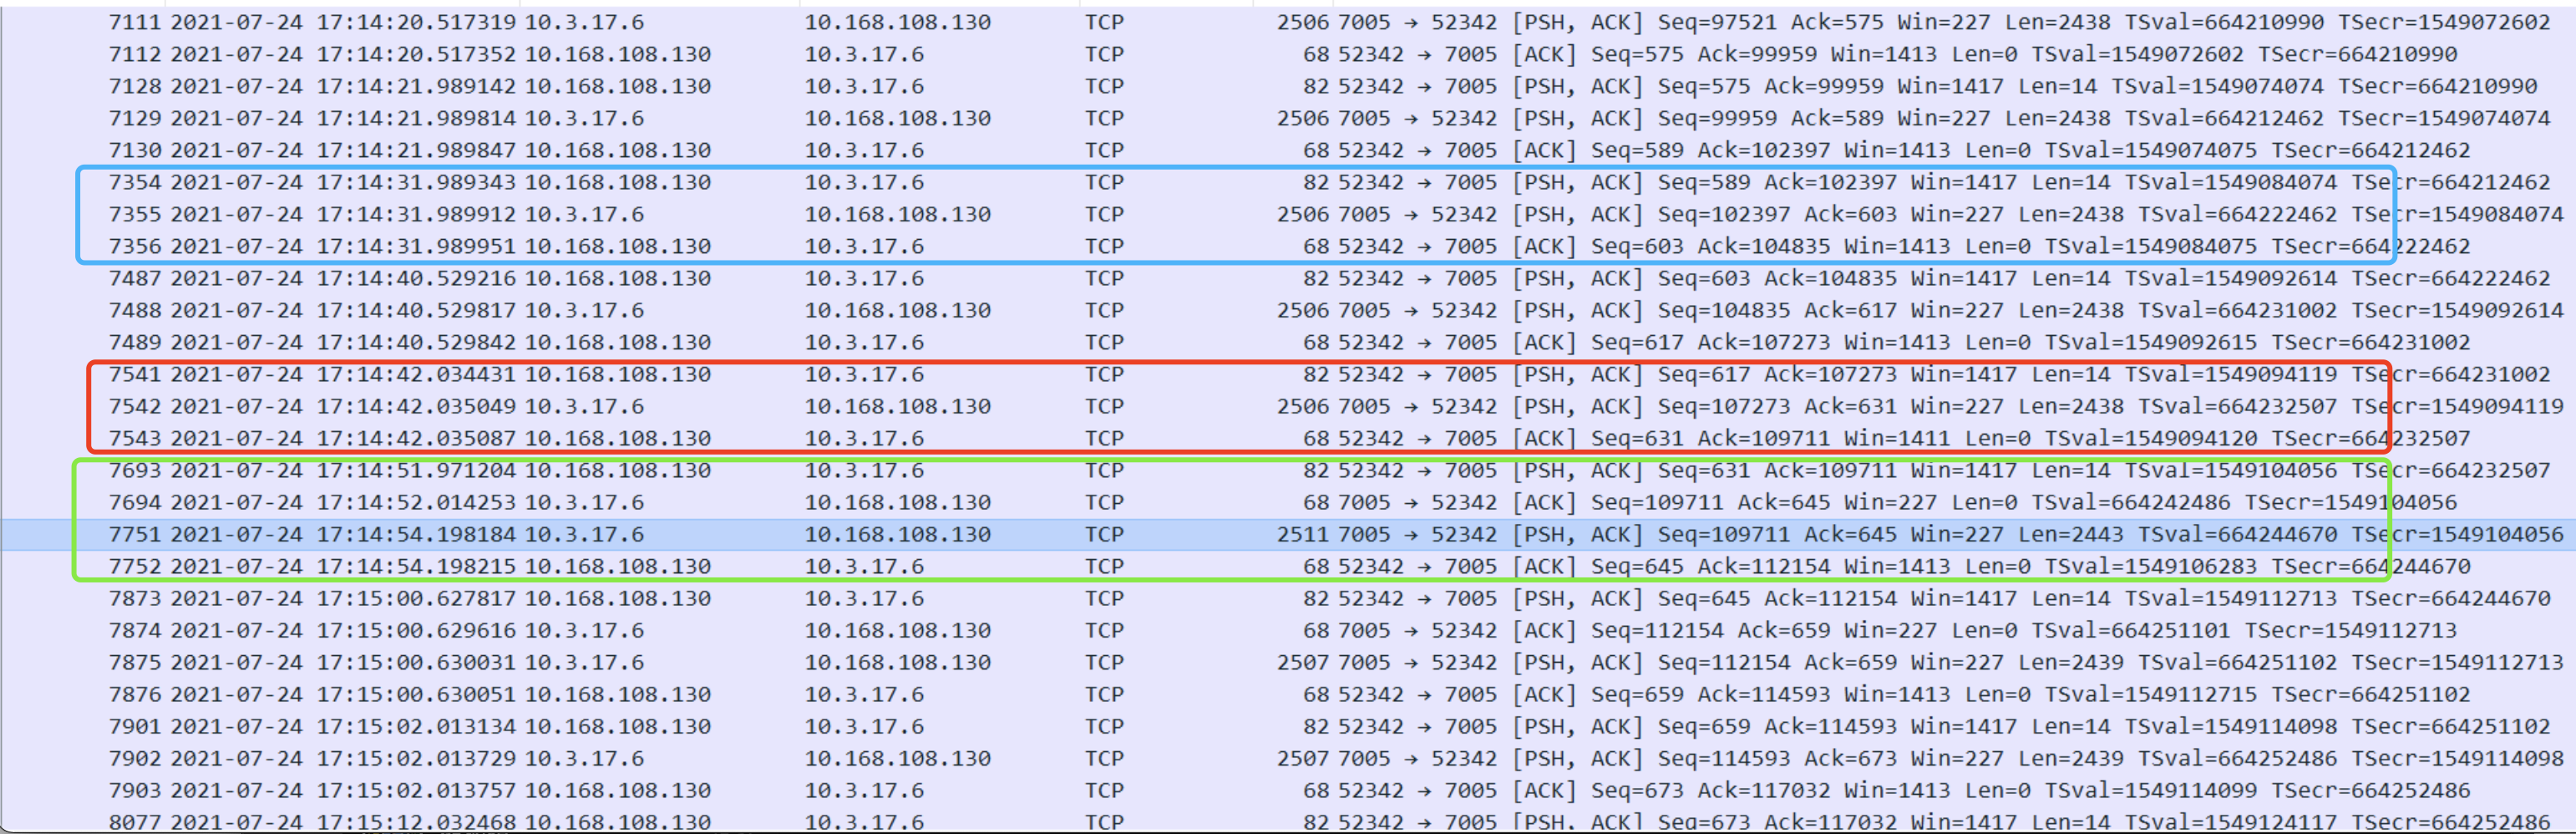 The normal packet sequence numbers are blue and red, but different packets in the green part need to be retransmitted, resulting in a 3s access delay. It is preliminarily judged that packet loss on the network may lead to message retransmission. It can be seen from the sequence number in seq that the message is received after retransmission.
This problem should have been bothered for a long time. I believe other problems also exist.
summary
Anything that seems uncoordinated has a problem, but you haven't found it yet, or choose to ignore it. Trying to prove that there is no problem is very simple. A few positive examples can be used (inner comfort), but the most difficult thing is to prove that there are problems (uncoordinated places). These places require you to take time to understand, think and experiment, which is often the place that most people are unwilling to invest at present.
reference resources
Arthas official documents: https://arthas.aliyun.com/doc/#