(https://juejin.cn/post/697868... "https://juejin.cn/post/6978685539985653767")」
preface
Hello, I'm Lin Sanxin. When I recalled my school recruitment, I was asked about canvas many times by the interviewer, but I didn't. later, I always wanted to find a chance to learn canvas, but I didn't have time. The position of canvas in the front end is becoming more and more important. Therefore, I specially wrote three small projects so that you can get started with canvas in 10 minutes. Yes, I don't have her in my heart, only you
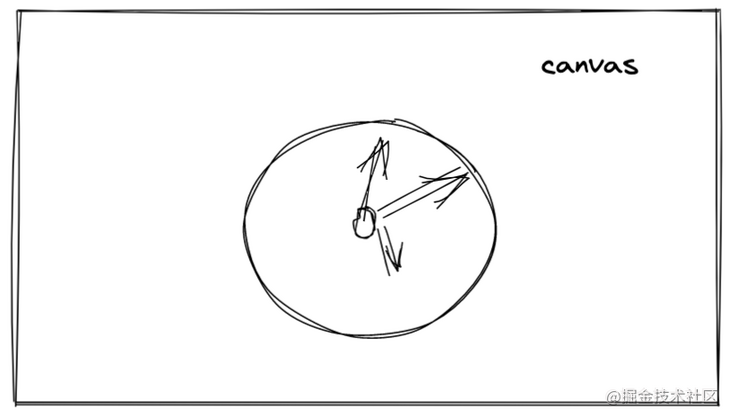
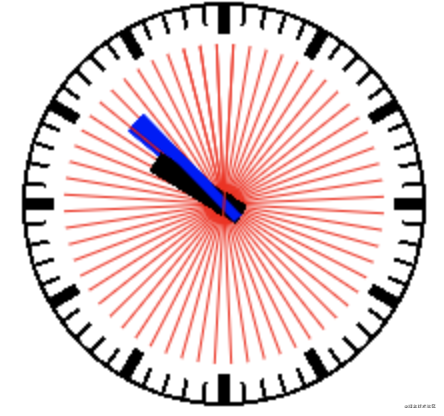
1. canvas realizes clock rotation
There are several steps to achieve the following effects:
- 1. Find the center of the canvas and draw the center and box
- 2. Get the current time and draw the hour hand, minute hand, second hand and scale according to the time
- 3. Use the timer to get a new time every second and redraw it to achieve the effect of clock rotation
1.1 table center, table frame
There are two knowledge points in the table frame:
- 1. Find the center of the canvas
2. Draw circle
//html

<canvas id="canvas" width="600" height="600"></canvas>

// js

// Set the center point. At this time, 300300 becomes 0, 0 of the coordinates
ctx.translate(300, 300)
// Draw a circle using arc (center point X, center point Y, radius, start angle, end angle)
ctx.arc(0, 0, 100, 0, 2 * Math.PI)
ctx.arc(0, 0, 5, 0, 2 * Math.PI)
// Execute the operation stroke of drawing line segments
ctx.stroke()
Let's take a look at the effect. It seems wrong. We want to draw two independent circles. How can the two circles be connected together
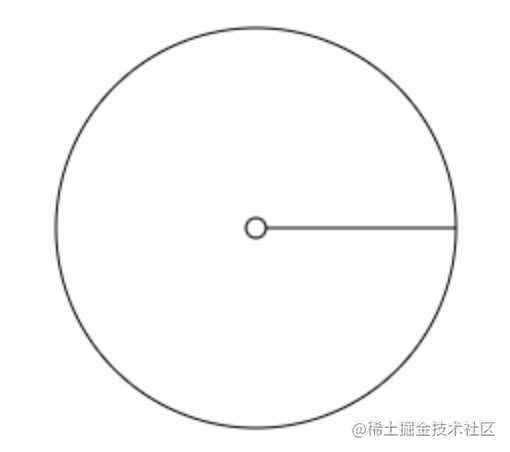
The reason is: when the above code draws a circle, it is drawn continuously, so after drawing the big circle, the line is not cut off, and then draw the small circle. Then the big circle and the small circle will be connected together. The solution is: beginPath, closePath
ctx.translate(300, 300) // Set the center point. At this time, 300300 becomes 0, 0 of the coordinates

// Draw a big circle
+ ctx.beginPath()
// Draw a circle using arc (center point X, center point Y, radius, start angle, end angle)
  ctx.arc(0, 0, 100, 0, 2 * Math.PI)
  ctx.stroke() // Perform the operation of drawing line segments
+ ctx.closePath()

// Draw a small circle
+ ctx.beginPath()
  ctx.arc(0, 0, 5, 0, 2 * Math.PI)
  ctx.stroke()
+ ctx.closePath()
1.2 hour hand, minute hand, second hand
Drawing these three pointers has two knowledge points:
- 1. Calculate the angle according to the current hour, minute and second
- 2. Draw the hour hand, minute hand and second hand on the calculated angle
How to draw a line according to the calculated angle? For example, if it is calculated that the current is 3 o'clock, then the clock should start at 12 o'clock and rotate 2 * math clockwise Pi / 12 * 3 = 90 °, the minute hand and the second hand are the same, but different from the hour hand is the problem of proportion, because there are 12 hours on the watch, while both the minute hand and the second hand are 60
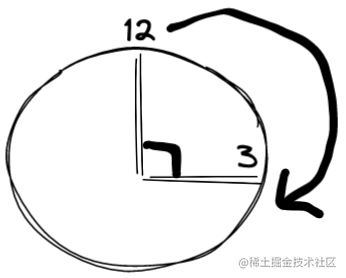
At this time, there is a new problem. Take the above example as an example, I calculated 90 °, so how can we draw the hour hand? We can use moveTo and lineTo to draw line segments. As for 90 °, we only need to rotate the x-axis clockwise by 90 °, and then draw this line segment, and we will get the pointer of the specified angle. But as mentioned above, we need to take 12 o'clock as the starting point. Our default x-axis is indeed horizontal, so after we calculate the angle with the hour, minute and second needle, we have to subtract 90 ° each time. Maybe it's a little windy. Let's demonstrate it through the following figure or take the example of 3 points above:
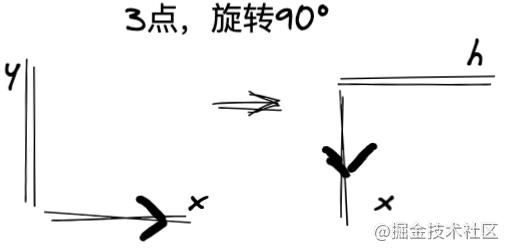
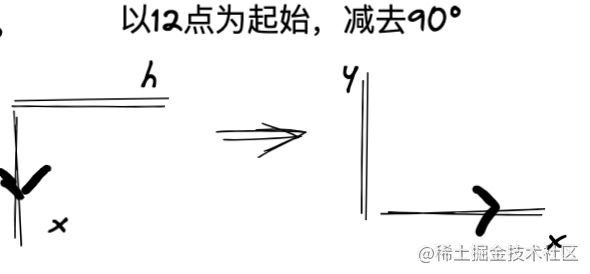
In this way, the drawing angle of the 3-point pointer is obtained.
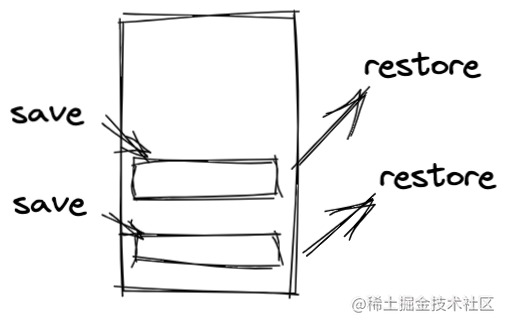
There are new problems. For example, now I have finished drawing the hour hand, and then I want to draw the minute hand. The x-axis has deflected when I draw the hour hand. At this time, we must restore the x-axis to its original shape before we can continue to draw the minute hand, otherwise the minute hand drawn is not allowed. At this time, save and restore come in handy. Save packs the current state of ctx into the stack. Restore takes the state at the top of the stack and assigns it to ctx. Save can be multiple times, but the number of times to restore the state must be equal to the number of times to save
After understanding the above, we can draw the scale. The principle of the starting scale is the same as that of the hour, minute and second needle, but the scale is dead and does not need to be calculated. We only need to draw 60 small scales and 12 large scales according to the rules
const canvas = document.getElementById('canvas')
const ctx = canvas.getContext('2d')

ctx.translate(300, 300) // Set the center point. At this time, 300300 becomes 0, 0 of the coordinates
// Save the state
+ ctx.save()

// Draw a big circle
ctx.beginPath()
// Draw a circle using arc (center point X, center point Y, radius, start angle, end angle)
ctx.arc(0, 0, 100, 0, 2 * Math.PI)
ctx.stroke() // Perform the operation of drawing line segments
ctx.closePath()

// Draw a small circle
ctx.beginPath()
ctx.arc(0, 0, 5, 0, 2 * Math.PI)
ctx.stroke()
ctx.closePath()

----- New code  ------

// Get current hour, minute, second
let time = new Date()
let hour = time.getHours() % 12
let min = time.getMinutes()
let sec = time.getSeconds()

// Hour hand
ctx.rotate(2 * Math.PI / 12 * hour + 2 * Math.PI / 12 * (min / 60) - Math.PI / 2)
ctx.beginPath()
// moveTo sets the starting point of the drawing line
ctx.moveTo(-10, 0)
// lineTo set the line passing point
ctx.lineTo(40, 0)
// Set lineweight
ctx.lineWidth = 10
ctx.stroke()
ctx.closePath()
// Restore to the state of the last save
ctx.restore()
// Save again after recovery
ctx.save()

// minute hand
ctx.rotate(2 * Math.PI / 60 * min + 2 * Math.PI / 60 * (sec / 60) - Math.PI / 2)
ctx.beginPath()
ctx.moveTo(-10, 0)
ctx.lineTo(60, 0)
ctx.lineWidth = 5
ctx.strokeStyle = 'blue'
ctx.stroke()
ctx.closePath()
ctx.restore()
ctx.save()

//second hand
ctx.rotate(2 * Math.PI / 60 * sec -  - Math.PI / 2)
ctx.beginPath()
ctx.moveTo(-10, 0)
ctx.lineTo(80, 0)
ctx.strokeStyle = 'red'
ctx.stroke()
ctx.closePath()
ctx.restore()
ctx.save()

// Drawing the scale is the same as drawing the hour, minute and second needle, but the scale is dead
ctx.lineWidth = 1
for (let i = 0; i < 60; i++) {
    ctx.rotate(2 * Math.PI / 60)
    ctx.beginPath()
    ctx.moveTo(90, 0)
    ctx.lineTo(100, 0)
    // ctx.strokeStyle = 'red'
    ctx.stroke()
    ctx.closePath()
}
ctx.restore()
ctx.save()
ctx.lineWidth = 5
for (let i = 0; i < 12; i++) {
    ctx.rotate(2 * Math.PI / 12)
    ctx.beginPath()
    ctx.moveTo(85, 0)
    ctx.lineTo(100, 0)
    ctx.stroke()
    ctx.closePath()
}

ctx.restore()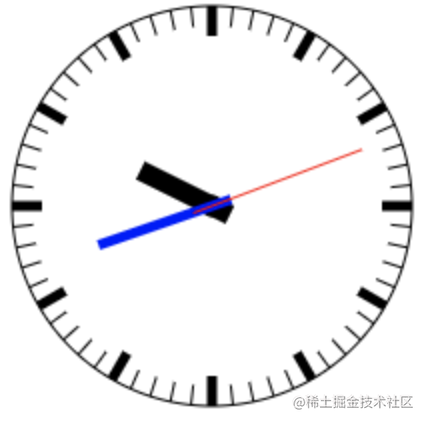
The last step is to update the view and make the clock turn. The first thought must be the timer setInterval, but pay attention to one problem: every time you update the view, clear the previous canvas and start drawing a new view, otherwise there will be a scene of thousand hand Guanyin
Attach final code:
const canvas = document.getElementById('canvas')
const ctx = canvas.getContext('2d')

setInterval(() => {
    ctx.save()
    ctx.clearRect(0, 0, 600, 600)
    ctx.translate(300, 300) // Set the center point. At this time, 300300 becomes 0, 0 of the coordinates
    ctx.save()

    // Draw a big circle
    ctx.beginPath()
    // Draw a circle using arc (center point X, center point Y, radius, start angle, end angle)
    ctx.arc(0, 0, 100, 0, 2 * Math.PI)
    ctx.stroke() // Perform the operation of drawing line segments
    ctx.closePath()

    // Draw a small circle
    ctx.beginPath()
    ctx.arc(0, 0, 5, 0, 2 * Math.PI)
    ctx.stroke()
    ctx.closePath()

    // Get current hour, minute, second
    let time = new Date()
    let hour = time.getHours() % 12
    let min = time.getMinutes()
    let sec = time.getSeconds()

    // Hour hand
    ctx.rotate(2 * Math.PI / 12 * hour + 2 * Math.PI / 12 * (min / 60) - Math.PI / 2)
    ctx.beginPath()
    // moveTo sets the starting point of the drawing line
    ctx.moveTo(-10, 0)
    // lineTo set the line passing point
    ctx.lineTo(40, 0)
    // Set lineweight
    ctx.lineWidth = 10
    ctx.stroke()
    ctx.closePath()
    ctx.restore()
    ctx.save()

    // minute hand
    ctx.rotate(2 * Math.PI / 60 * min + 2 * Math.PI / 60 * (sec / 60) - Math.PI / 2)
    ctx.beginPath()
    ctx.moveTo(-10, 0)
    ctx.lineTo(60, 0)
    ctx.lineWidth = 5
    ctx.strokeStyle = 'blue'
    ctx.stroke()
    ctx.closePath()
    ctx.restore()
    ctx.save()

    //second hand
    ctx.rotate(2 * Math.PI / 60 * sec - Math.PI / 2)
    ctx.beginPath()
    ctx.moveTo(-10, 0)
    ctx.lineTo(80, 0)
    ctx.strokeStyle = 'red'
    ctx.stroke()
    ctx.closePath()
    ctx.restore()
    ctx.save()

    // Drawing the scale is the same as drawing the hour, minute and second needle, but the scale is dead
    ctx.lineWidth = 1
    for (let i = 0; i < 60; i++) {
        ctx.rotate(2 * Math.PI / 60)
        ctx.beginPath()
        ctx.moveTo(90, 0)
        ctx.lineTo(100, 0)
        // ctx.strokeStyle = 'red'
        ctx.stroke()
        ctx.closePath()
    }
    ctx.restore()
    ctx.save()
    ctx.lineWidth = 5
    for (let i = 0; i < 12; i++) {
        ctx.rotate(2 * Math.PI / 12)
        ctx.beginPath()
        ctx.moveTo(85, 0)
        ctx.lineTo(100, 0)
        // ctx.strokeStyle = 'red'
        ctx.stroke()
        ctx.closePath()
    }

    ctx.restore()
    ctx.restore()
}, 1000)
The effect is very good:
2. Realize scraping card with canvas
When I was a child, many people bought recharge cards and understood everything. Ah ha, scrape off the gray skin with their nails and you can see the answers below.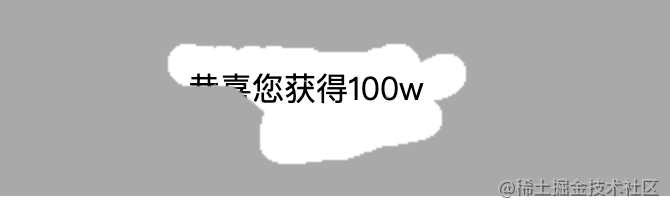
The idea is as follows:
- 1. The answer below is a div, and the gray skin on the top is a canvas, which covers the div at the beginning
- 2. For mouse events, when clicking and moving, the paths passed by the mouse are drawn in a circle, and the globalCompositeOperation is set to destination out, so that the paths passed by the mouse become transparent. Once transparent, the answer information below will be displayed naturally.
The fill method is actually benchmarking stroke. Fill is filling the figure, and stroke just draws the border line
// html
<canvas id="canvas" width="400" height="100"></canvas>
<div class="text">Congratulations on getting 100 w</div>
<style>
        * {
            margin: 0;
            padding: 0;
        }
        .text {
            position: absolute;
            left: 130px;
            top: 35px;
            z-index: -1;
        }
</style>


// js
const canvas = document.getElementById('canvas')
const ctx = canvas.getContext('2d')

// Fill color
ctx.fillStyle = 'darkgray'
// Fill rectangle fillRect (start x, start Y, end X, end Y)
ctx.fillRect(0, 0, 400, 100)
ctx.fillStyle = '#fff'
// Draw fill text
ctx.fillText('Scraping card', 180, 50)

let isDraw = false
canvas.onmousedown = function () {
    isDraw = true
}
canvas.onmousemove = function (e) {
    if (!isDraw) return
    // Calculate the position of the mouse in the canvas
    const x = e.pageX - canvas.offsetLeft
    const y = e.pageY - canvas.offsetTop
    // Set globalCompositeOperation
    ctx.globalCompositeOperation = 'destination-out'
    // Draw a circle
    ctx.arc(x, y, 10, 0, 2 * Math.PI)
    // Fill circle
    ctx.fill()
}
canvas.onmouseup = function () {
    isDraw = false
}
The effects are as follows:

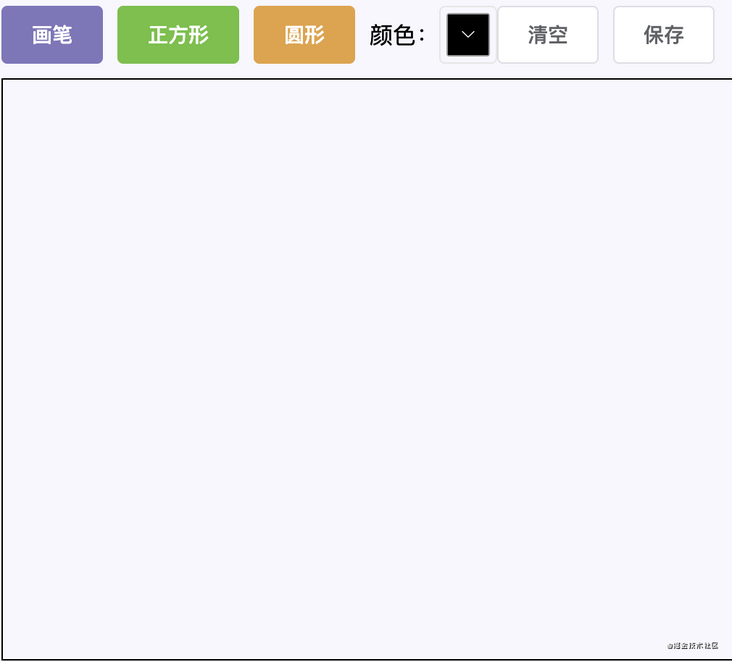
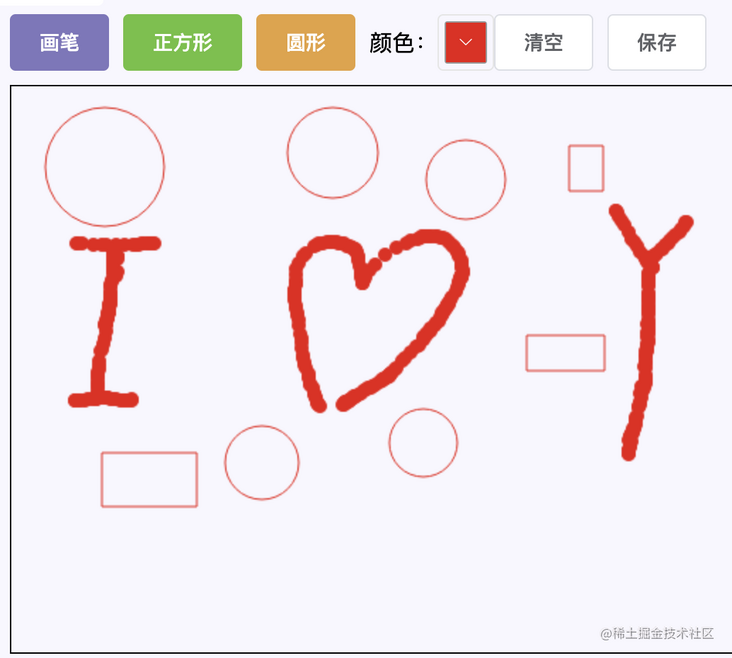
3. canvas realizes drawing board and saving
Frame: use vue + elementUI
In fact, it is very simple. The difficulties are as follows:
- 1. Drag the mouse to draw squares and circles
- 2. After drawing a canvas, save it and overlay it next time
- 3. Save picture
First, you only need to calculate the coordinates of the point clicked by the mouse and the current coordinates of the mouse. The length and width of the rectangle are calculated as x - beginX, y - beginY, and the Pythagorean theorem is used for the circle: math sqrt((x - beginX) * (x - beginX) + (y - beginY) * (y - beginY))
Second, use the getImageData and putImageData methods of canvas
Third, the idea is to generate picture links from canvas, assign them to a tag with download function, and actively click a tag to download pictures
Let's see the effect:
I won't explain the specific code too much. It's not difficult to say. As long as the first two projects are understood, this project is easy to understand:
<template>
  <div>
    <div style="margin-bottom: 10px; display: flex; align-items: center">
      <el-button @click="changeType('huabi')" type="primary">paint brush</el-button>
      <el-button @click="changeType('rect')" type="success">square</el-button>
      <el-button
        @click="changeType('arc')"
        type="warning"
        style="margin-right: 10px"
        >circular</el-button
      >
      <div>Color:</div>
      <el-color-picker v-model="color"></el-color-picker>
      <el-button @click="clear">empty</el-button>
      <el-button @click="saveImg">preservation</el-button>
    </div>
    <canvas
      id="canvas"
      width="800"
      height="400"
      @mousedown="canvasDown"
      @mousemove="canvasMove"
      @mouseout="canvasUp"
      @mouseup="canvasUp"
    >
    </canvas>
  </div>
</template>

<script>
export default {
  data() {
    return {
      type: "huabi",
      isDraw: false,
      canvasDom: null,
      ctx: null,
      beginX: 0,
      beginY: 0,
      color: "#000",
      imageData: null,
    };
  },
  mounted() {
    this.canvasDom = document.getElementById("canvas");
    this.ctx = this.canvasDom.getContext("2d");
  },
  methods: {
    changeType(type) {
      this.type = type;
    },
    canvasDown(e) {
      this.isDraw = true;
      const canvas = this.canvasDom;
      this.beginX = e.pageX - canvas.offsetLeft;
      this.beginY = e.pageY - canvas.offsetTop;
    },
    canvasMove(e) {
      if (!this.isDraw) return;
      const canvas = this.canvasDom;
      const ctx = this.ctx;
      const x = e.pageX - canvas.offsetLeft;
      const y = e.pageY - canvas.offsetTop;
      this[`${this.type}Fn`](ctx, x, y);
    },
    canvasUp() {
      this.imageData = this.ctx.getImageData(0, 0, 800, 400);
      this.isDraw = false;
    },
    huabiFn(ctx, x, y) {
      ctx.beginPath();
      ctx.arc(x, y, 5, 0, 2 * Math.PI);
      ctx.fillStyle = this.color;
      ctx.fill();
      ctx.closePath();
    },
    rectFn(ctx, x, y) {
      const beginX = this.beginX;
      const beginY = this.beginY;
      ctx.clearRect(0, 0, 800, 400);
      this.imageData && ctx.putImageData(this.imageData, 0, 0, 0, 0, 800, 400);
      ctx.beginPath();
      ctx.strokeStyle = this.color;
      ctx.rect(beginX, beginY, x - beginX, y - beginY);
      ctx.stroke();
      ctx.closePath();
    },
    arcFn(ctx, x, y) {
      const beginX = this.beginX;
      const beginY = this.beginY;
      this.isDraw && ctx.clearRect(0, 0, 800, 400);
      this.imageData && ctx.putImageData(this.imageData, 0, 0, 0, 0, 800, 400);
      ctx.beginPath();
      ctx.strokeStyle = this.color;
      ctx.arc(
        beginX,
        beginY,
        Math.round(
          Math.sqrt((x - beginX) * (x - beginX) + (y - beginY) * (y - beginY))
        ),
        0,
        2 * Math.PI
      );
      ctx.stroke();
      ctx.closePath();
    },
    saveImg() {
      const url = this.canvasDom.toDataURL();
      const a = document.createElement("a");
      a.download = "sunshine";
      a.href = url;
      document.body.appendChild(a);
      a.click();
      document.body.removeChild(a);
    },
    clear() {
        this.imageData = null
        this.ctx.clearRect(0, 0, 800, 400)
    }
  },
};
</script>

<style lang="scss" scoped>
#canvas {
  border: 1px solid black;
}
</style>
epilogue
I'm Lin Sanxin, an enthusiastic front-end rookie programmer. If you are self-motivated, like the front end and want to learn from the front end, we can make friends and fish together. Ha ha, fish school, add me, please note [Si no]