A major feature of neural network development is that once we input large-scale data into the network for analysis, you feel like throwing out a paper plane. In addition to the control you have at the moment of throwing out, once you leave your hand, you can no longer control how it flies and floats. The operation of neural network code has this feature. We can't set breakpoints like ordinary programs and then debug them step by step. Once running, we can only observe the results. What's depressing is that many times training is very time-consuming. After running for a few hours, you suddenly find a bug in the code, so you stop the program and have to wait for several hours after correction.
Fortunately, the keras framework has been aware of this for a long time. It provides a corresponding mechanism that allows us to monitor the operation of the network at any time. From the previous chapters, we can see that usually we don't know how many cycles are required for the network to achieve the best effect. We often let the network train many cycles until over fitting occurs. I then observe the training process data to find the training cycle required for the network to achieve the best condition, and then we reset the number of cycles, Running the network again is very time-consuming and inefficient.
A good solution is to provide a monitoring mechanism. Once it is found that the network has not significantly improved the judgment accuracy of verification data, stop training. keras provides a callback mechanism for us to monitor the training status of the network at any time. When we only need fit function to start network training, we can provide a callback object. After each network training process, it will call back the function provided by us. In the function, we can access all network parameters to know the current running state of the network. At this time, we can take a variety of measures, such as terminating the training process and saving all network parameters, Loading new parameters, etc. we can even change the running state of the network.
Specifically, the callback provided by keras allows us to complete several operations. One is to store all the current parameters of the network; One is to stop the training process; One is to adjust some parameters related to training, such as learning rate, the other is to output network status information or visually output the internal conditions of the network. Let's see some code examples:
import keras
callbacks_list = [
   #Stop the training process. Once the judgment rate of the network on the verification data is no longer improved, patience indicates that it will stop when the judgment rate is not improved between the two cycles
   keras.callbacks.EarlyStopping(monitor='acc', patience=1),
   '''
   Save the current parameters to a file at the end of each training cycle my_model.h5,
   The latter two parameters show that when the network judgment rate is not improved, the parameters are not stored
   '''
   keras.callbacks.ModelCheckPoint(filepat='my_model.h5',
                                  monitor='val_loss',
                                  save_best_only=True),
'''
   If the judgment rate of the network on the verification data has not improved within 10 training cycles, the following callback will modify the learning rate
   '''
   keras.callbacks.ReduceLROnPlateau(monitor='val_loss',
                                    factor=0.1,
                                    patience=10,
                                    )
]model.compile(optimizer='rmsprop',
            loss='binary_crossentropy',
            metrics=['acc'])
'''
Since the callback function will monitor the accuracy of the network's judgment on the verification data, the verification data must be passed in when training the network
'''
model.fit(x, y, epochs = 10, callbacks = callbacks_list,
        validation_data = (x_val, y_val))
To train an accurate network, an important premise is that we can always grasp the changes in the internal state of the network. If these changes can be displayed in real time in a visual way, we can easily grasp the changes in the internal state of the network. A component attached to the keras framework called tensorboard can effectively help us achieve this, Next, we construct a network, input data to train the network, and then activate tensorboard to see the changes of the network in the training process in a visual way:
import keras;
from keras import layers
from keras.datasets import imdb
from keras.preprocessing import sequencemax_features = 2000
max_len = 500(x_train, y_train), (x_test, y_test) = imdb.load_data(num_words = max_features)
x_train = sequence.pad_sequences(x_train, maxlen=max_len)
x_test = sequence.pad_sequence(x_test, maxlen = max_len)model = keras.models.Sequential()
model.add(layers.Embedding(max_features, 128, input_length = max_len,
                         name = 'embed'))
model.add(layers.Conv1D(32, 7, activation='relu'))
model.add(layers.MaxPooling1D(5))
model.add(layers.Conv1D(32, 7, activation='relu'))
model.add(layers.GlobalMaxPooling1D())
model.add(layers.Dense(1))
model.summary()
model.compile(optimizer = 'rmsprop', loss = 'binary_crossentropy',
            metrics = ['acc'])
We have explained the above code before. The focus here is no longer to understand its logic, but to make it run. Then we use tensorboard to observe the changes in the internal state of the network. To use tensorboard, we need to create a directory to store the logs generated during its operation:
!mkdir my_log_dir
Next, we inject a callback hook into the network to pass the internal information to the tensorbaord component at runtime:
callbacks = [
   keras.callbacks.TensorBoard(log_dir='my_log_dir',
                               #The histogram is used to display information every other training cycle
                              histogram_freq = 1,
                              embeddings_freq = 1)
]history = model.fit(x_train, y_train,
                  epochs = 20,
                  batch_size = 128,
                  validation_split = 0.2,
                  callbacks = callbacks)
After executing the above code to start the training, we enter the following command on the console:
conda activate tensorflow
tensorboard --log_dir=my_log_dir
The first command is used to activate the environment where tensorflow is installed. The second command starts the tensorbaord server. Enter in the browser: http://localhost:6006 You can open the visualization environment, as shown in the following figure:
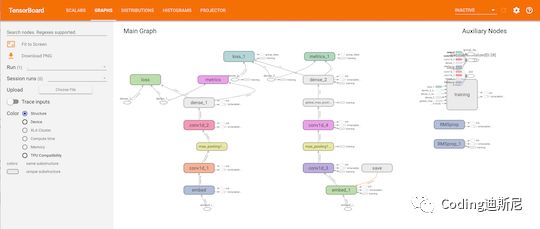
Click histogram, and we can see the changes in the internal state of the network in the form of histogram:
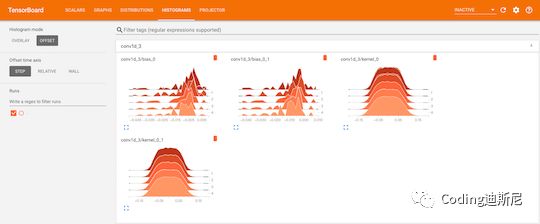
What's more powerful is that it will show the word vector we trained in a visual way. Click Projector and you will see the following three-dimensional animation:
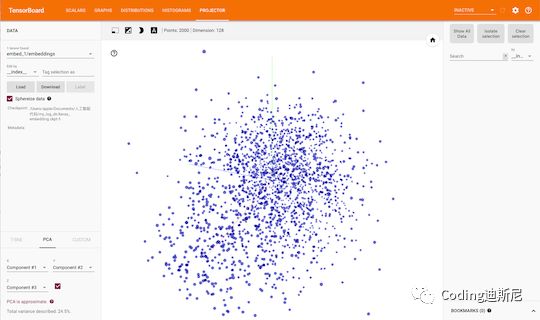
It uses t-SNE visualization algorithm to transform high-dimensional vectors into two-dimensional space for display. Click the Graph button, which will draw the network model diagram to let you understand the network hierarchy:
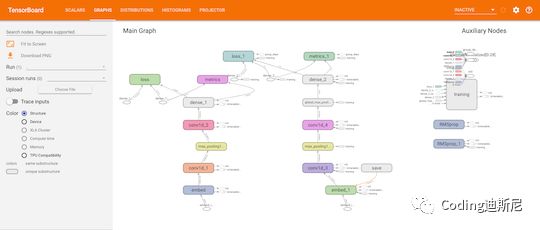
With the help of callback function and tensorboard component, we no longer need to regard the network as a black box that can't be peeped. Through tensorboard, we can master the training process and internal state changes of the network with very detailed visual assistance.