Chapter 1: example demonstration
① Pyecarts version 1.9.1 installation and data preparation
First, you need to install the pyecarts library. Just PIP install pyecarts directly.
The new version does not need to be installed separately. If it is version 0.5, it needs to be installed separately. At present, the latest version 1.9.1 is demonstrated
The map data are as follows:
Because it is a map of China, I set two groups for the targeted provinces, and the data in them are randomly generated.
# -*- coding:utf-8 -*-
# 2022-1-14
# Author: Xiaolan jujube
# Pyecarts map

# Libraries that need to be referenced
from pyecharts import options as opts
from pyecharts.charts import Map
import random

# Set the relevant provinces where Altman exists, and set the initial quantity to 0
ultraman = [
['Sichuan', 0],
['Taiwan', 0],
['Xinjiang', 0],
['Jiangxi', 0],
['Henan', 0],
['Liaoning', 0],
['Tibet', 0]
]

# Set the relevant provinces where monsters exist, and set the initial number to 0
monster = [
['Guangdong', 0],
['Beijing', 0],
['Shanghai', 0],
['Jiangxi', 0],
['Hunan', 0],
['Zhejiang', 0],
['Jiangsu', 0]
]

def data_filling(array):
    '''
     Function: fill array data with random numbers
    '''
    for i in array:
        # Randomly generate random numbers from 1 to 1000
        i[1] = random.randint(1,1000)
        print(i)

data_filling(ultraman)
data_filling(monster)
② Add data items, and the default China map is displayed
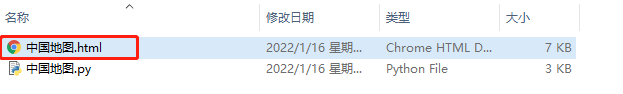
First, show me how to add a group of data. After running, an html file will be generated. After opening, you can view the generated map.
def create_china_map():
    '''
     Function: generate map of China
    '''
    (
        Map()
        .add(
            series_name="Monster",
            data_pair=monster,
            maptype="china",
        )
        # Set title
        .set_global_opts(title_opts=opts.TitleOpts(title="map of China"))
        # Generate local html file
        .render("map of China.html")
    )
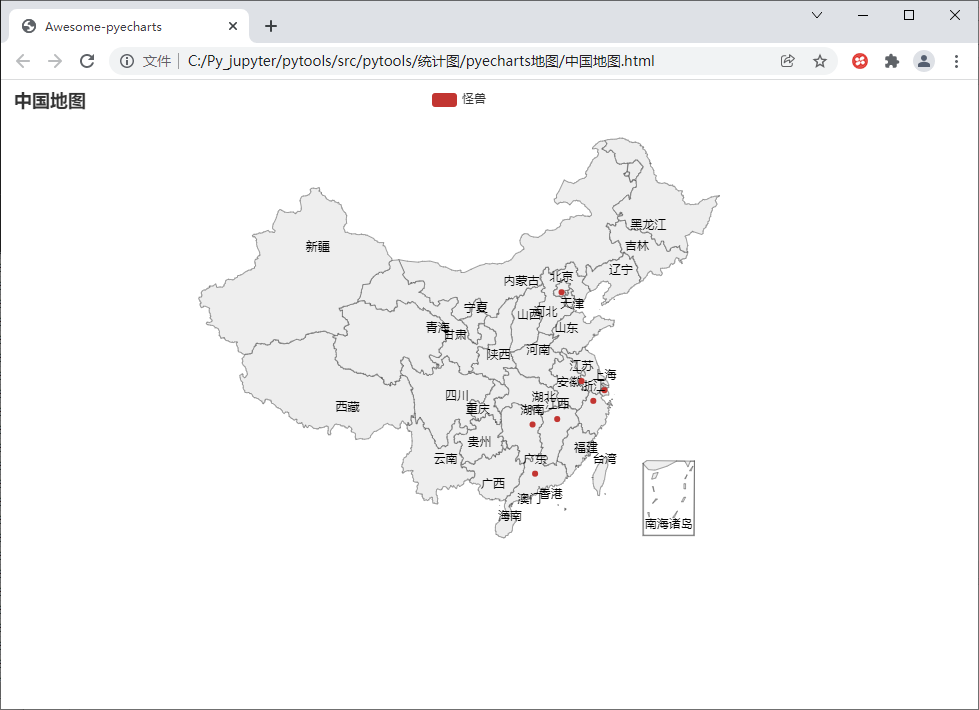
Then, add two groups of data under the demonstration. Just add an add() function, which is very convenient.
def create_china_map():
    '''
     Function: generate map of China
    '''
    (
        Map()
        .add(
            series_name="Ultraman",
            data_pair=ultraman,
            maptype="china",
        )
        .add(
            series_name="Monster",
            data_pair=monster,
            maptype="china",
        )
        # Set title
        .set_global_opts(title_opts=opts.TitleOpts(title="map of China"))
        # Generate local html file
        .render("map of China.html")
    )
Chapter 2: common configuration items and parameter analysis
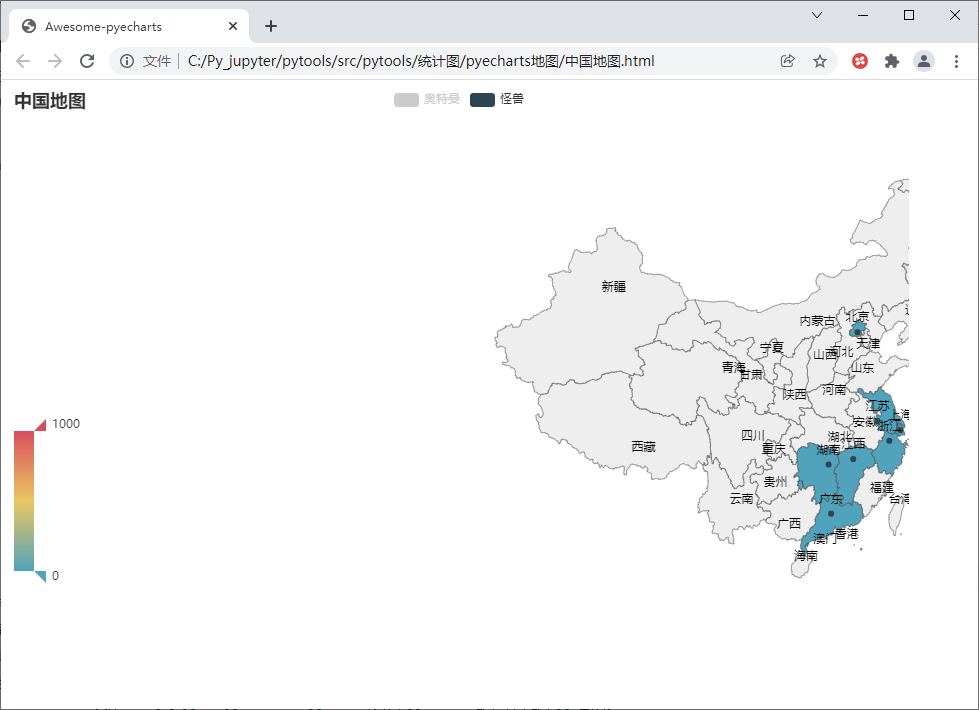
① Set whether it is selected by default
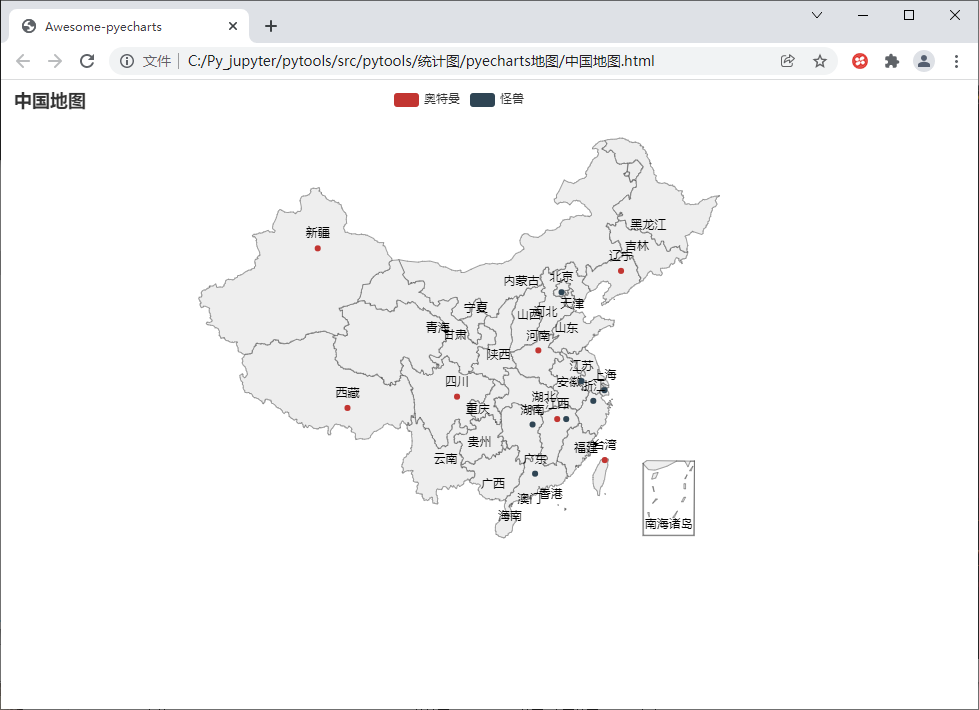
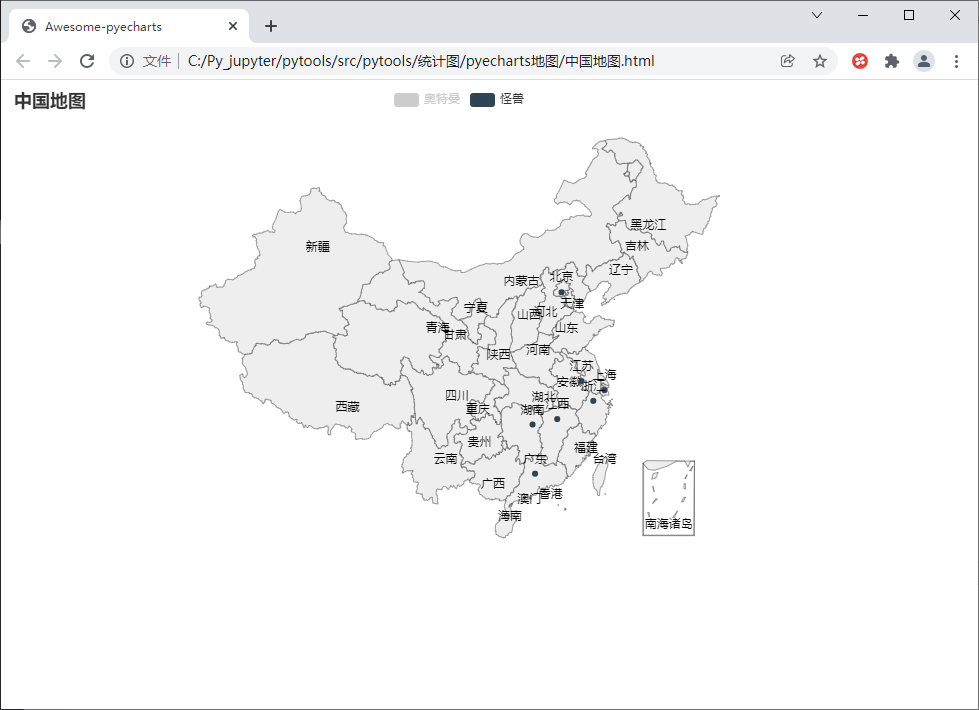
It is selected by default and is is added_ The selected = false parameter can be set to not display by default.
def create_china_map():
    '''
     Function: generate map of China
    '''
    (
        Map()
        .add(
            series_name="Ultraman",
            data_pair=ultraman,
            maptype="china",
            # Selected by default
            is_selected=False
        )
        .add(
            series_name="Monster",
            data_pair=monster,
            maptype="china",
        )
        # Set title
        .set_global_opts(title_opts=opts.TitleOpts(title="map of China"))
        # Generate local html file
        .render("map of China.html")
    )

create_china_map()
You can see that only monster data is displayed by default.
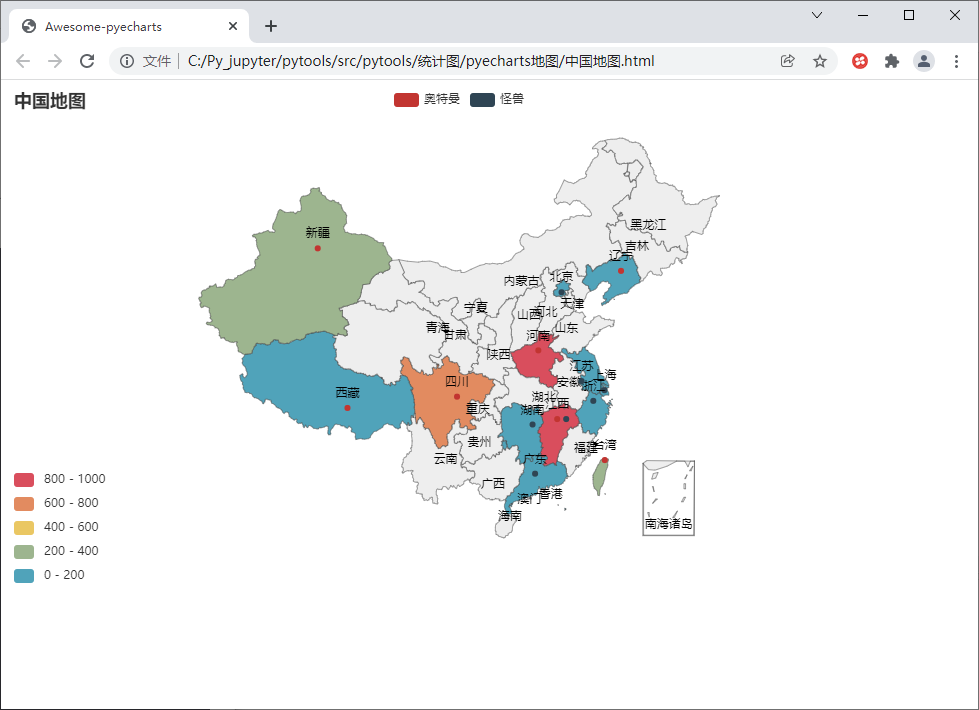
② Sets whether the map color type is displayed in segments
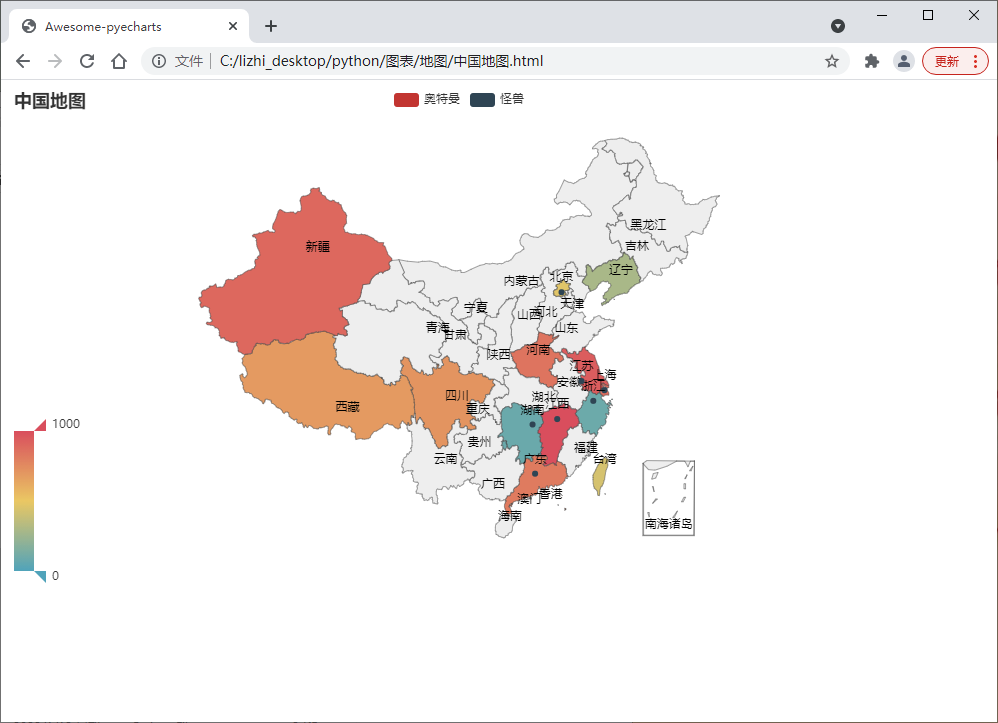
Visual map configuration item_ opts=opts. Visualmappts (max_ = 1000, is_piecewise=True) can be set to segment display of map color type, max_ The value of corresponds to the data range, and the parameter is_piecewise=True indicates segmented display.
def create_china_map():
    '''
     Function: generate map of China
    '''
    (
        Map()
        .add(
            series_name="Ultraman",
            data_pair=ultraman,
            maptype="china",
            # Selected by default
            is_selected=True
        )
        .add(
            series_name="Monster",
            data_pair=monster,
            maptype="china",
        )
        .set_global_opts(
        # Set title
        title_opts=opts.TitleOpts(title="map of China"),
        # Set segment display
        visualmap_opts=opts.VisualMapOpts(max_=1000, is_piecewise=True)
        )
        # Generate local html file
        .render("map of China.html")
    )
Segmented display rendering:
def create_china_map():
'''
Function: generate map of China
'''
(
Map()
.add(
series_name="Ultraman",
data_pair=ultraman,
maptype="china",
# Selected by default
is_selected=True
)
.add(
series_name="Monster",
data_pair=monster,
maptype="china",
)
.set_global_opts(
# Set title
title_opts=opts.TitleOpts(title="map of China"),
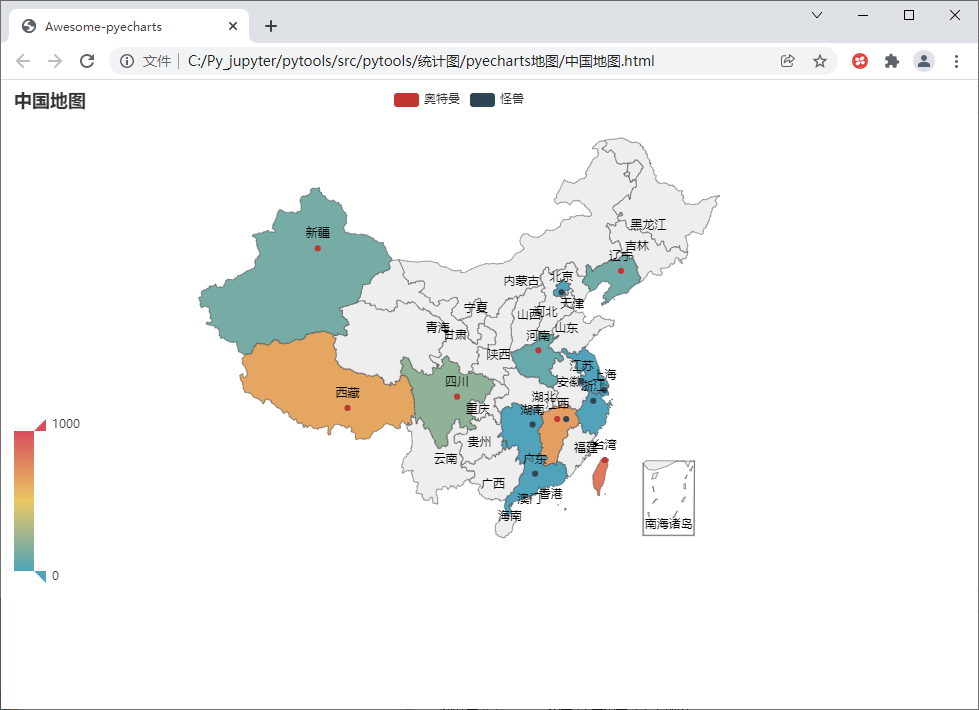
# Set standard display
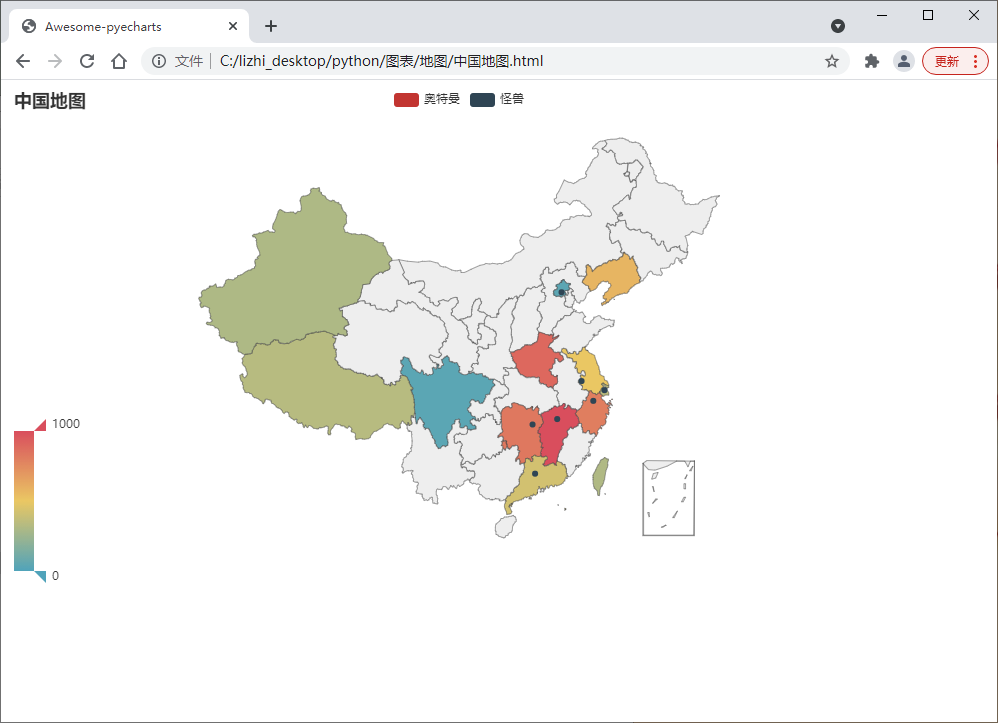
visualmap_opts=opts.VisualMapOpts(max_=1000, is_piecewise=False)
)
# Generate local html file
.render("map of China.html")
)
This is the parameter is_ Standard display of piecewise = false.
③ Zoom pan configuration
Parameter is_roam=False controls that mouse zooming and panning are not possible.
def create_china_map():
    '''
     Function: generate map of China
    '''
    (
        Map()
        .add(
            series_name="Ultraman",
            data_pair=ultraman,
            maptype="china",
            # Whether it is selected by default. The default value is True
            is_selected=True,
            # Whether to enable mouse wheel scaling and drag panning. The default is True
            is_roam=False
        )
        .add(
            series_name="Monster",
            data_pair=monster,
            maptype="china",
        )
        .set_global_opts(
        # Set title
        title_opts=opts.TitleOpts(title="map of China"),
        # Set standard display
        visualmap_opts=opts.VisualMapOpts(max_=1000, is_piecewise=False)
        )
        # Generate local html file
        .render("map of China.html")
    )
When the parameter is enabled, the mouse wheel can zoom in and out of the image.
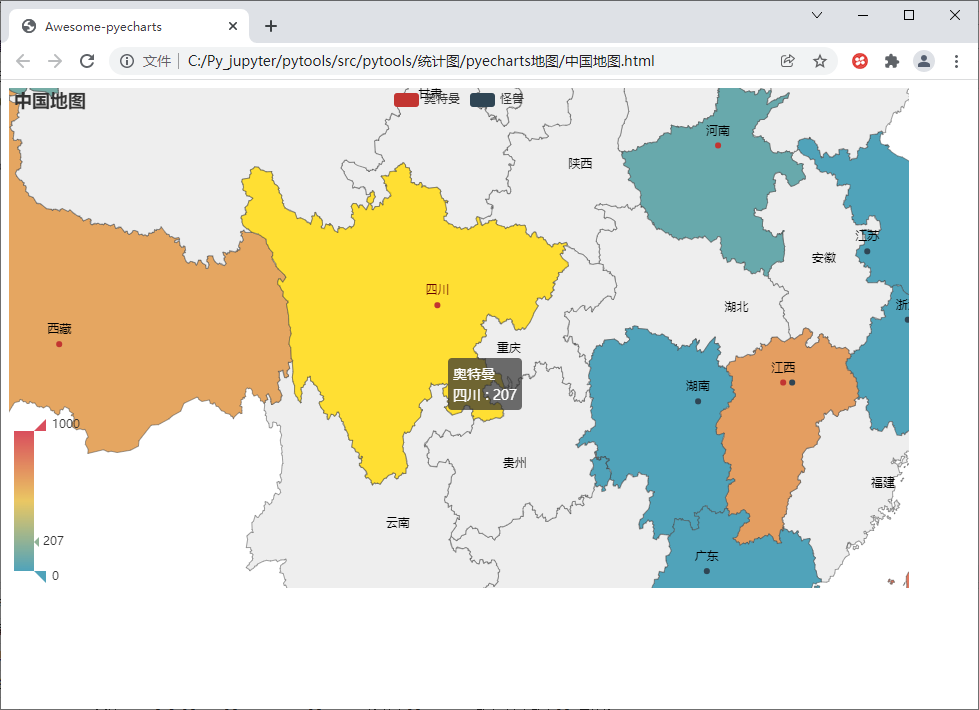
The mouse can drag left and right to pan the map.
Priority statement: a data is set to False and b data is set to True. If a data is not selected, you can also zoom, pan and drag.
④ Turn graphical markers on and off
Parameter is_map_symbol_show=False to turn off the graphic mark, and the point will not be displayed when it is turned off.
def create_china_map():
    '''
     Function: generate map of China
    '''
    (
        Map()
        .add(
            series_name="Ultraman",
            data_pair=ultraman,
            maptype="china",
            # Whether it is selected by default. The default value is True
            is_selected=True,
            # Whether to enable mouse wheel scaling and drag panning. The default is True
            is_roam=True,
            # Whether to display graphic markers. The default is True
            is_map_symbol_show=False
        )
        .add(
            series_name="Monster",
            data_pair=monster,
            maptype="china",
        )
        .set_global_opts(
        # Set title
        title_opts=opts.TitleOpts(title="map of China"),
        # Set standard display
        visualmap_opts=opts.VisualMapOpts(max_=1000, is_piecewise=False)
        )
        # Generate local html file
        .render("map of China.html")
    )
You can see that there are no points in the area related to Altman.
⑤ Turn off label name display
Parameter label of series configuration item_ opts=opts. Labelopts (is_show = false) can turn off the display of label names.
def create_china_map():
    '''
     Function: generate map of China
    '''
    (
        Map()
        .add(
            series_name="Ultraman",
            data_pair=ultraman,
            maptype="china",
            # Whether it is selected by default. The default value is True
            is_selected=True,
            # Whether to enable mouse wheel scaling and drag panning. The default is True
            is_roam=True,
            # Whether to display graphic markers. The default is True
            is_map_symbol_show=False
        )
        .add(
            series_name="Monster",
            data_pair=monster,
            maptype="china",
        )
        # Global configuration item
        .set_global_opts(
        # Set title
        title_opts=opts.TitleOpts(title="map of China"),
        # Set standard display
        visualmap_opts=opts.VisualMapOpts(max_=1000, is_piecewise=False),
        )
        # Series configuration item
        # Turn off label name display
        .set_series_opts(label_opts=opts.LabelOpts(is_show=False))
        # Generate local html file
        .render("map of China.html")
    )
You can see that the name of the province is not displayed.
⑥ Color settings: label color, area color, border color
Add the color = "bull" parameter to the label in the series configuration item to set the label color to blue.
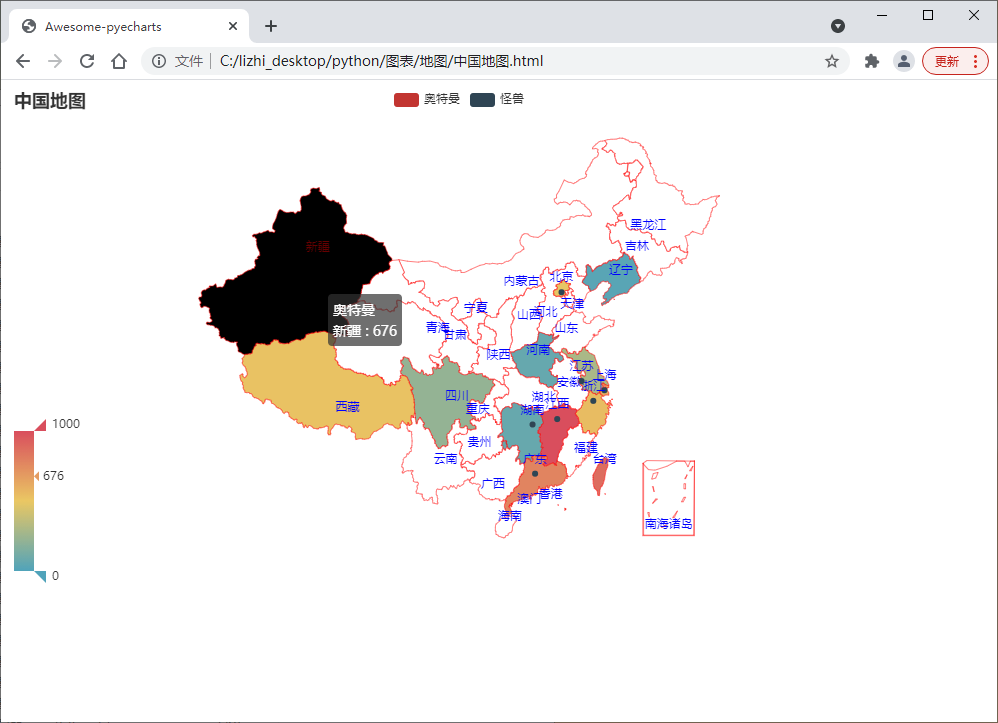
The areaColor of the element style configuration is the area color, and the borderColor is the border color,
Where normal is in normal mode and emphasis is in emphasis mode, that is, the display when the mouse moves to the area.
# Element style configuration
itemstyle_opts={
    # General display
    "normal": {"areaColor": "white", "borderColor": "red"},
    # Accent color
    "emphasis": {"areaColor": "rgba(0,0,0,1)"}
}
You can see that when I move the mouse to Xinjiang, the black color set for me is displayed, and the transparency is 1.
def create_china_map():
    '''
     Function: generate map of China
    '''
    (
        Map()
        .add(
            series_name="Ultraman",
            data_pair=ultraman,
            maptype="china",
            # Whether it is selected by default. The default value is True
            is_selected=True,
            # Whether to enable mouse wheel scaling and drag panning. The default is True
            is_roam=True,
            # Whether to display graphic markers. The default is True
            is_map_symbol_show=False,
            # Element style configuration
            itemstyle_opts={
                # General display
                "normal": {"areaColor": "white", "borderColor": "red"},
                # Accent color
                "emphasis": {"areaColor": "rgba(0,0,0,1)"}
            }
        )
        .add(
            series_name="Monster",
            data_pair=monster,
            maptype="china",
        )
        # Global configuration item
        .set_global_opts(
            # Set title
            title_opts=opts.TitleOpts(title="map of China"),
            # Set standard display
            visualmap_opts=opts.VisualMapOpts(max_=1000, is_piecewise=False)
        )
        # Series configuration item
        .set_series_opts(
            # The label name is displayed. The default value is True
            label_opts=opts.LabelOpts(is_show=True, color="blue")
        )
        # Generate local html file
        .render("map of China.html")
    )
Like a little like ❤ Come on!