Welcome to your attention Column "pandas_alive Mapping Contest" , continuously updating
Welcome to your attention Column "pandas_alive Mapping Contest" , continuously updating
Resource file download:
Column Learning Instructions (Configured venv Virtual Environment + Ready-to-Use Test Code + Test Dataset + Parameter api parsing)
All Effects Preview:
Effect Graphics Display (Configured venv Virtual Environment + Ready-to-Use Test Code + Test Dataset + Parameter api parsing)
Environment Configuration:
Environment Configuration and Detection (Configured venv Virtual Environment + Ready-to-Use Test Code + Test Dataset + Parameter api Resolution)
1. Bar chart
Bar chart API description:
df.fillna(0).plot_animated('1.horizontal bar.gif', period_fmt='%Y-%m-%d'),
title='Find you've gone far - 1. Horizontal Bar', fixed_max=True,
fixed_order=True)
Df. Fillna(0). Plot_ Animated (parameter 1, period_fmt='%Y-%m-%d'),
title='Find you've gone far - 1. Horizontal Bar', fixed_max=True,
fixed_order=True)
- Parameter 1 generates the picture name. gif
period_fmt="%Y-%m-%d %H:%M:%S"
Format to 2022-01-12 5:30:00, optionally omit the default to indicate that the formatting time output is in the lower right corner of the picture
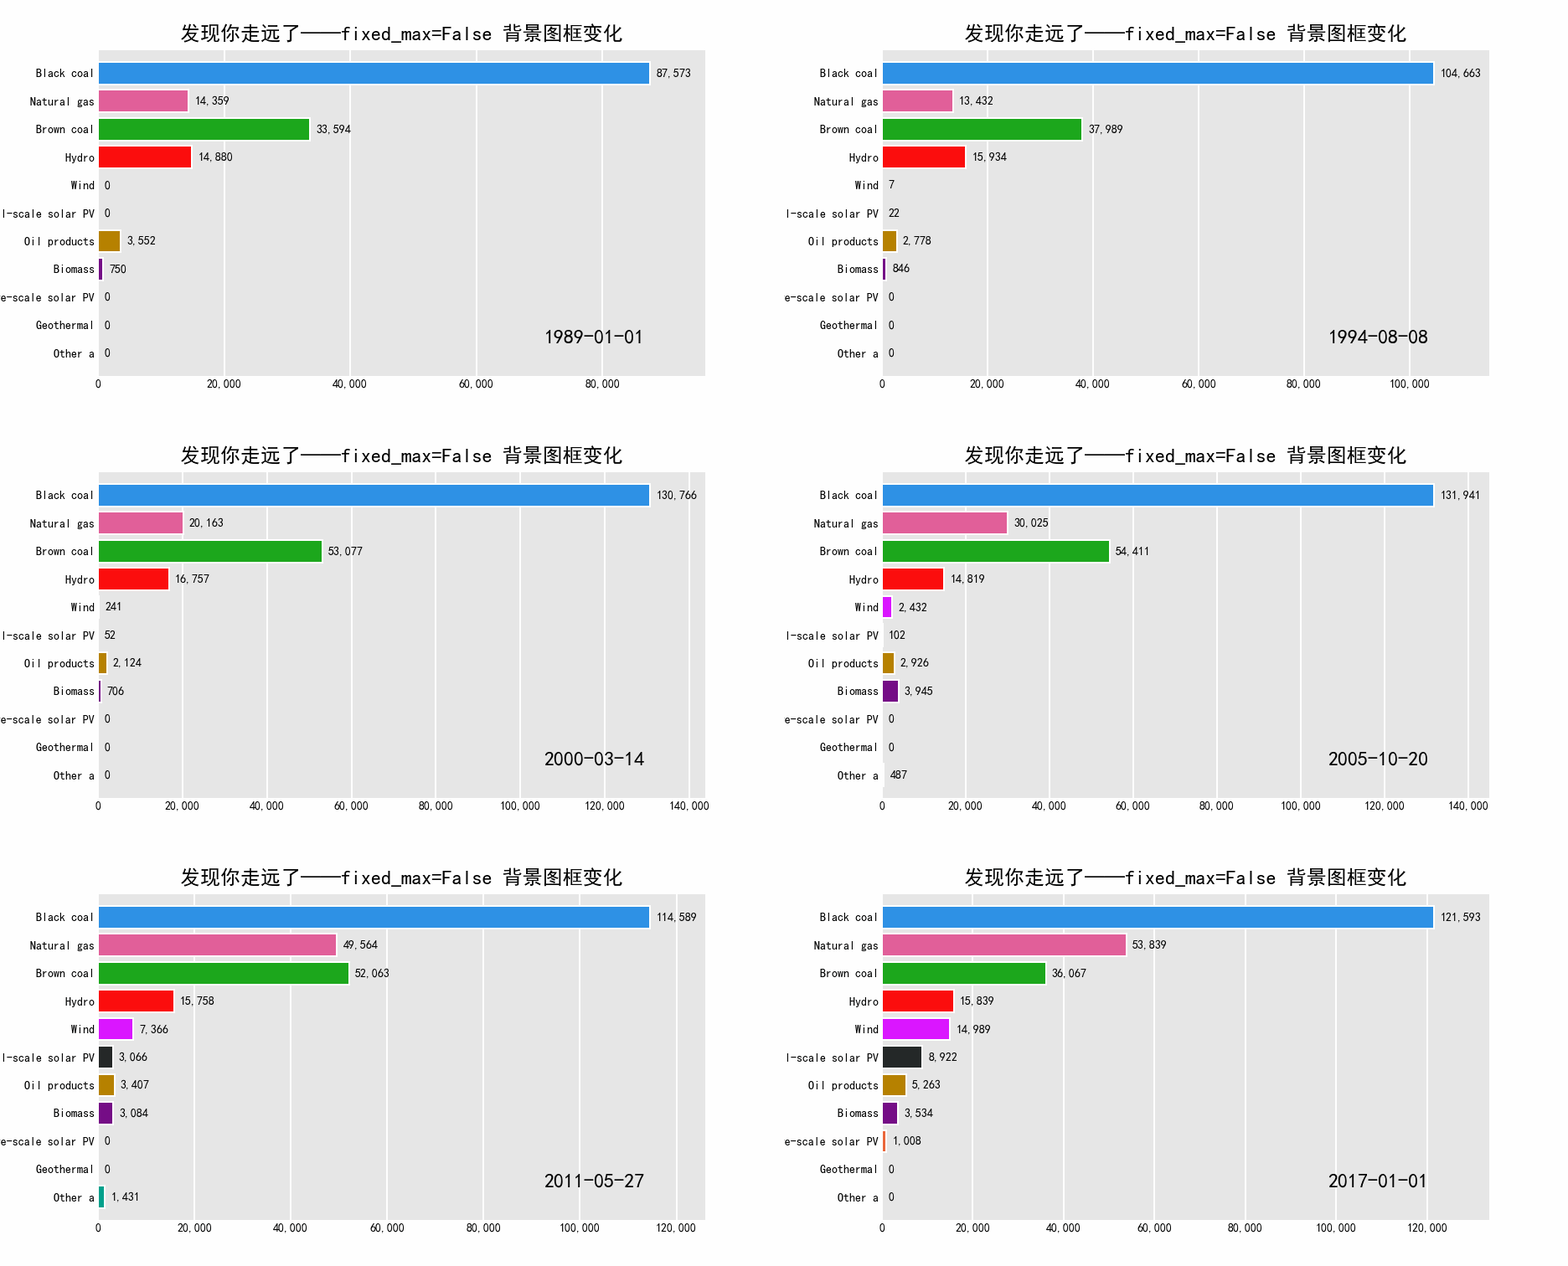
Fixed_ Does Max fix the background bar in the background image
True Fixed Background Bar
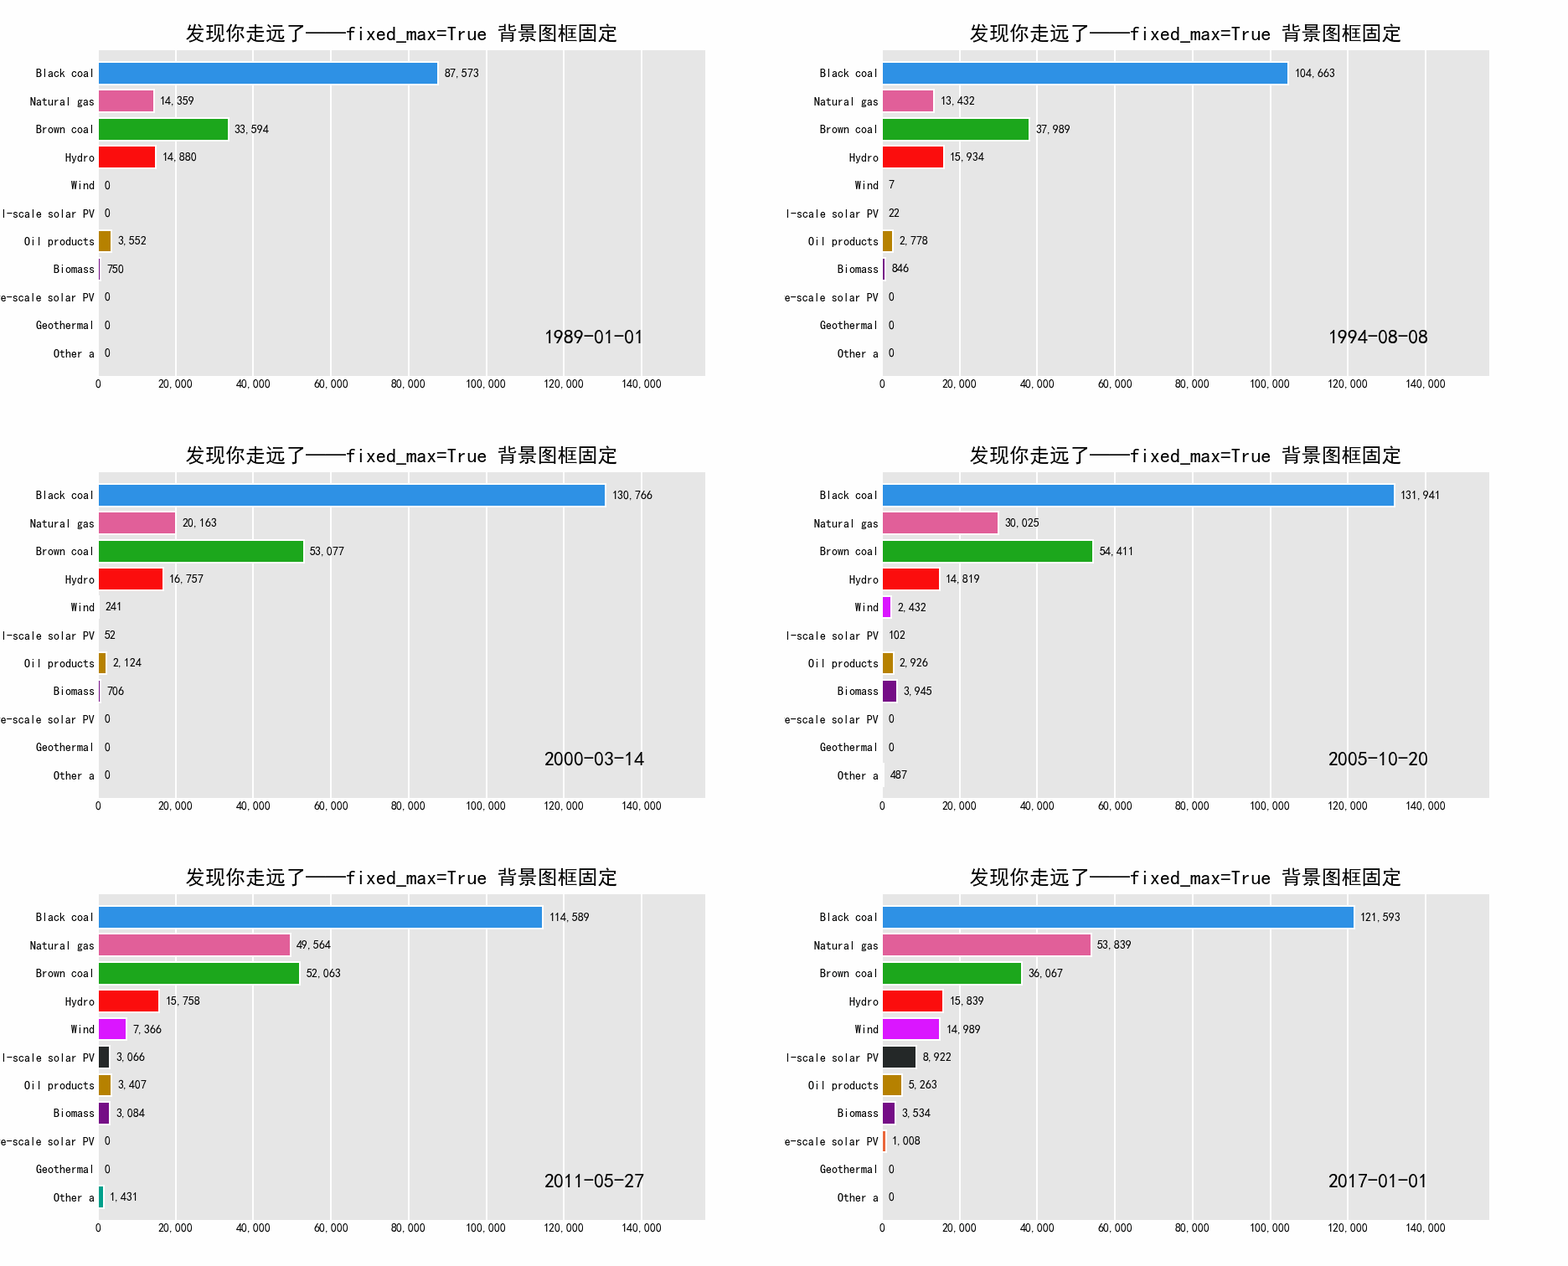
false does not fix the background bar in the background image
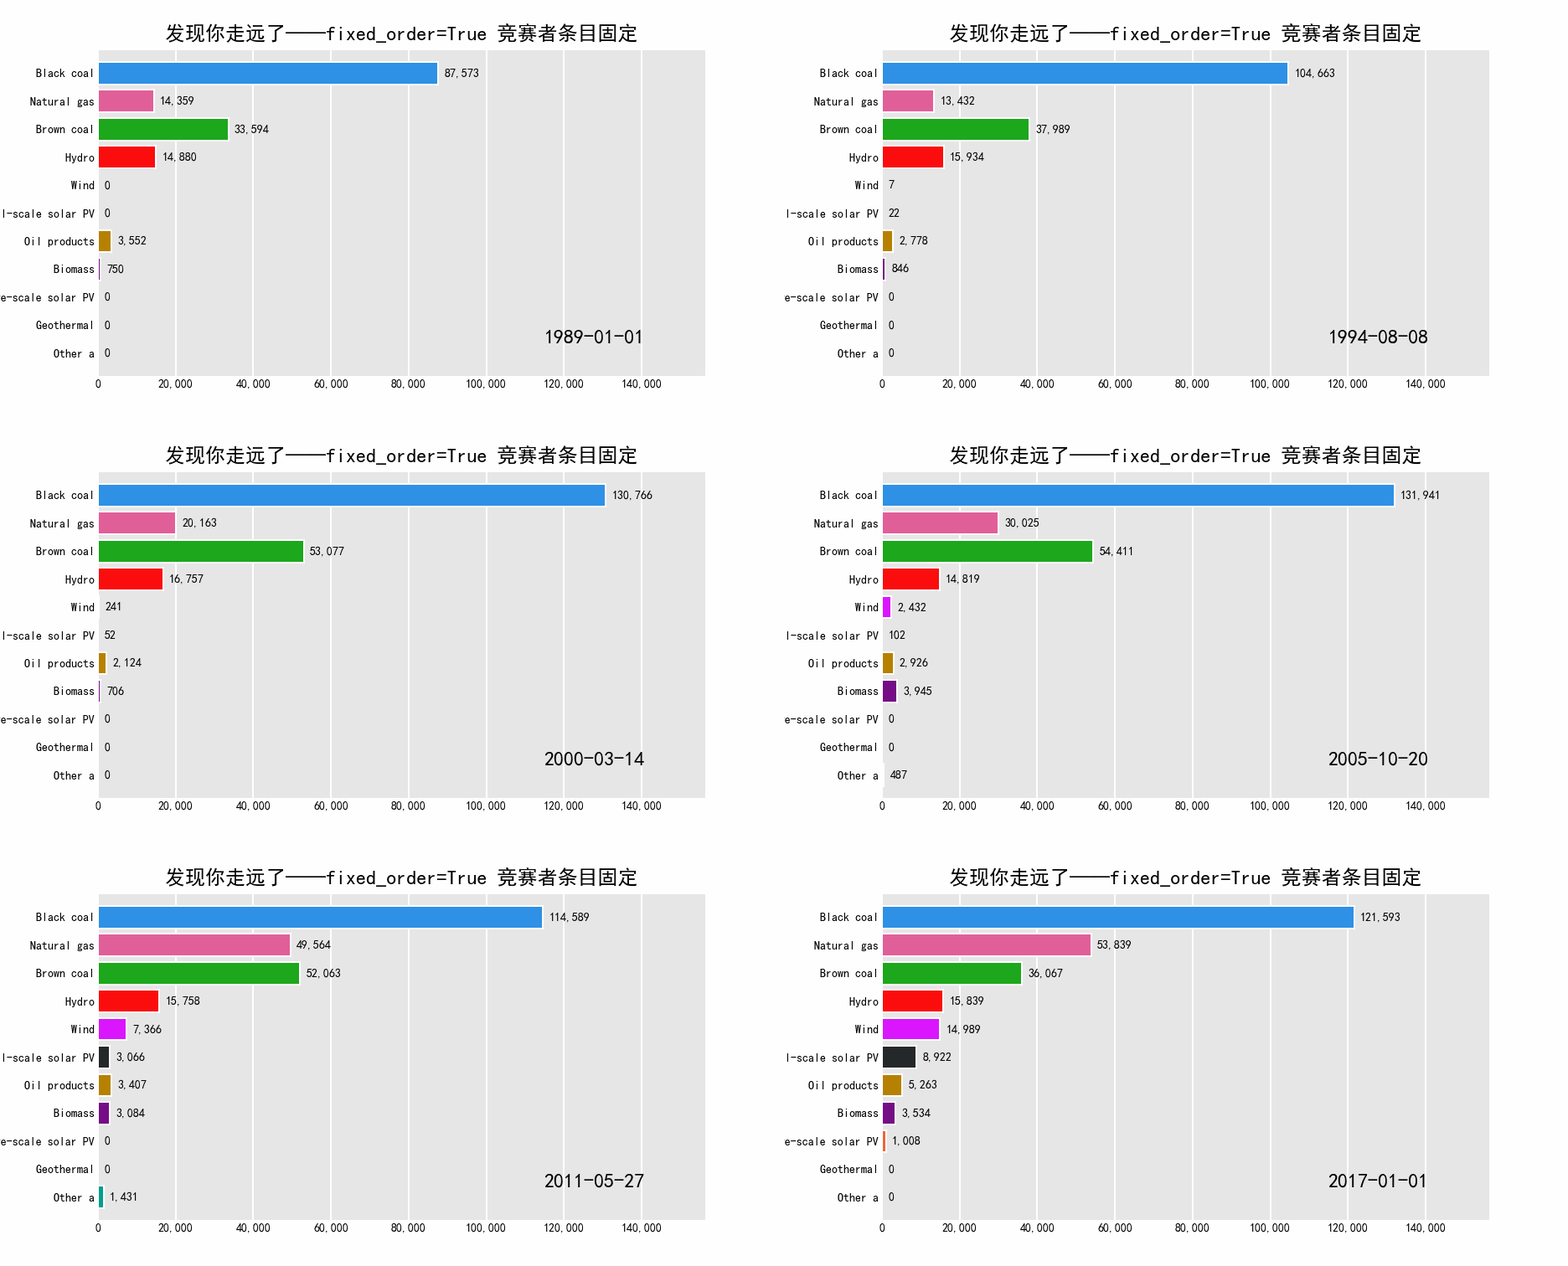
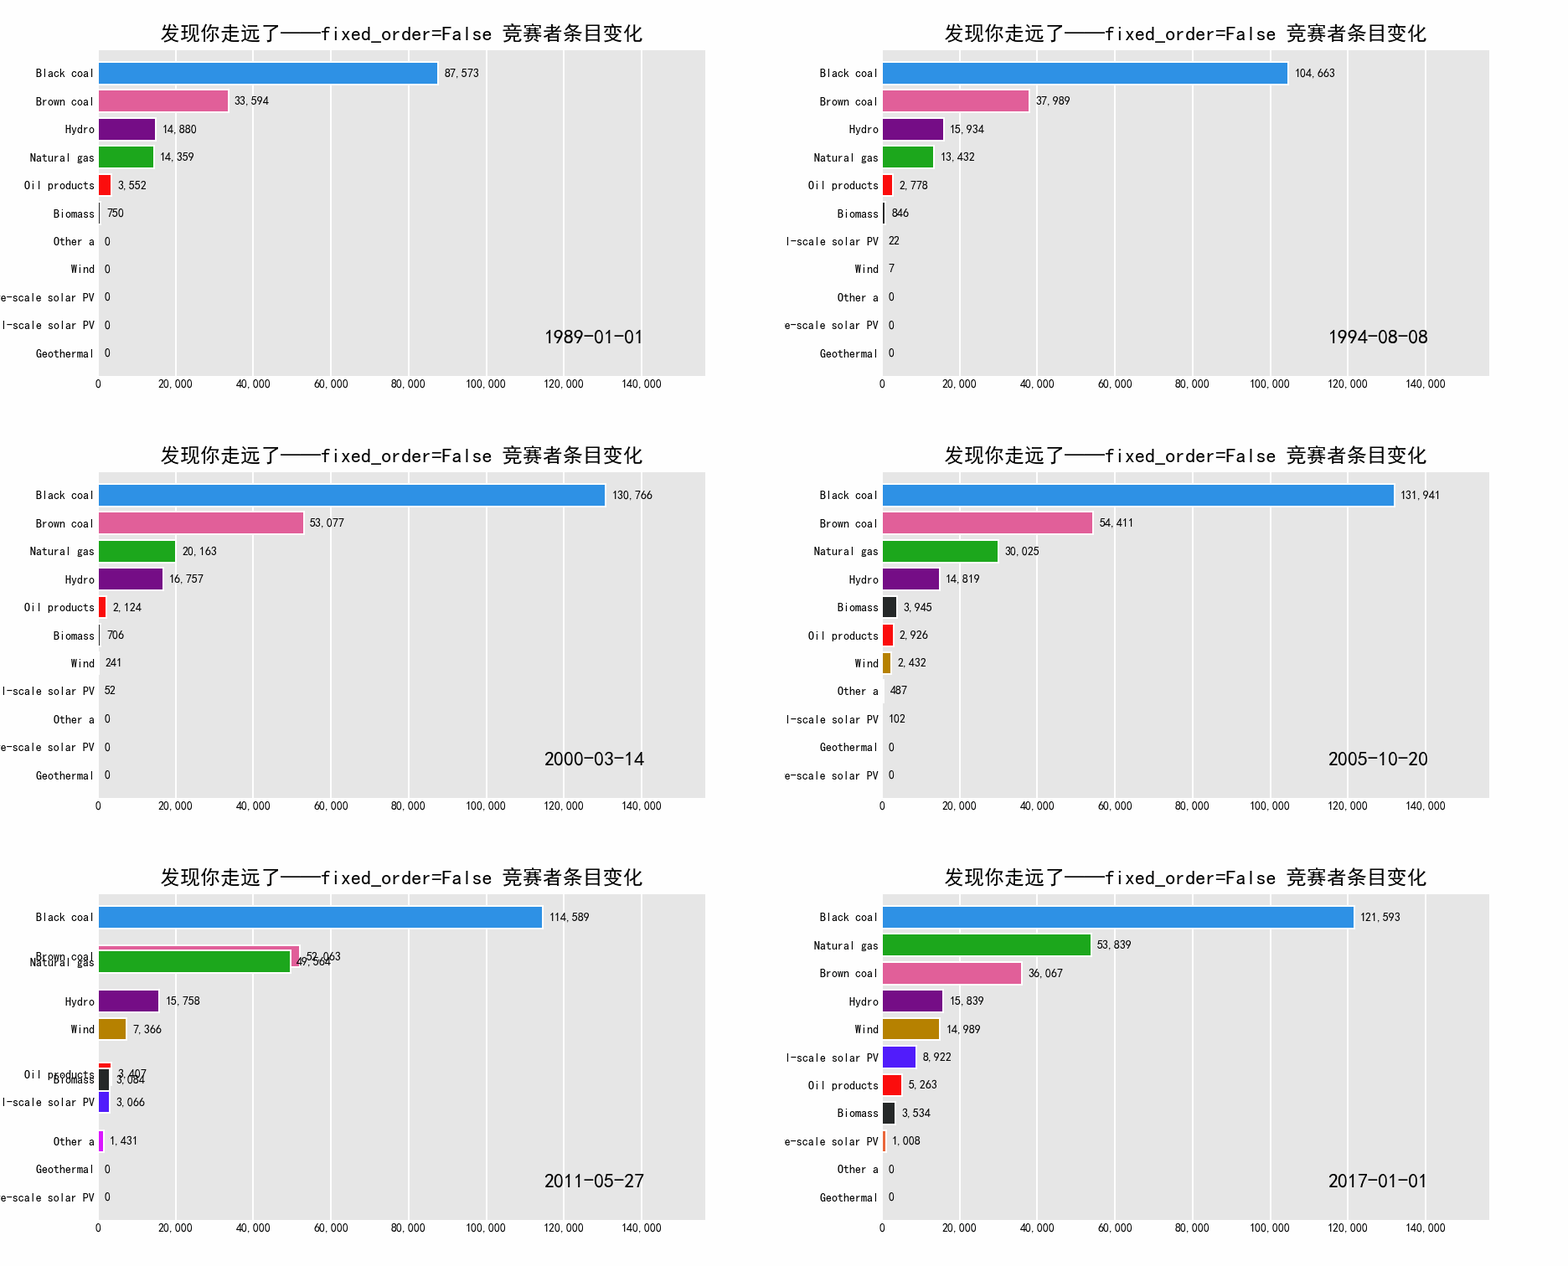
Fixed_ Whether order fixes competitor entries or not means whether the ranks of individual competitors will change
- True Fixed Competitor Entry
- false Fixed Competitor Entry
orientation='h'
orientation='v'
Is the direction of the bar graph horizontal or vertical
- h level (default)
- v Vertical
perpendicular_bar_func='max'
Add a shaded section of all data to assist viewing
- max shadow part value is maximum
- mean shaded part value is average
- min Shadow part value is minimum
Bar Chart Dataset
Save as file Aus_Elec_Gen_1980_2018.csv usage, recommended download via code cloud
,  Black coal,  Brown coal,  Natural gas,  Oil products,  Other a,  Biomass,  Wind,  Hydro,Large-scale solar PV,  Small-scale solar PV,  Geothermal
1989,87573.00,33594.00,14359.00,3552.00,,750.00,,14880.00,,,
1990,89511.00,36048.00,10772.00,3396.00,,769.00,,16103.00,,,
1991,94325.10,34559.00,11633.00,2362.00,,670.00,,15768.00,,10.90,
1992,97872.70,33248.00,12295.00,2421.00,,670.00,,16953.00,,13.30,
1993,100544.10,34890.00,12199.00,2320.00,,670.00,4.00,16649.00,,15.90,
1994,102522.10,35832.00,14913.00,2738.00,,723.00,7.00,16239.00,,18.90,
1995,106089.60,39427.00,12445.00,2805.00,,928.00,7.00,15731.00,,23.40,
1996,109452.20,41893.00,11426.00,2175.00,,965.00,7.00,16852.00,,27.80,
1997,116969.50,46633.00,12934.00,1821.00,,1029.00,8.00,15733.00,,33.50,
1998,118586.30,49703.00,16001.00,1729.00,,1133.00,28.00,16563.00,,37.70,
1999,123833.50,50200.00,16245.00,1784.00,,1134.00,58.00,16720.00,,43.50,
2000,134264.00,52223.00,17271.00,2044.00,,645.00,210.00,16933.00,,50.00,
2001,116774.70,56493.00,31730.00,2446.00,,950.00,364.00,16054.00,,58.30,
2002,115296.60,55160.30,29375.30,1661.00,1792.20,1583.60,703.10,16490.00,,58.30,
2003,121182.30,55572.80,30919.40,1388.70,1817.00,1799.50,705.00,16331.10,,68.10,0.50
2004,127788.50,53377.80,23802.90,2841.00,434.00,3830.00,885.00,15612.20,,77.80,0.50
2005,130231.60,54552.80,22725.90,3058.00,517.00,3911.00,1713.10,16029.20,,90.30,0.50
2006,132368.50,54375.80,31849.90,2893.00,479.00,3953.00,2611.10,14517.00,,104.70,0.50
2007,129569.30,54658.70,34955.80,4058.00,106.00,4596.00,3093.10,12056.90,,122.80,0.50
2008,127270.50,56981.40,37660.40,3388.00,3579.90,2795.20,3823.80,11869.40,,155.60,0.50
2009,123724.50,56068.30,44585.40,3106.80,2991.00,2777.40,5051.70,13548.70,,424.90,0.50
2010,116948.80,55298.10,48996.20,3093.80,2716.10,2101.70,6084.90,16806.70,,1530.40,0.50
2011,116654.40,55067.70,48571.60,2702.50,1088.10,3043.75,6969.70,14083.30,,2558.70,0.50
2012,111491.10,47555.10,51053.40,4464.30,1945.30,3143.50,7959.60,18269.60,,3826.30,0.50
2013,106965.50,46076.20,54393.90,5012.40,,3499.39,10252.00,18421.00,49.68,4366.28,0.50
2014,107639.40,50970.30,52916.91,6828.45,,3592.23,11466.60,13445.00,107.22,5424.11,0.60
2015,114294.98,48795.86,50536.08,5655.62,,3789.89,12199.50,15318.18,457.21,6381.05,0.22
2016,118272.30,43557.76,50459.75,5272.59,,3500.55,12596.99,16284.89,672.40,7399.26,0.50
2017,121592.60,36067.00,53839.39,5262.60,,3534.09,14989.42,15838.82,1007.58,8922.36,
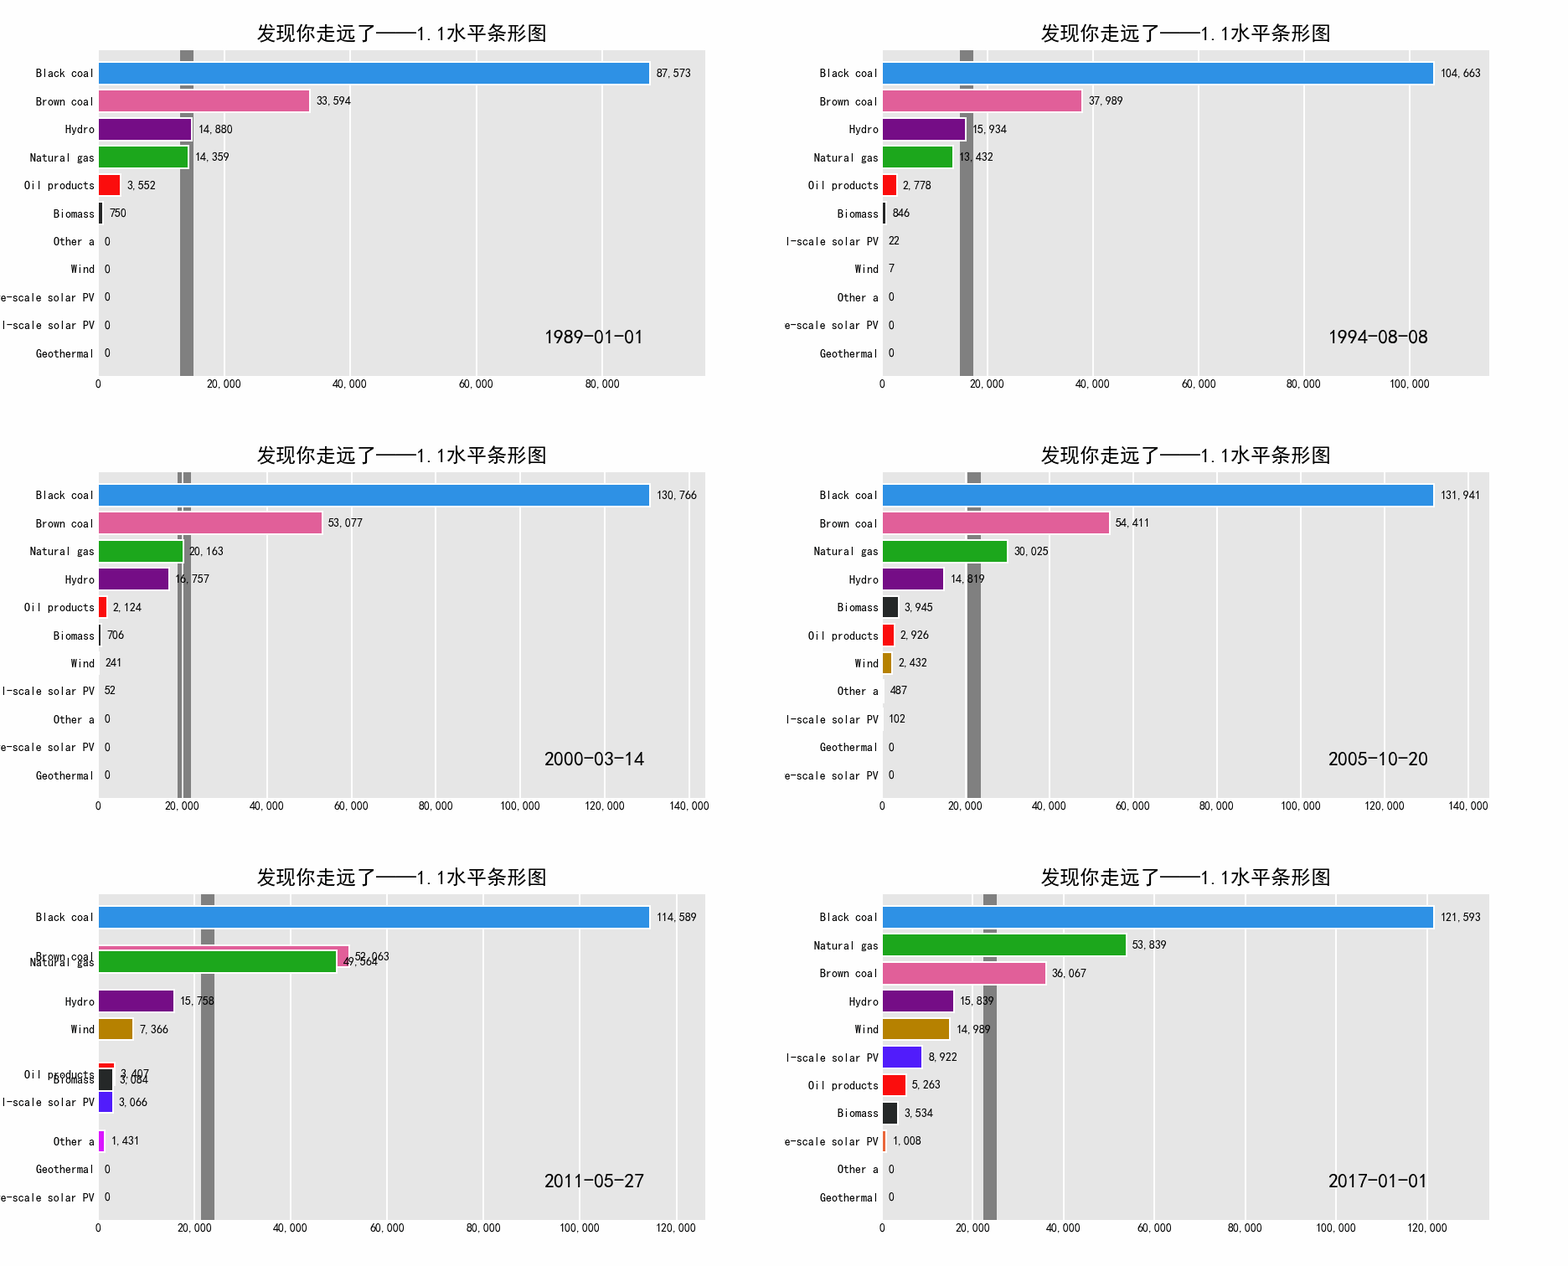
1.1 Horizontal Bar Routine
# @Time    : 2022/1/12 11:46
# @Author: Nanli
# @FileName: 1.1 horizontal bar. py
import pandas as pd
import pandas_alive

######Show Chinese Song font import, if using Chinese plus this code######
import matplotlib as plt

plt.rcParams['font.sans-serif'] = ['SimHei']
plt.rcParams['axes.unicode_minus'] = False
#####################################################

df = pd.read_csv("data source data/Aus_Elec_Gen_1980_2018.csv", index_col=0, parse_dates=[0], thousands=',')

df.fillna(0).plot_animated('1.1 Horizontal Bar Graph.gif', period_fmt="%Y-%m-%d",
                           title='Find you're far away - 1.1 Horizontal Bar Graph', fixed_max=False,
                           perpendicular_bar_func='mean',
                           fixed_order=False)
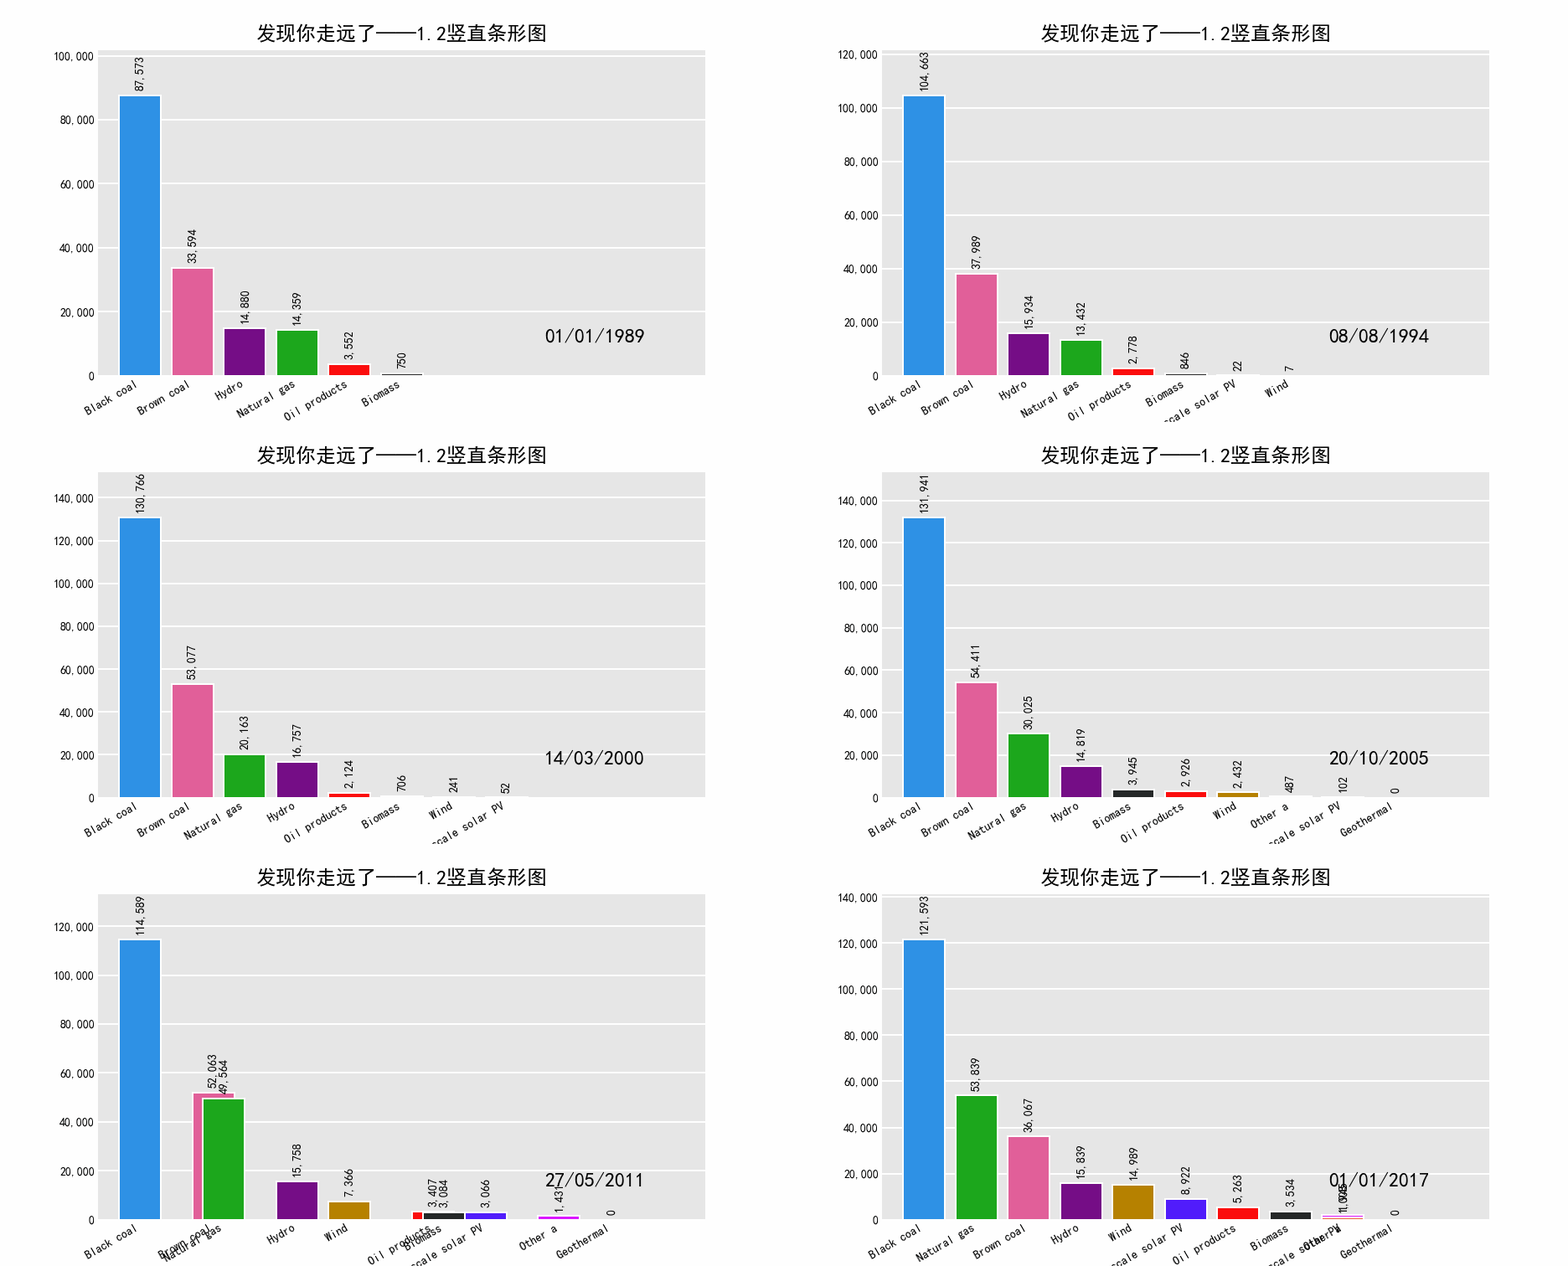
1.2 Vertical bar routine
# @Time    : 2022/1/12 13:24
# @Author: Nanli
# @FileName: 1.2 vertical bar chart. py
import pandas_alive
import pandas as pd

######Show Chinese Song font import, if using Chinese plus this code######
import matplotlib as plt

plt.rcParams['font.sans-serif'] = ['SimHei']
plt.rcParams['axes.unicode_minus'] = False
#####################################################

df = pd.read_csv("data source data/Aus_Elec_Gen_1980_2018.csv", index_col=0, parse_dates=[0], thousands=',')

df.plot_animated(filename='1.2 Vertical bar chart.gif', title='Find you're far away - 1.2 Vertical bar chart',perpendicular_bar_func='min', orientation='v')
summary
Copyright Statement:
Found that you are far away from the original @mzh work, reprinting must label the original link
Copyright 2022 mzh
Crated: 2022-1-13
I've been working around for a week, combing out a lot of ways to get started with small white lightning protection, and will continue to update, if you see it helpful, I hope you will get some approval 👍 Collection support! (After all, it's too difficult to finish in a short time, so I suggest putting it in my favorite folder to gray up)
Welcome to your attention Column "pandas_alive Mapping Contest" , continuously updating
Welcome to your attention Column "pandas_alive Mapping Contest" , continuously updating
[1. Effect Diagram Display (Configured venv Virtual Environment + Ready-to-Use Test Code + Test Dataset + Parameter api Resolution)]
[2. Column Learning Instructions (Configured venv Virtual Environment + Ready-to-Use Test Code + Test Dataset + Parameter api Resolution)]
[3. Environment Configuration and Detection (Configured venv Virtual Environment + Ready-to-Use Test Code + Test Dataset + Parameter api Resolution)]
[4. Data Set Description (Configured venv Virtual Environment + Ready-to-Use Test Code + Test Dataset + Parameter api Resolution)]
[5. Frequently asked questions (configured venv virtual environment + fetch-and-play test code + test dataset + parameter api parsing)]
[1. Bar Chart (Test Code + Dataset + Drawing Parameter Resolution)]
[2. Line Diagram (Test Code + Dataset + Drawing Parameter Analysis)]
[3. Scatter Chart (Test Code + Dataset + Drawing Parameter Analysis)]
[4. Pie chart (test code + dataset + drawing parameter resolution)]
[5. Bubble Chart (Test Code + Dataset + Drawing Parameter Analysis)]
[6. Geospatial Map (Test Code + Dataset + Drawing Parameter Analysis)]
[7. Multiple Charts (Test Code + Dataset + Drawing Parameter Resolution)]
[8. Urban Population (Test Code + Dataset + Drawing Parameter Analysis)]
[Life expectancy in 9.G7 countries (test code + dataset + plotting parameter analysis)]
[10. New South Wales COVID Visualization (Test Code + Dataset + Drawing Parameter Analysis)]
[Expect more]