Above
Last time I explained the construction details of plg log system for a single application server. Now I'll explain the configuration of application cluster.
Establishment of Promtail + Loki + Grafana log monitoring system
Environment and preparation
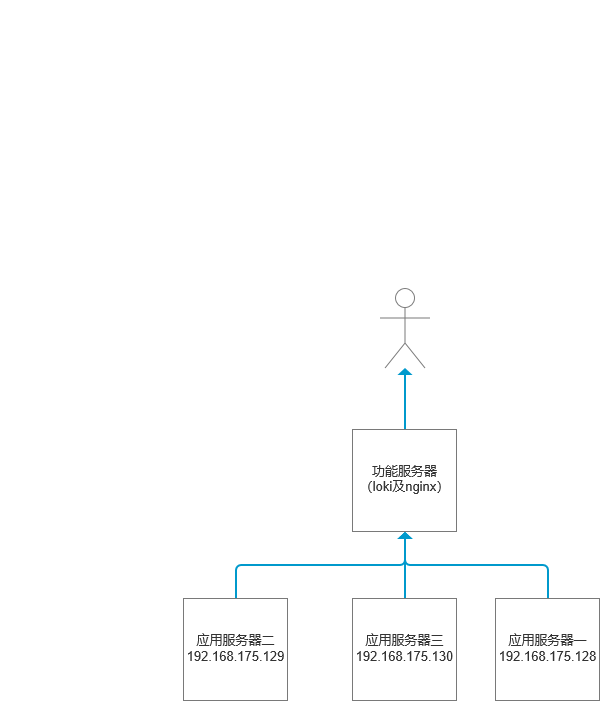
Four virtual machines, the system is CentOS 8, and the overall framework diagram is
Start building
For the configuration types of three application servers, I take one as an example, and the other two refer to these two
Java configuration
centos is pre installed with JAVA8, which can be skipped. If you use other versions of the system, you can install jdk yourself.
Java application deployment
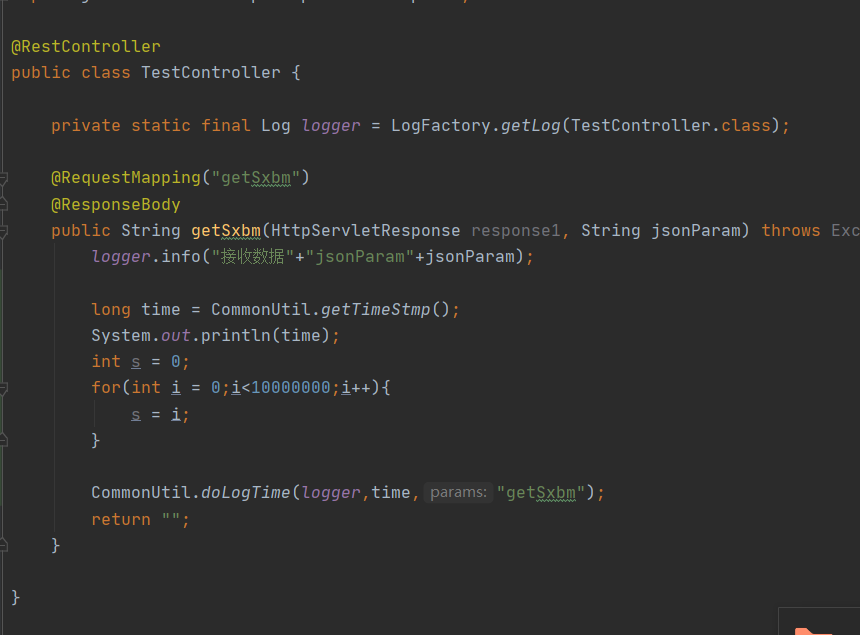
The springBoot project is built as an application service. A method is reserved for later function verification. This method is mainly in two aspects. The first log records the call and the second log records the time-consuming. This will be used in subsequent log monitoring.
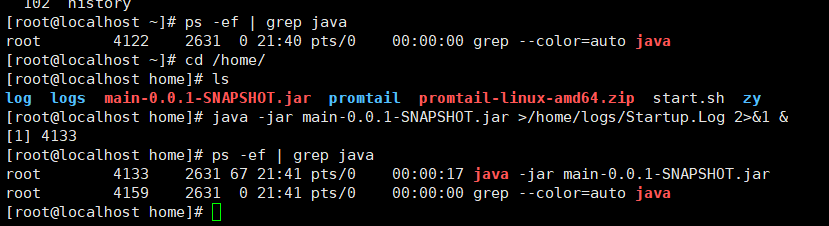
 Package the project into a jar package, upload it to the home path of the application server, and start it with the following command. Since this is just for demonstration, parameters such as running memory are not added. If you are interested, you can study them yourself.
java -jar main-0.0.1-SNAPSHOT.jar >/home/logs/Startup.Log 2>&1 &
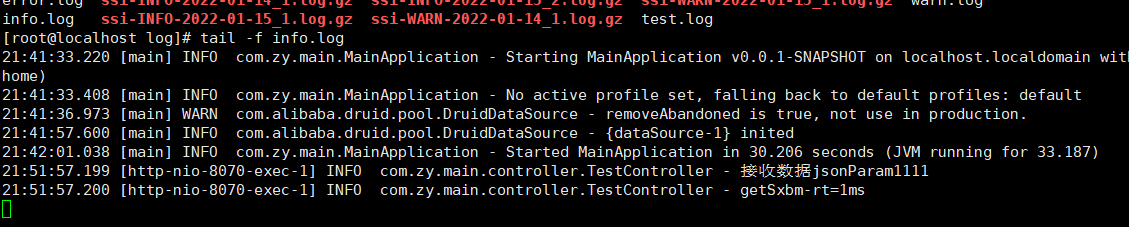
The log directory of the project is located in / home / log / info Log, open the log and call the log. At this time, the call is normal. Application deployment completed
Refer to the previously deployed tutorial to deploy prommail. However, the configuration of prommail has changed. The job tag before modification has been changed into the host tag to distinguish different hosts. Start prommail. Refer to the previous blog for the command
server:
  http_listen_port: 9080
  grpc_listen_port: 0

positions:
  filename: /tmp/positions.yaml

clients:
  - url: http://192.168.175.131:3100/loki/api/v1/push

scrape_configs:
- job_name: info
  static_configs:
  - targets:
      - localhost
    labels:
      host: 192.168.175.128
      __path__: /home/log/info.log
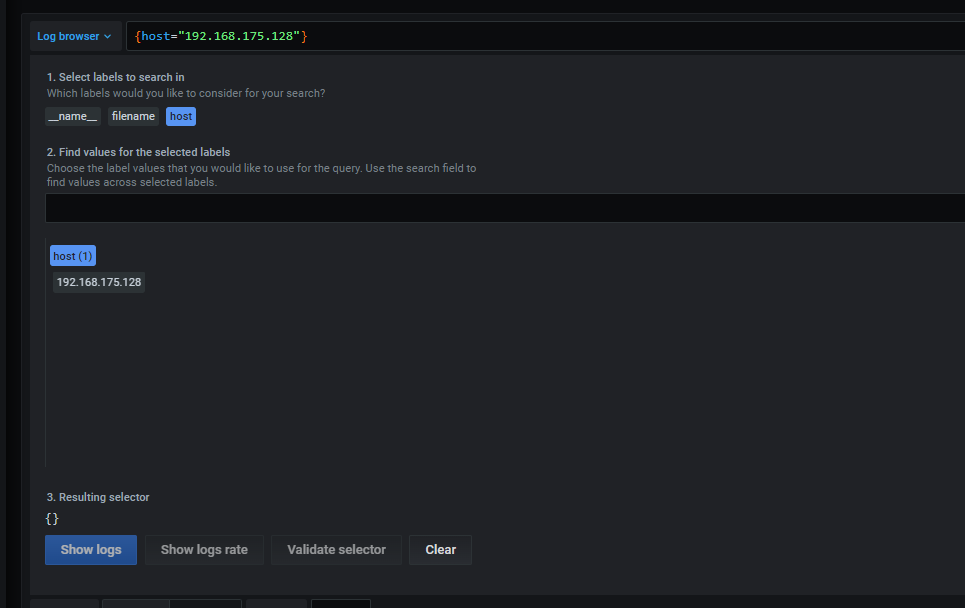
After configuration, you can find the newly configured host in grafana
Follow this step to configure and deploy the other two application servers. Note that prommail needs to be deployed for each server. After the configuration is completed, the three host s just configured will appear in the label of grafana
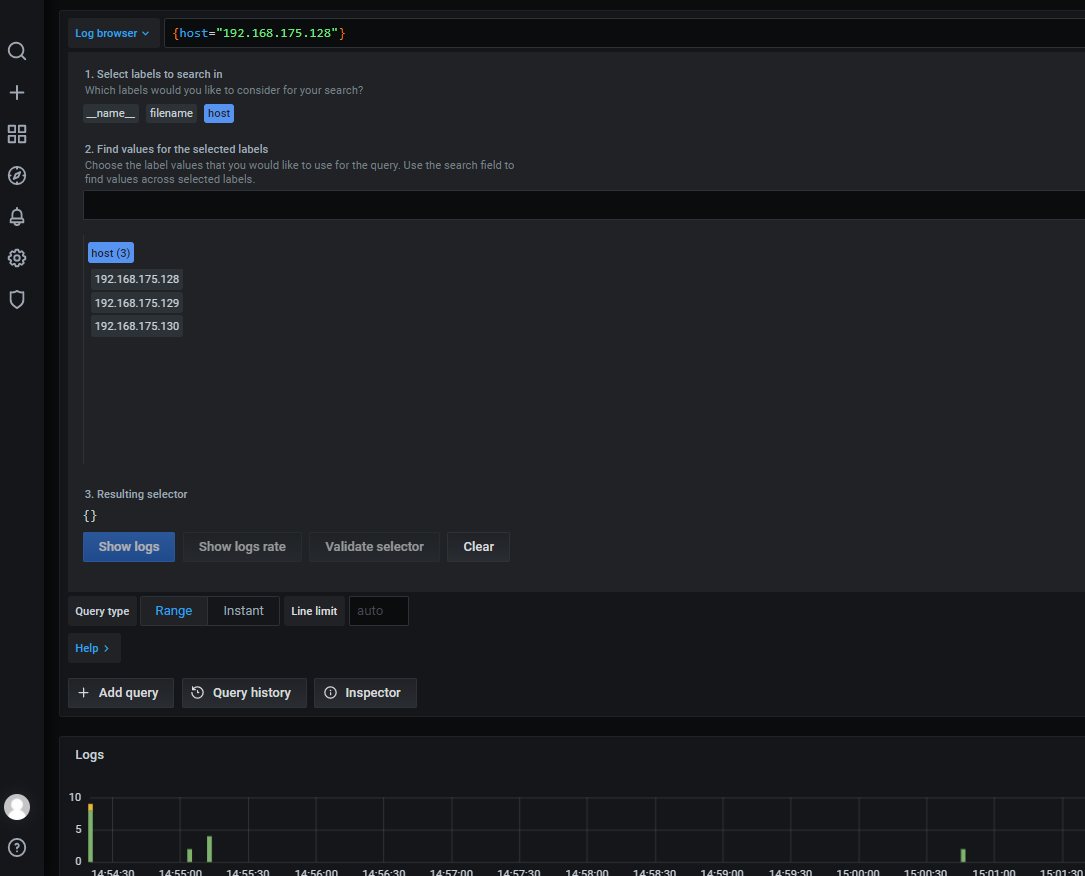
At this time, the log monitoring of three servers is completed. Strictly speaking, it can not be regarded as a cluster, but only multiple servers. Let's start the cluster configuration. Implemented with nginx
nginx configuring load balancing
CentOS 8 has installed nginx service by default. We only need to modify the configuration of nginx to achieve load balancing. The nginx configuration file under the default installation is in / etc/nginx. Enter this directory and modify the relevant configuration
user  nginx;
worker_processes  1;

error_log  /var/log/nginx/error.log warn;
pid        /var/run/nginx.pid;


events {
    worker_connections  1024;
}


http {
    include       /etc/nginx/mime.types;
    default_type  application/octet-stream;

    log_format  main  '$remote_addr - $remote_user [$time_local] "$request" '
                      '$status $body_bytes_sent "$http_referer" '
                      '"$http_user_agent" "$http_x_forwarded_for"';

    access_log  /var/log/nginx/access.log  main;

    sendfile        on;
    #tcp_nopush     on;

    keepalive_timeout  65;
	#Corresponding to the three servers just configured
    #gzip  on;
    upstream test.miaohr.com {
	server 192.168.175.128:8070;
	server 192.168.175.129:8070;
	server 192.168.175.130:8070;
    }


    server {
        listen       80;
        server_name  test.miaohr.com;
        charset utf-8;
        location / {
            root   html;
            index  index.html index.htm;
            proxy_pass        http://test.miaohr.com;
            proxy_set_header  X-Real-IP  $remote_addr;
            client_max_body_size  100m;
        }


    }
}
When the configuration is complete, start nginx. There are many modes of nginx load balancing. This time, the default is the time slice polling mechanism in the default state.
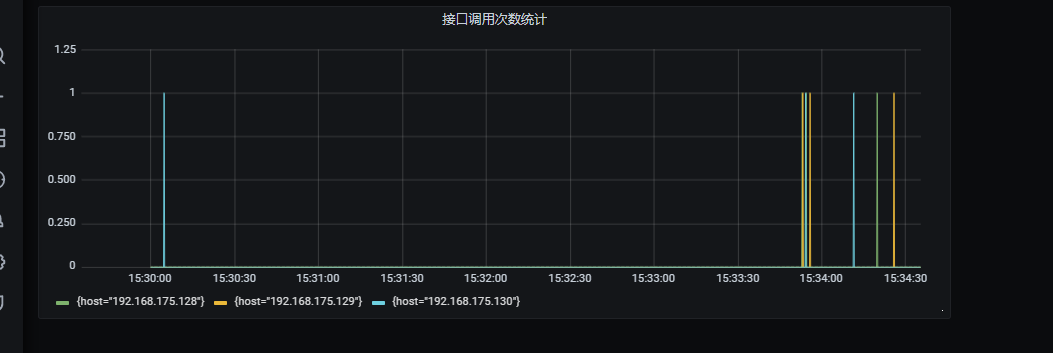
Now, visit http://192.168.175.131/getSxbm You can access a random one of the three application server nodes. In order to more directly reflect this effect, we configure a visual page to observe it through grafana
After calling this interface several seconds apart, it is found that three requests have been made to different machines. The simple version of load balancing is completed.
Pit avoidance point
- CentOS 8 needs to open the port or, more simply, close the firewall systemctl disable firewalld Restart after the service is closed
- If nginx configuration does not take effect, you can view the log under / var/log/nginx. The problem I encountered is that the configured node address has been unable to access the past log. Prompt to solve nginx's 13: Permission denied) while connecting to upstream
- Solution`
- 1. Turn off SeLinux
1. Temporary shutdown (without restarting the machine):
Setenforce0 ## sets SELinux to permissive mode
##setenforce 1 set SELinux to enforcing mode
2. To modify the configuration file, restart the machine:
Modify the / etc/selinux/config file
Change SELINUX=enforcing to SELINUX=disabled
Just restart the machine
2. Execute the following command
setsebool -P httpd_can_network_connect 1`
Pro test available.
summary
The principle of plg mode log monitoring system is to push the logs of each node to loki server for centralized processing. For each new node, a prommail needs to be configured synchronously. This is the end of plg mode. Next time, we will build an elk mode log monitoring system.