1, Prometheus introduction
Prometheus, whose Chinese name is Prometheus, is inspired by Google's Brogmon monitoring system. It has been developed by former Google engineers in Soundcloud in the form of open source software since 2012. Version 1.0 was released in June 2016. Prometheus can be seen as an implementation of Google's internal monitoring system Borgmon.
The following figure illustrates the architecture of Prometheus and some of its ecosystem components. Alertmanager is used for alarm and Grafana is used for monitoring data visualization, which will be mentioned later in the article.
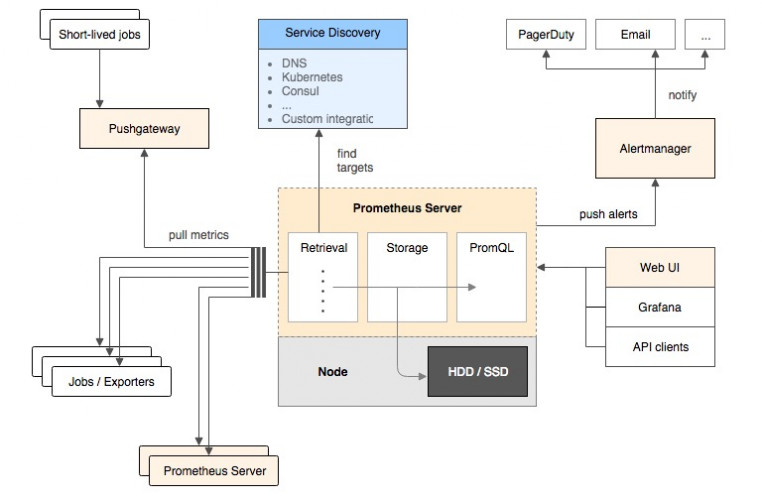
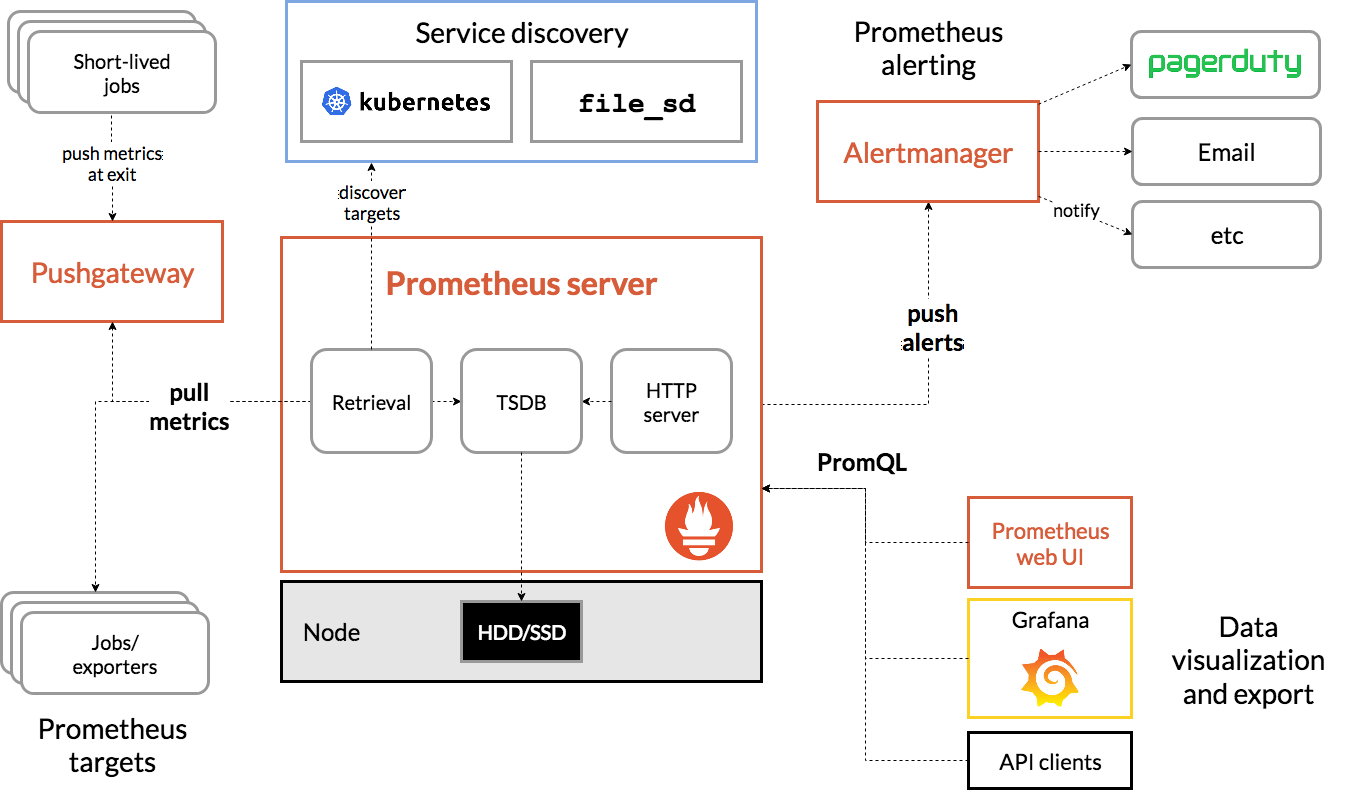
Here we can learn the characteristics of Prometheus:
1.A data collector that passes periodically at configured intervals HTTP Extract indicator data.
2.A time series database for storing all indicator data.
3.A simple user interface where you can visualize, query and monitor all indicators.
2, Introduction to Grafana
Grafana is an open source application written in go language, which allows you to obtain data from various data sources such as Elasticsearch, Prometheus, Graphite and InfluxDB, and visualize it through exquisite graphics.
In addition to Prometheus AlertManager sending alarms, grafana also supports alarms. Grafana can seamlessly define the position of the alarm in the data, visually define the threshold, and obtain the alarm notification through nailing, email and other platforms. The most important thing is to intuitively define alarm rules, continuously evaluate and send notifications.
Since the Grafana alert alarm is relatively weak, most alarms are sent through Prometheus alert manager
Note that the Prometheus dashboard also has simple graphics. But Grafana's graphics are much better.
3, Introduction to Alertmananger
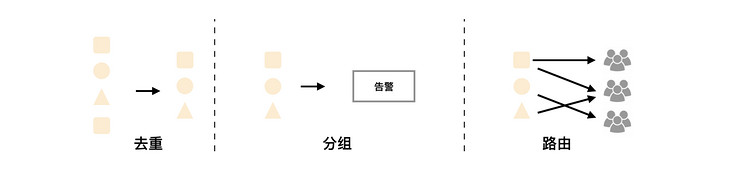
In addition to collecting data and storing, Prometheus monitoring platform can also customize event rules, but these event rules need to be completed in cooperation with Alertmanager component to realize alarm notification.
AlertManager supports alarm grouping (multiple alarms are sent together), alarm suppression and alarm silence (no repeated alarms are sent in the same time period).
4, Monitoring Java applications
monitor model
At present, there are two ways for the monitoring system to collect indicators, one is "push" and the other is "pull":
Push representatives include ElasticSearch, InfluxDB, OpenTSDB, etc. you need to push indicators from the program to relevant monitoring applications by using TCP, UDP, etc. if you only use TCP, once the monitoring application hangs or has a bottleneck, it is easy to have an impact on the application itself. If you use UDP, you don't have to worry about the monitoring application, but it is easy to lose data.
The main representative of La is Prometheus, so we don't have to worry about monitoring the status of the application itself. Moreover, monitoring can be automatically added by using service discovery functions such as DNS-SRV or consult.
How to monitor
The way Prometheus monitors the application is very simple. It only needs that the process exposes an HTTP access address used to obtain the current monitoring sample data. Such a program is called Exporter, and the instance of Exporter is called a Target. Prometheus regularly obtains monitoring data samples from these targets through rotation training. For applications, it only needs to expose an HTTP access address containing monitoring data. Of course, the provided data needs to meet a certain format, which is the Metrics format
metric name>{<label name>=<label value>, ...}
It is mainly divided into three parts
Each part must conform to the relevant regular expression
1.metric name: The name of the indicator mainly reflects the meaning of the monitored sample a-zA-Z_:*_
2.label name: The label reflects the characteristic dimension of the current sample [a-zA-Z0-9_]*
3.label value: The value of each label, without limiting the format
It should be noted that label value is better to use enumeration values rather than unlimited values, such as user ID, Email, etc., otherwise it will consume a lot of memory and do not meet the significance of index collection.
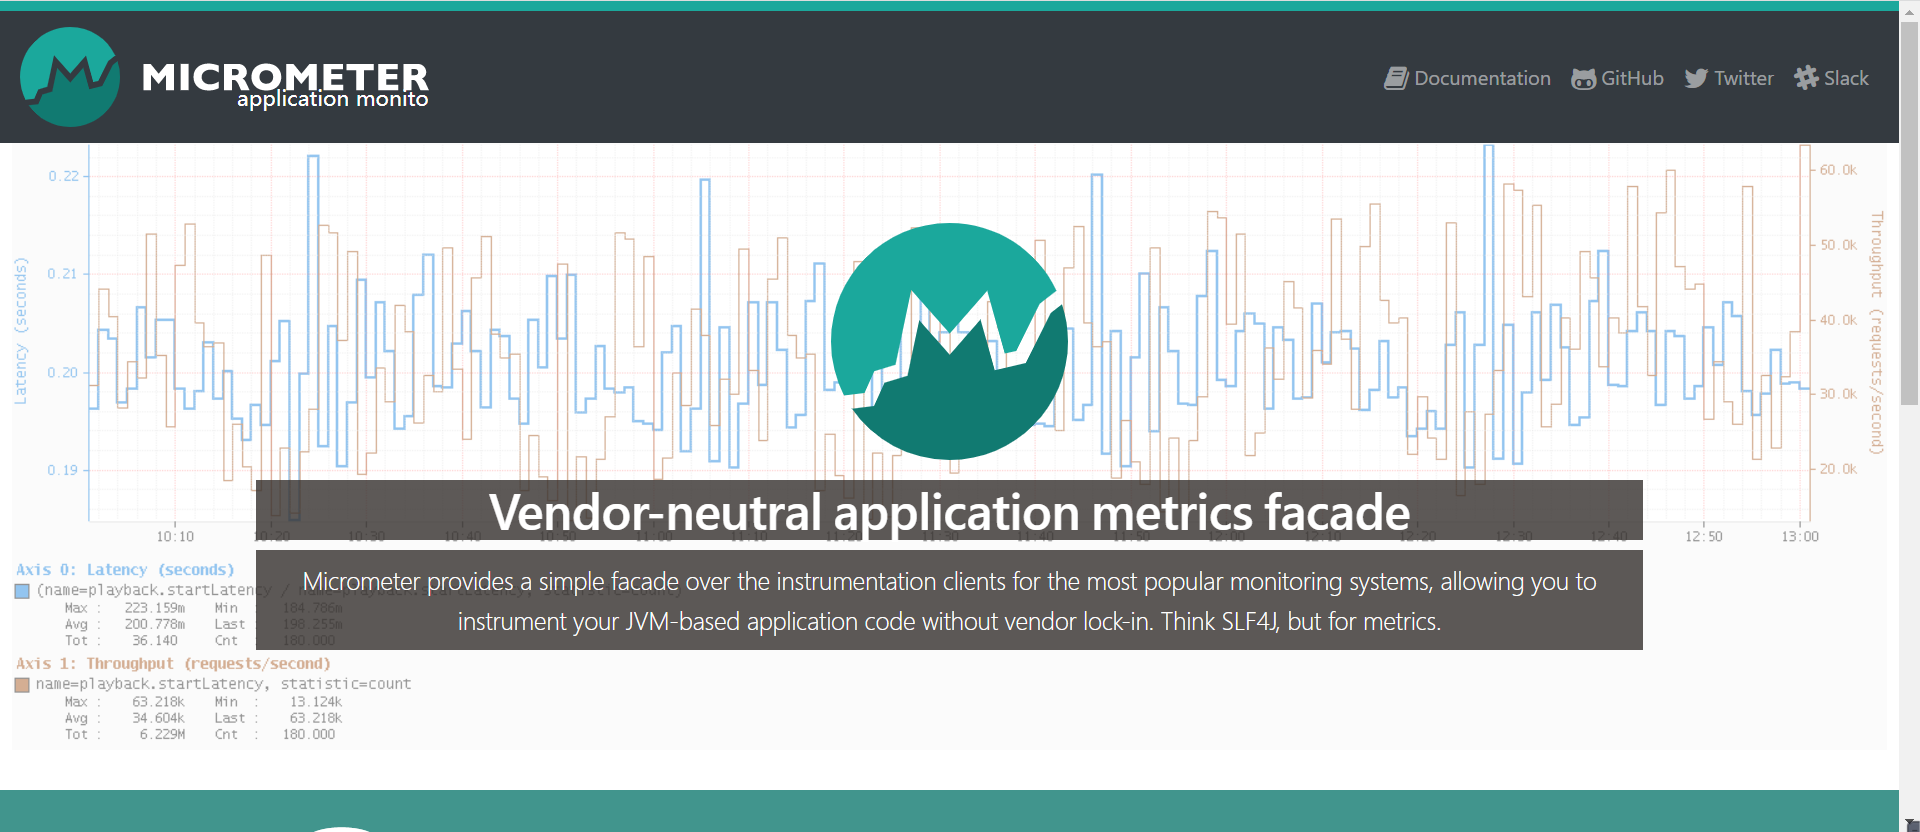
5, Introduction to MicroMeter
The principle of Prometheus monitoring was briefly described earlier. So how can our Spring Boot application provide such an HTTP access address, and the data provided must comply with the above Metrics format?
Remember, in the detailed explanation of Spring Boot Actuator module: health check, measurement, indicator collection and monitoring, I mentioned that the Actuator module can also be integrated with some external application monitoring systems, including Prometheus. So how does Spring Boot Actuator combine Spring Boot application with Prometheus monitoring system?
This bridge is micrometer. Micrometer provides a general API for performance data collection on the Java platform. Applications only need to use the general API of micrometer to collect performance indicators. Micrometer will be responsible for completing the adaptation with different monitoring systems.
6, Installation of docker Prometheus, docker grafana and server monitoring docker node exporter
Download Image package
docker pull prom/prometheus
docker pull grafana/grafana
docker pull prom/node-exporter
Preparation before prometheus startup
mkdir /opt/prometheus

touch /opt/prometheus.yml

cd /opt/prometheus

vim prometheus.yml
The prometheus configuration file is as follows
global:
  scrape_interval:     60s
  evaluation_interval: 60s

scrape_configs:
  - job_name: prometheus
    static_configs:
      - targets: ['xxx.xxx.xxx.xxx:9300']
        labels:
          instance: prometheus

  - job_name: linux
    static_configs:
      - targets: ['xxx.xxx.xxx.xxx:9200']
        labels:
          instance: localhost
  - job_name: web
    metrics_path: '/actuator/prometheus'
    scrape_interval: 5s
    static_configs:
      - targets: ['xxx.xxx.xxx.xxx:19007']
        labels:
          instance: localweb
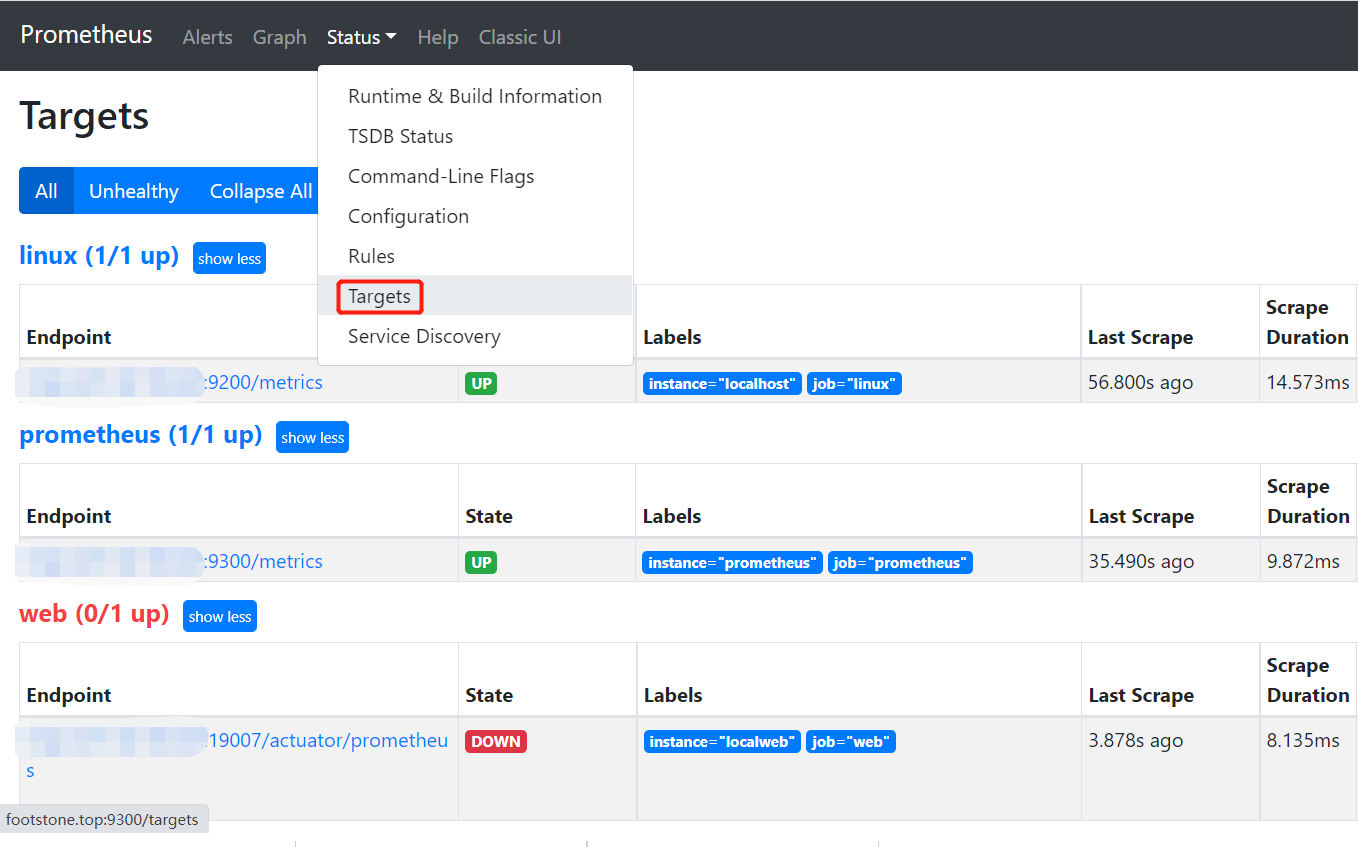
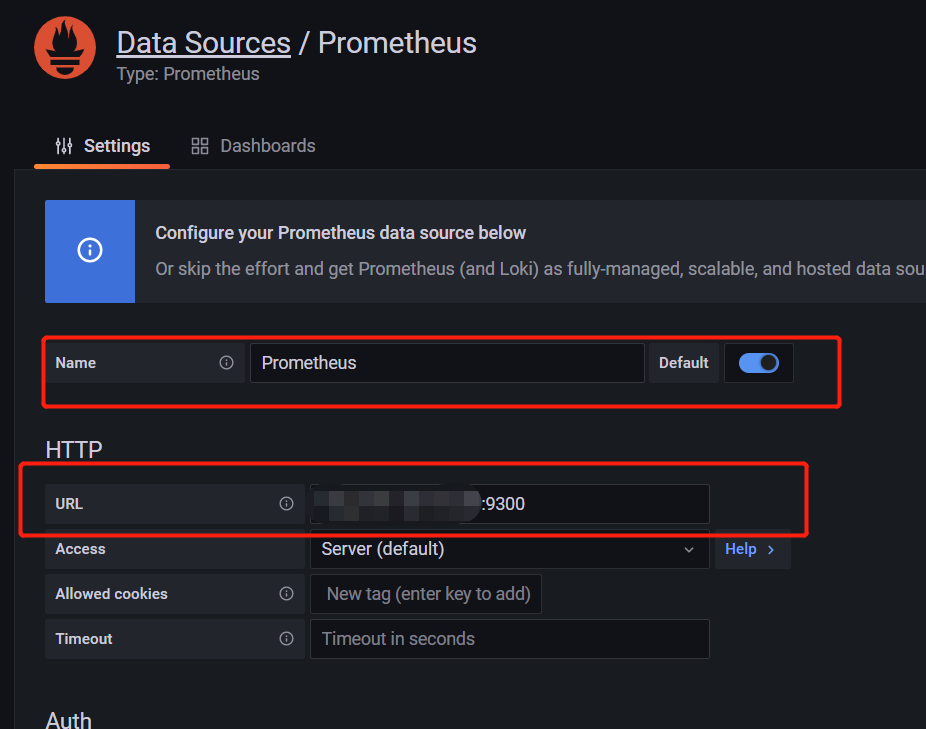
Of which 9300 are prometheus
9200 is the program of node exporter monitoring server
19007 is the test address, metrics_path is the address of the custom pull data
Preparation before starting grafana
mkdir /opt/grafana-storage

chmod 777 -R /opt/grafana-storage
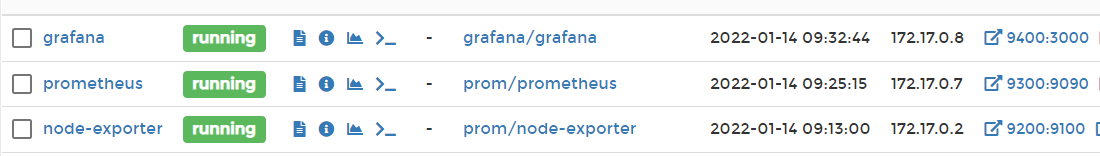
start-up
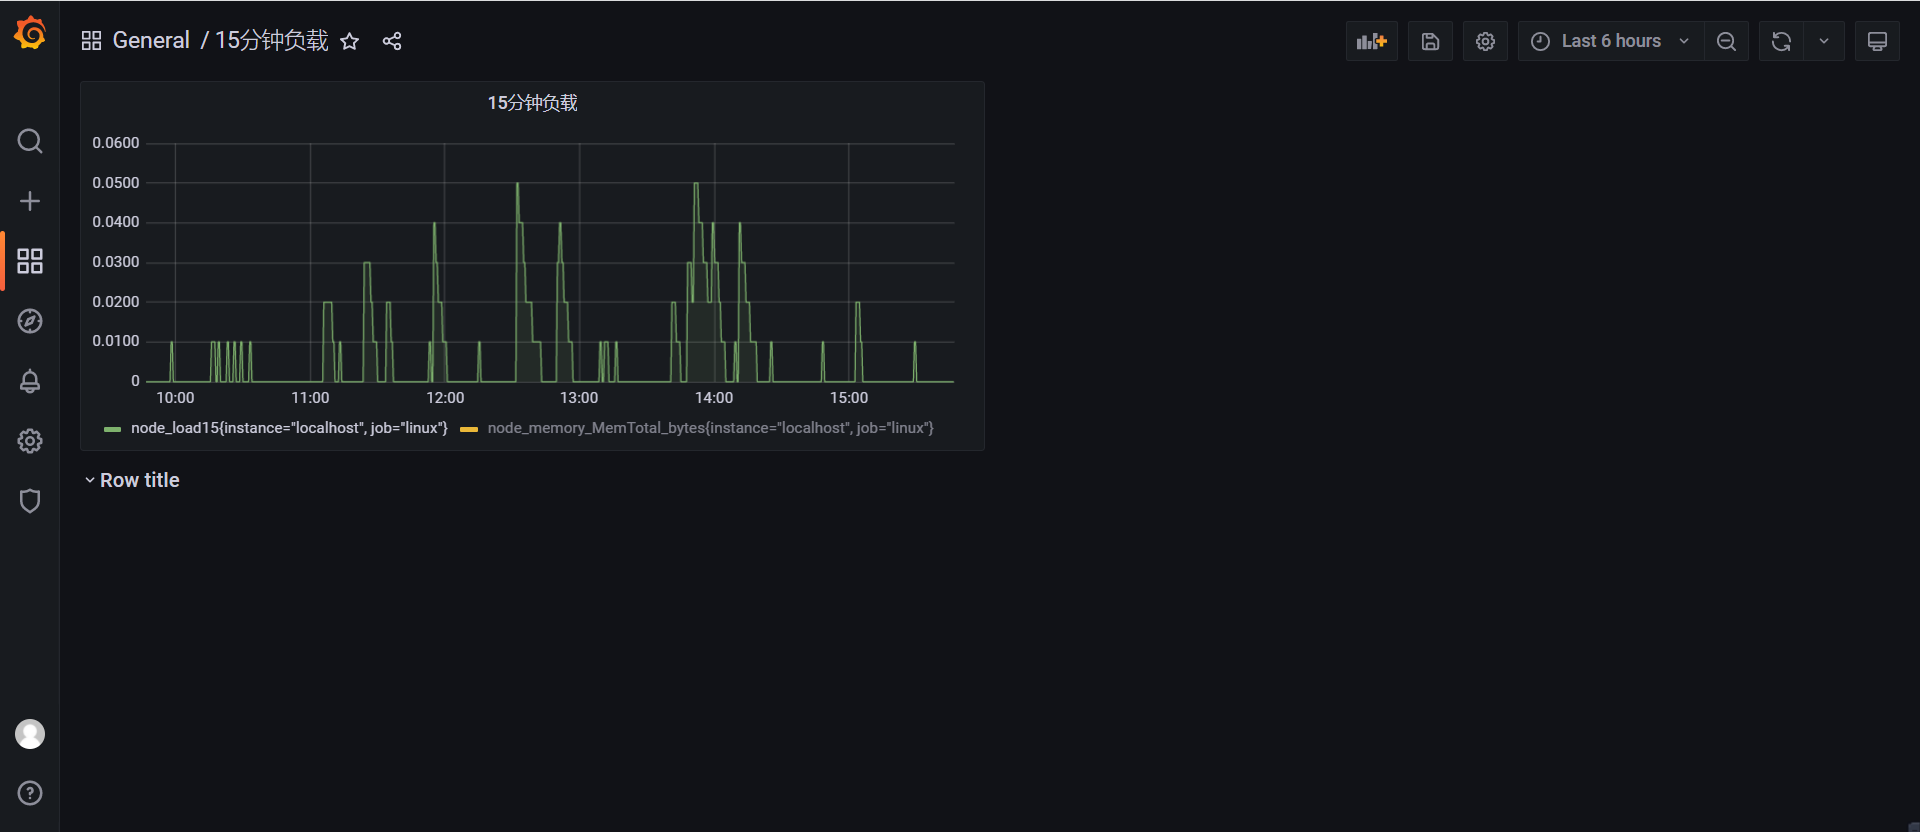
The visualization is as follows
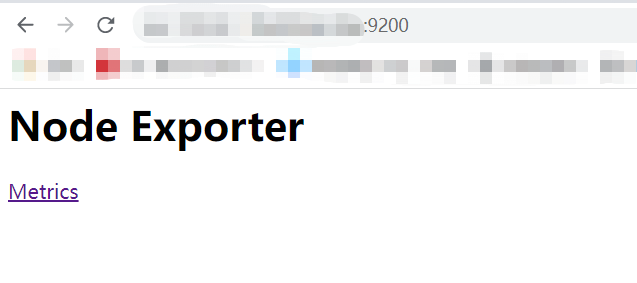
Node exporter startup
docker run -d -p 9200:9100 --name=node-exporter -v "/proc:/host/proc:ro" -v "/sys:/host/sys:ro" -v "/:/rootfs:ro" prom/node-exporter
Access port 9200
prometheus start
docker run -d --name=prometheus -p 9300:9090 -v /opt/prometheus/prometheus.yml:/etc/prometheus/prometheus.yml prom/prometheus
Access port 9300
grafana start
docker run -d -p 9400:3000 --name=grafana -v /opt/grafana-storage:/var/lib/grafana grafana/grafana
Access port 9400
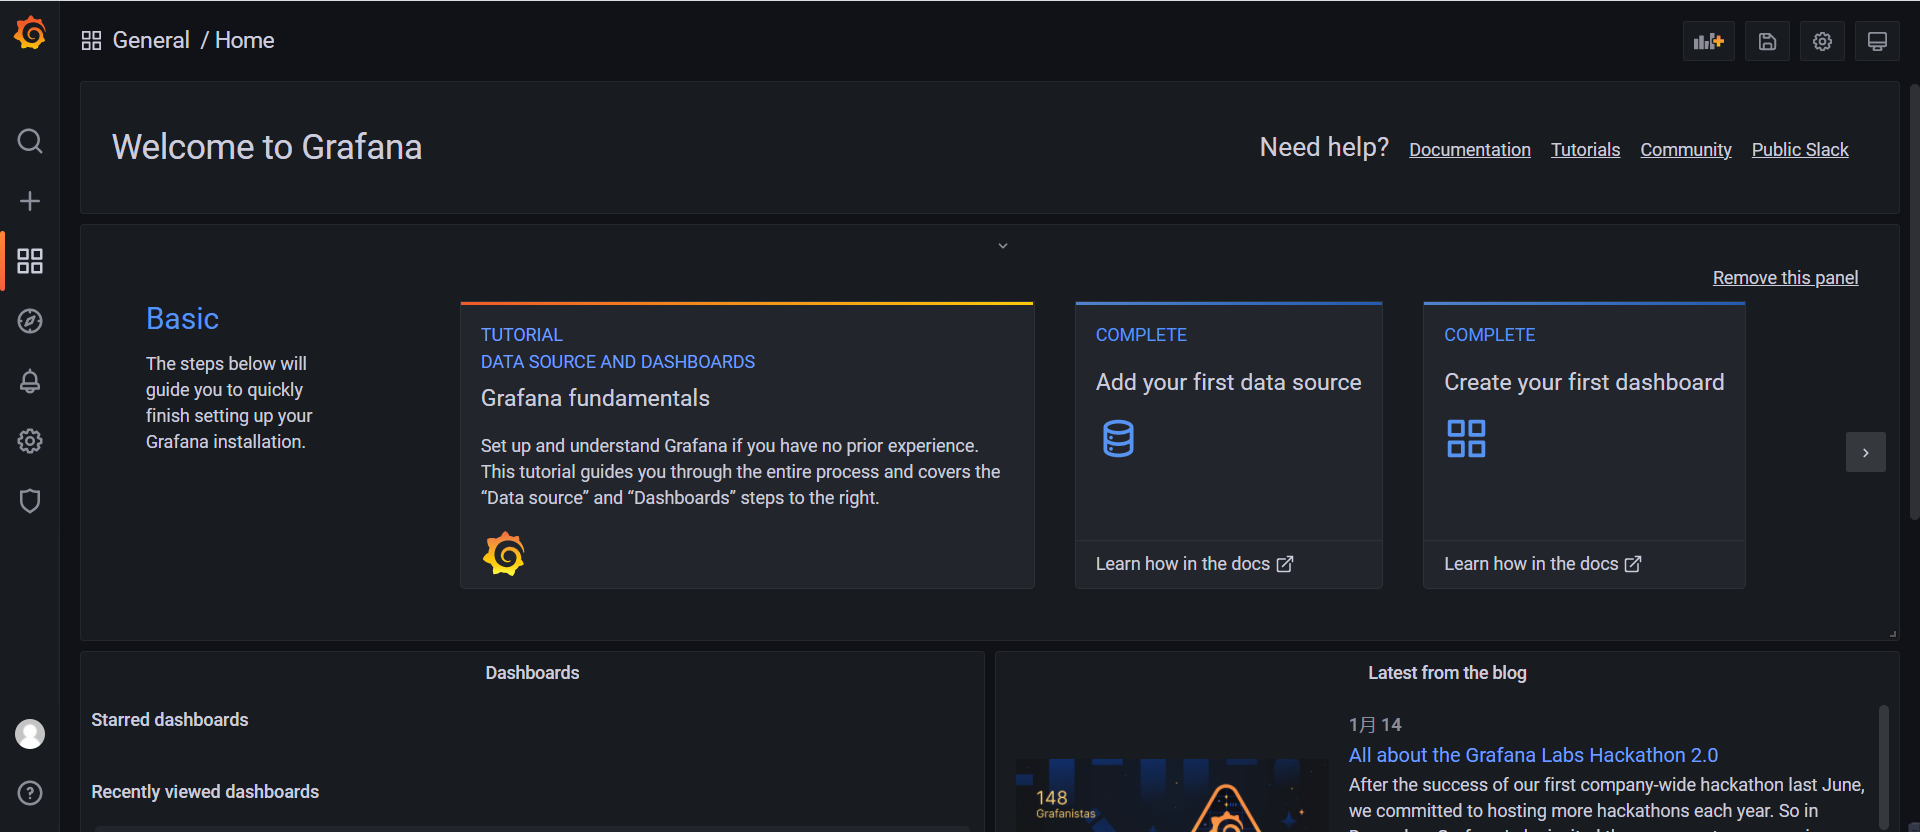
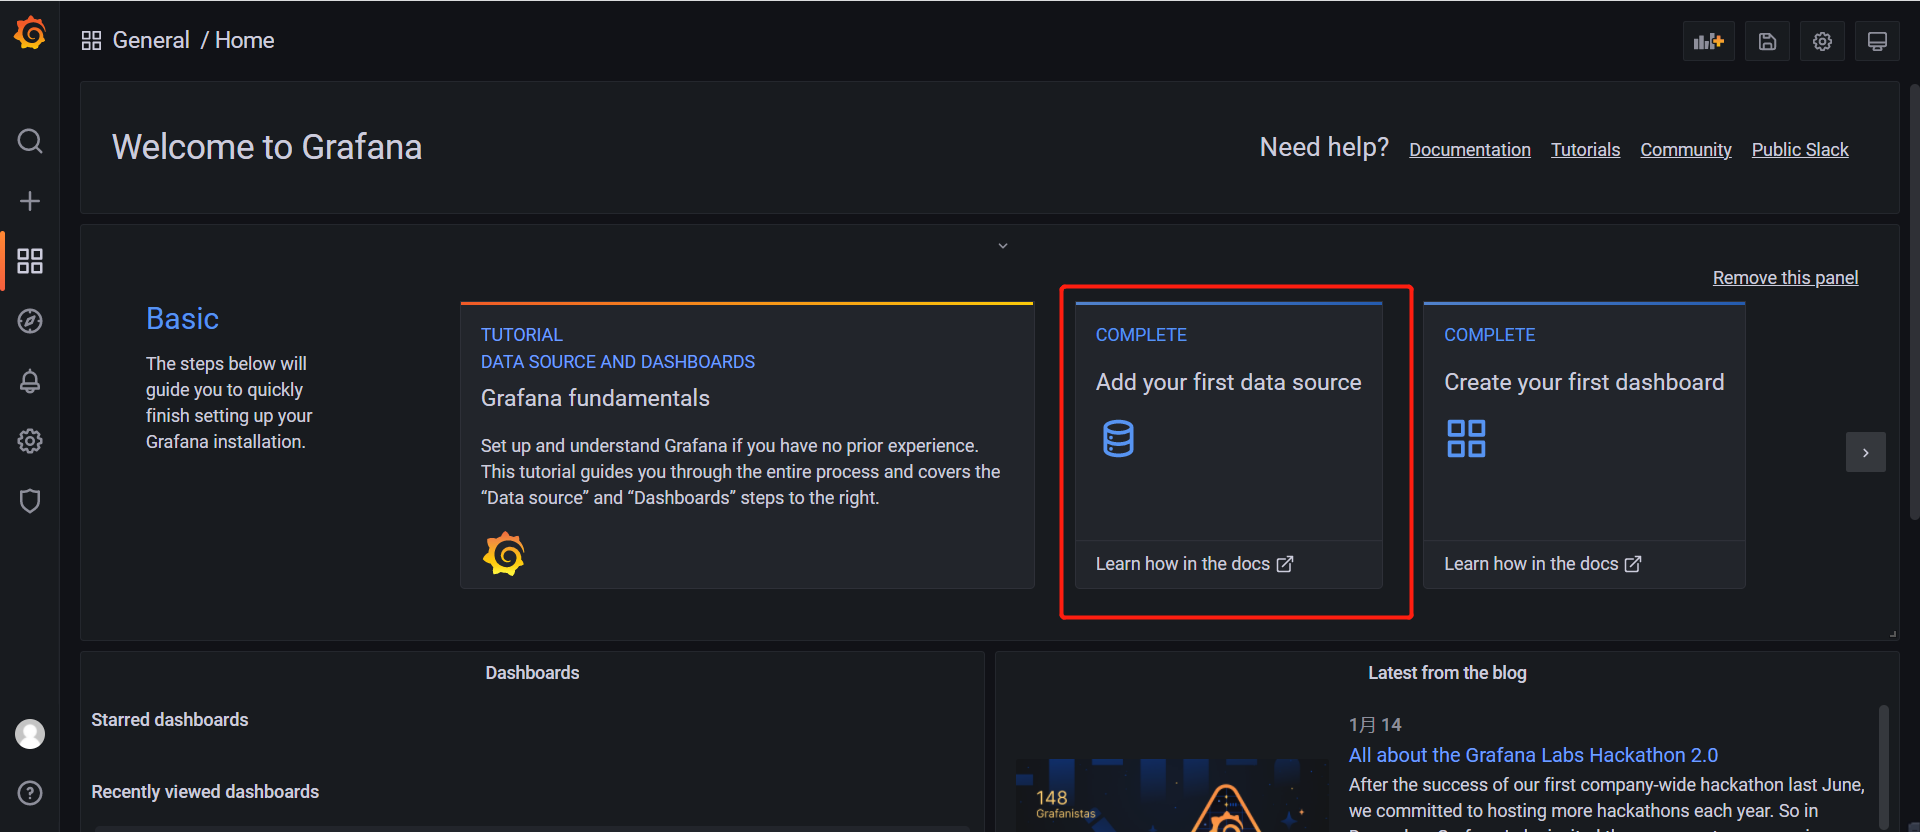
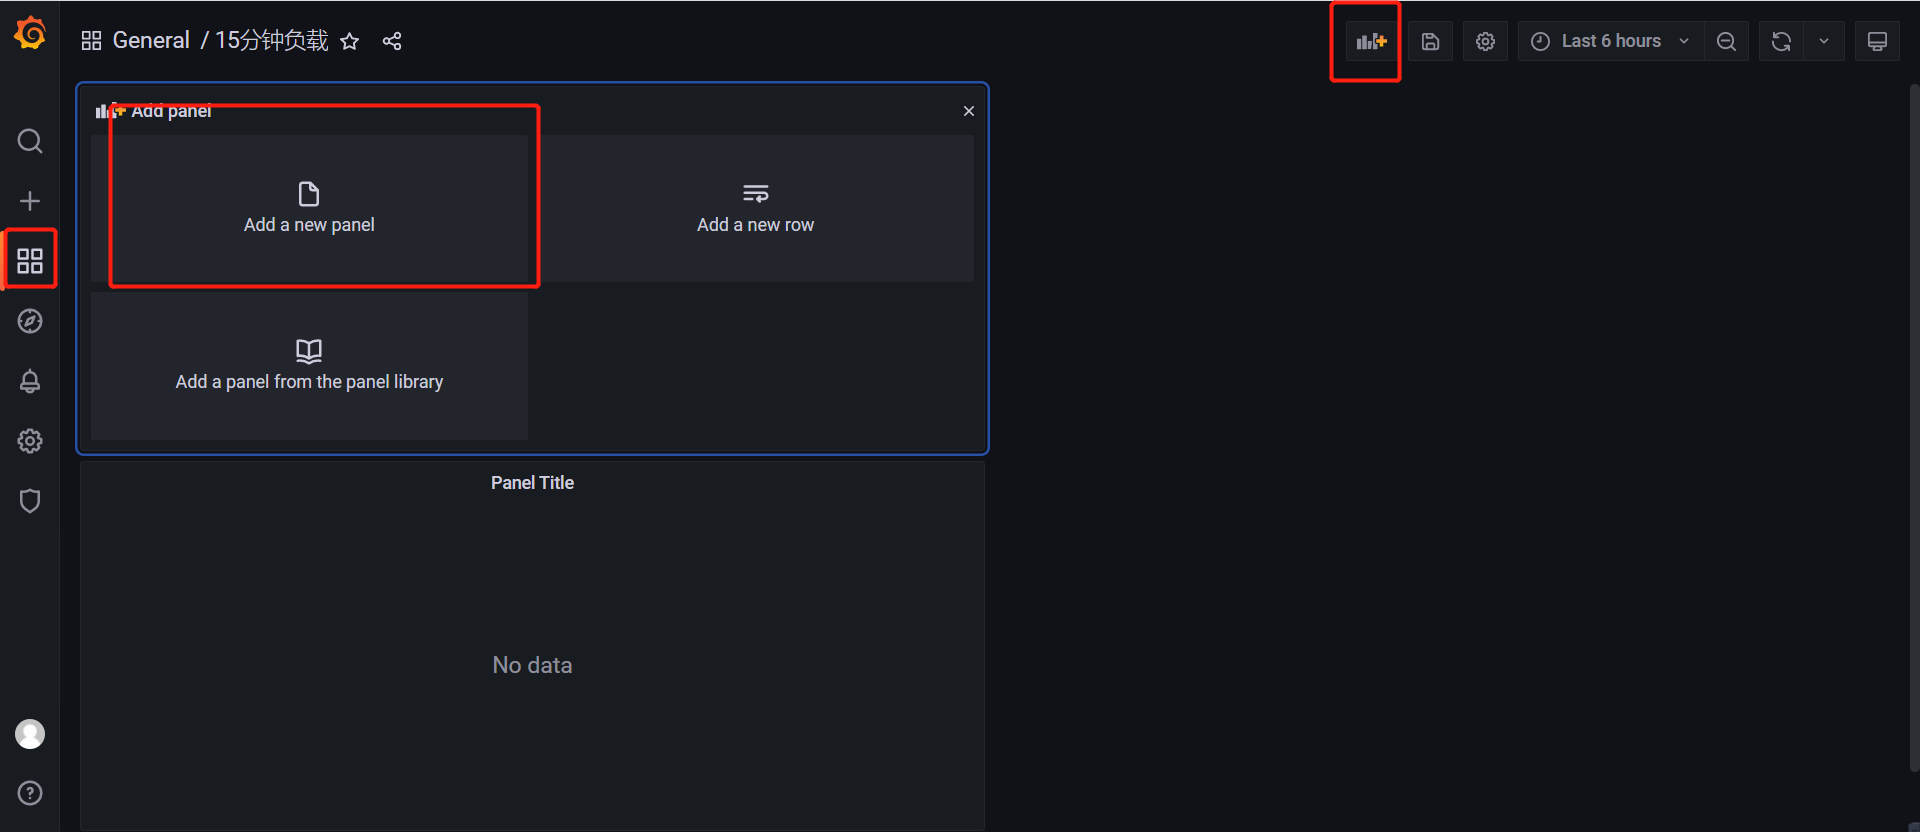
Using grafana
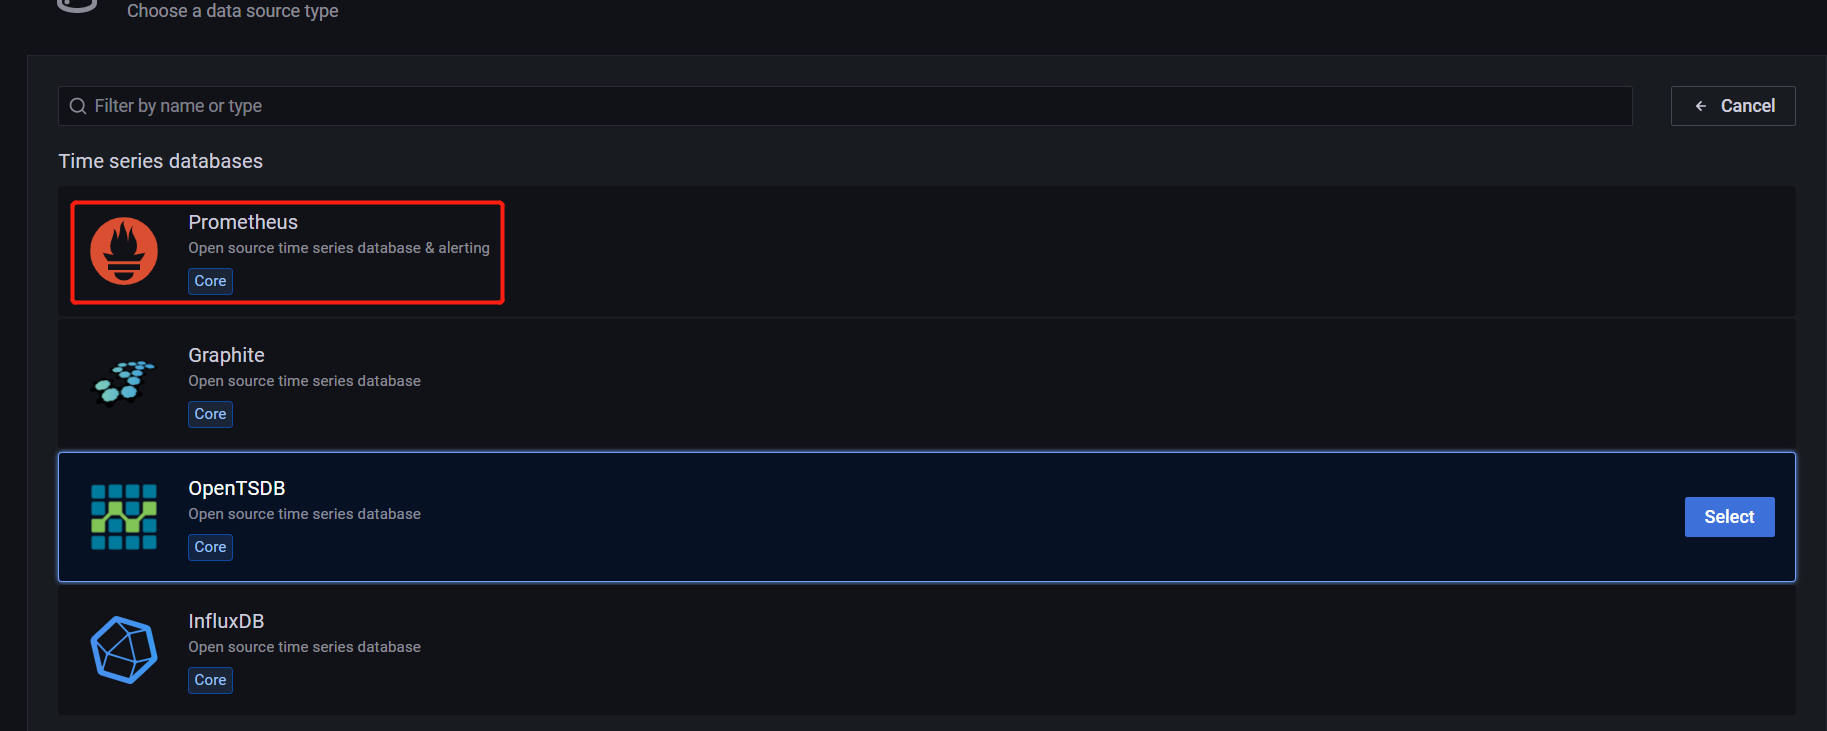
create data source
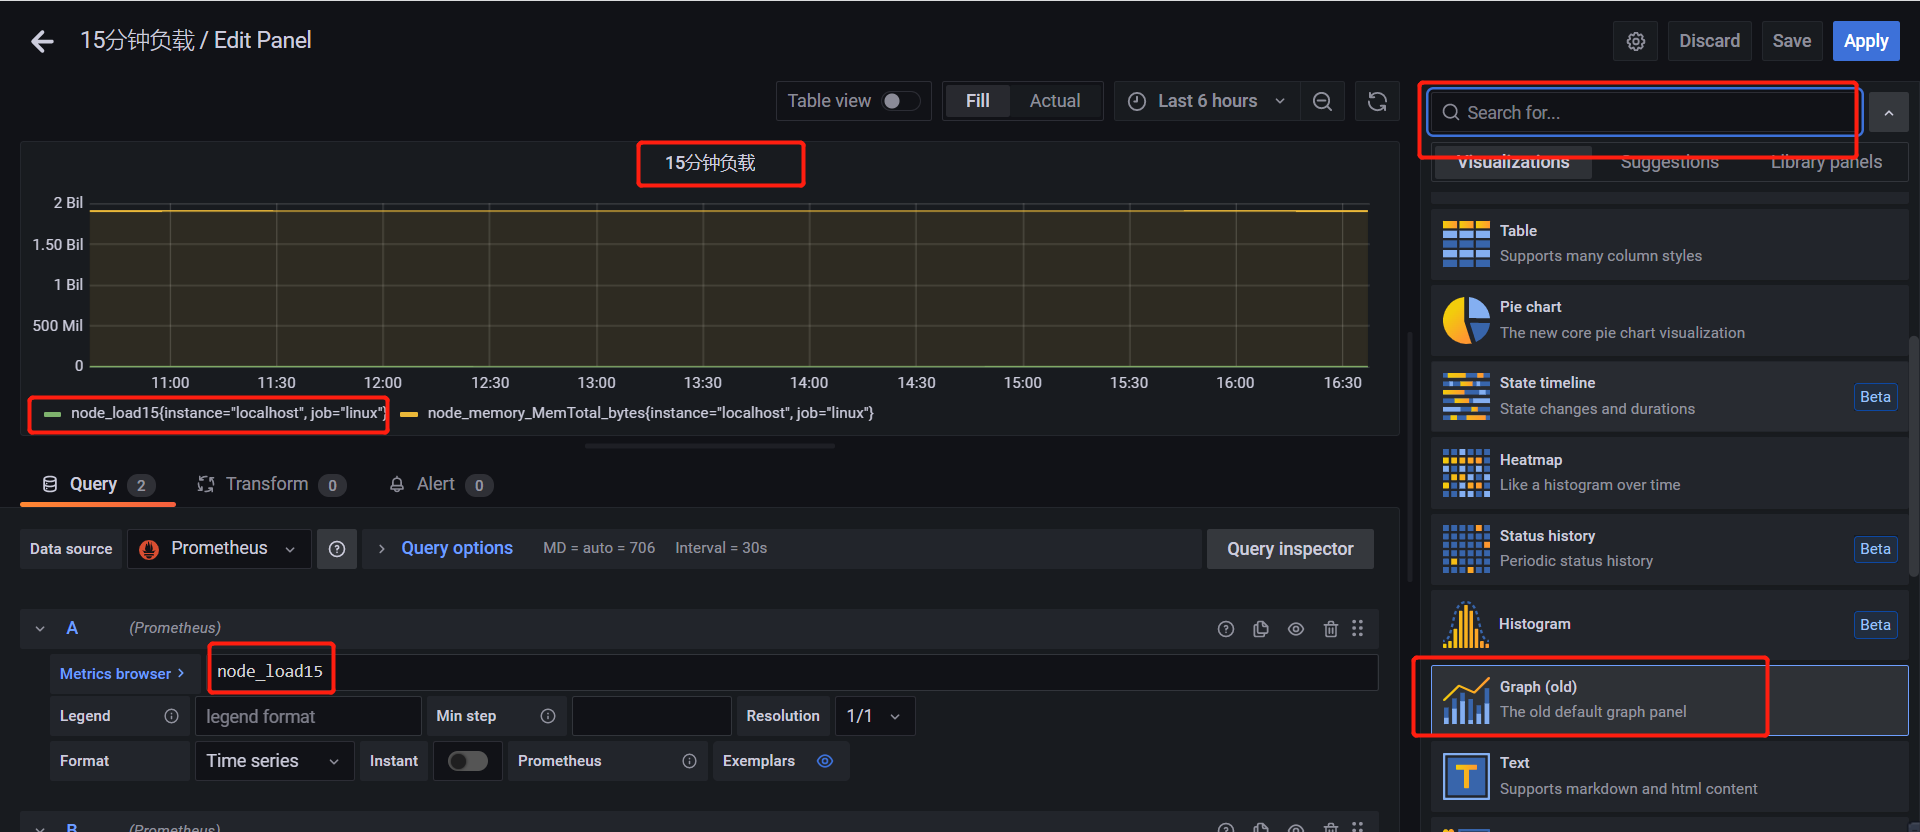
Configuration view
7, spring boot integration prometheus
Introduce dependency
		<dependency>
			<groupId>org.springframework.boot</groupId>
			<artifactId>spring-boot-starter-actuator</artifactId>
		</dependency>
		<!-- Micrometer Prometheus registry  -->
		<dependency>
		    <groupId>io.micrometer</groupId>
		    <artifactId>micrometer-registry-prometheus</artifactId>
		</dependency>
yml configuration
# Management -- > metrics configuration access path for stand-alone monitoring project address / prometheus
management:
  metrics:
    binders:
      jvm:
        enabled: false
      files:
        enabled: false
      integration:
        enabled: false
      logback:
        enabled: false
      processor:
        enabled: false
      uptime:
        enabled: false
  endpoints:
    web:
      exposure:
        include: ["prometheus"]
      base-path: "/"
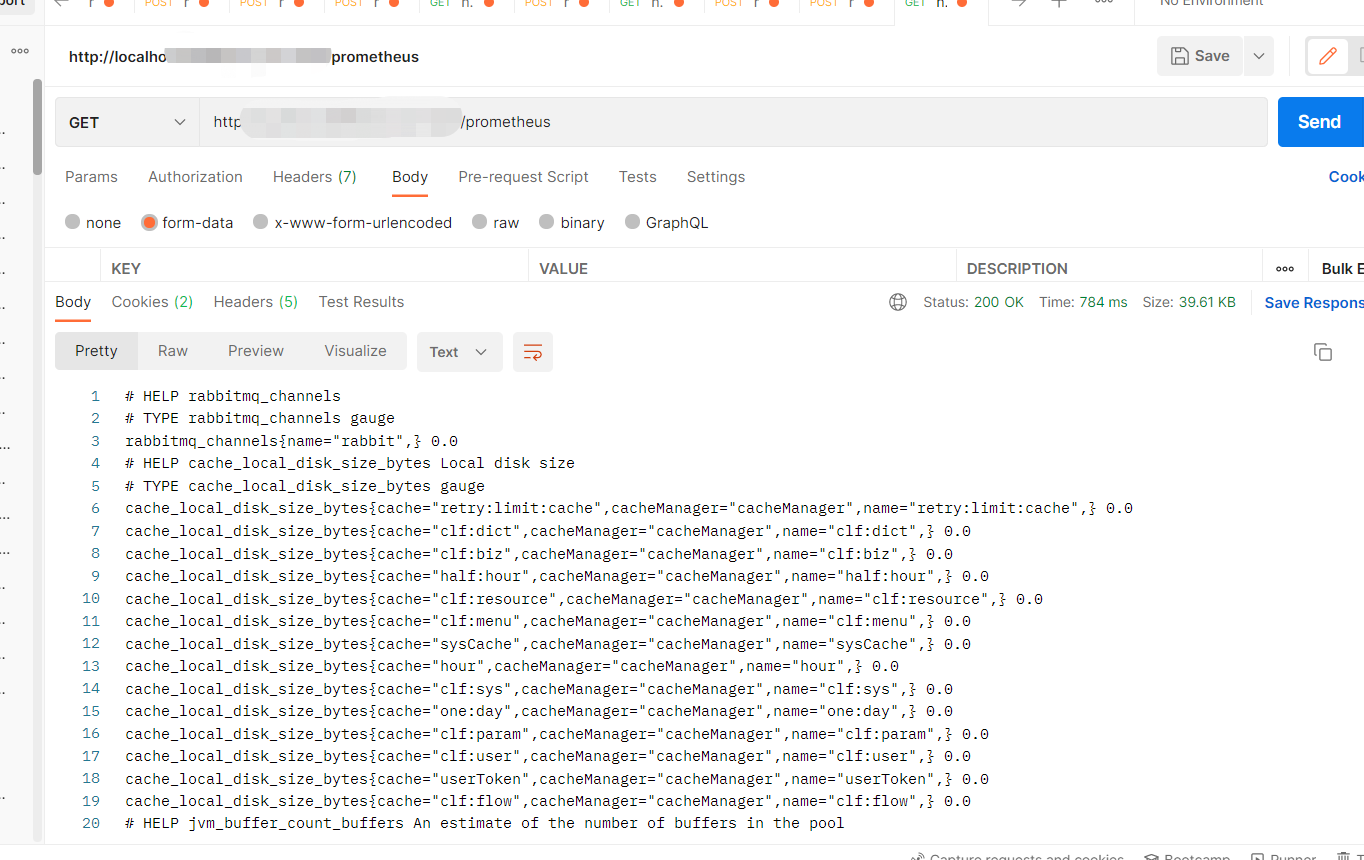
visit
The Prometheus above port 19007 is used for the test Access address in YML configuration
Below are the indicators obtained
grafana official JVM view template
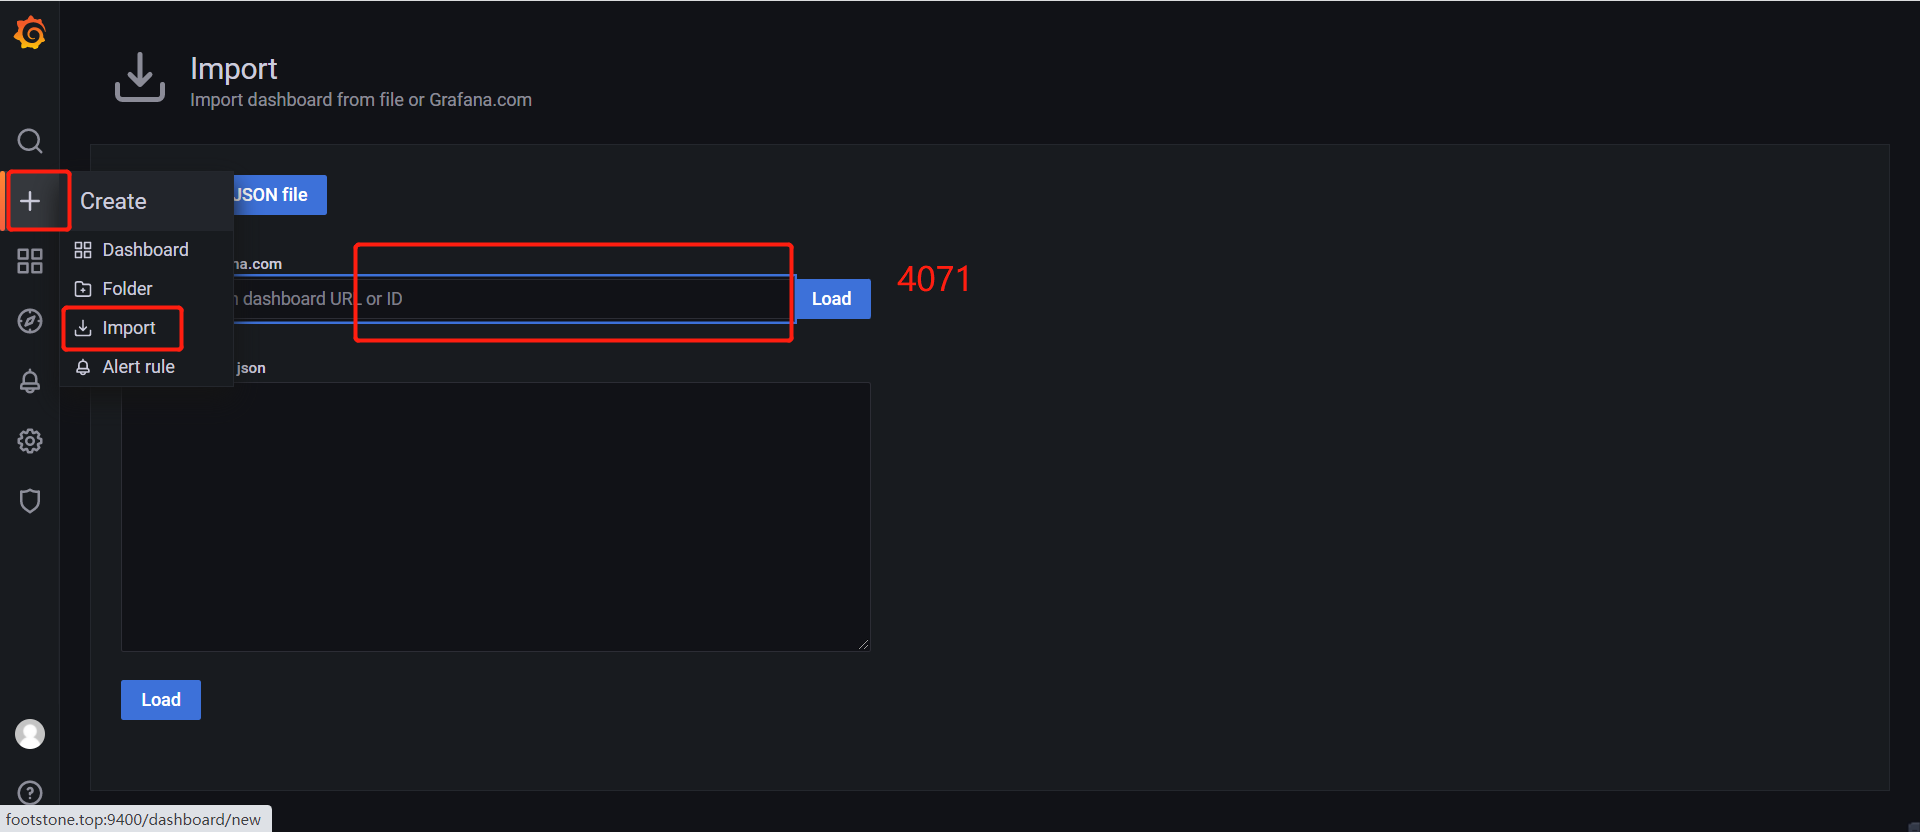
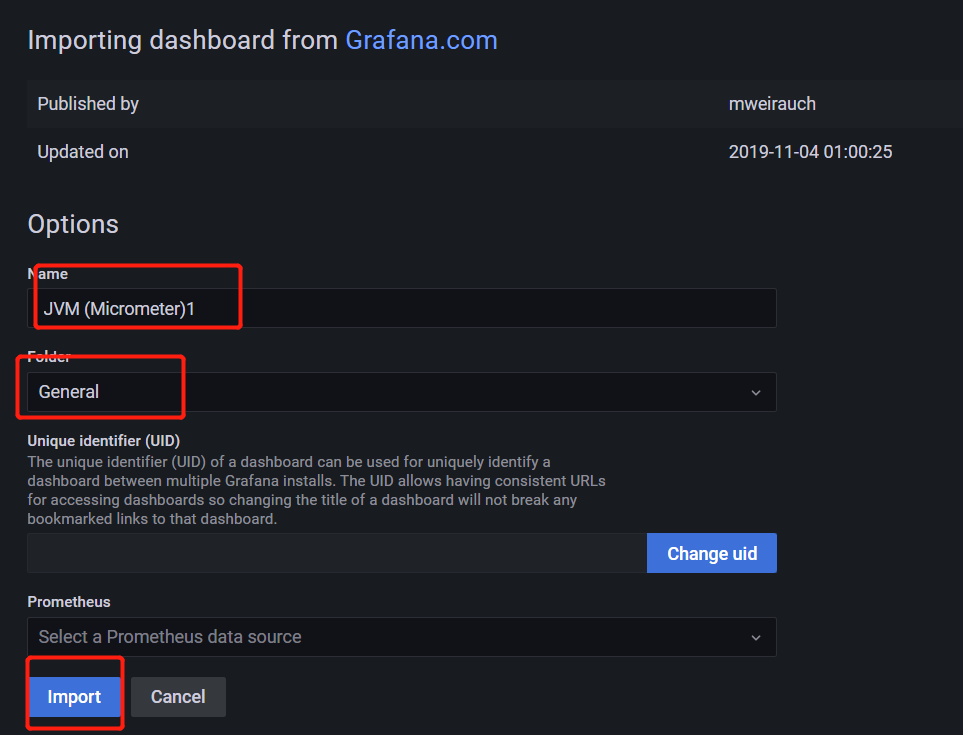
Now it's offline. After 19007 test address is online, Prometheus will appear on the top web test options for YML configuration
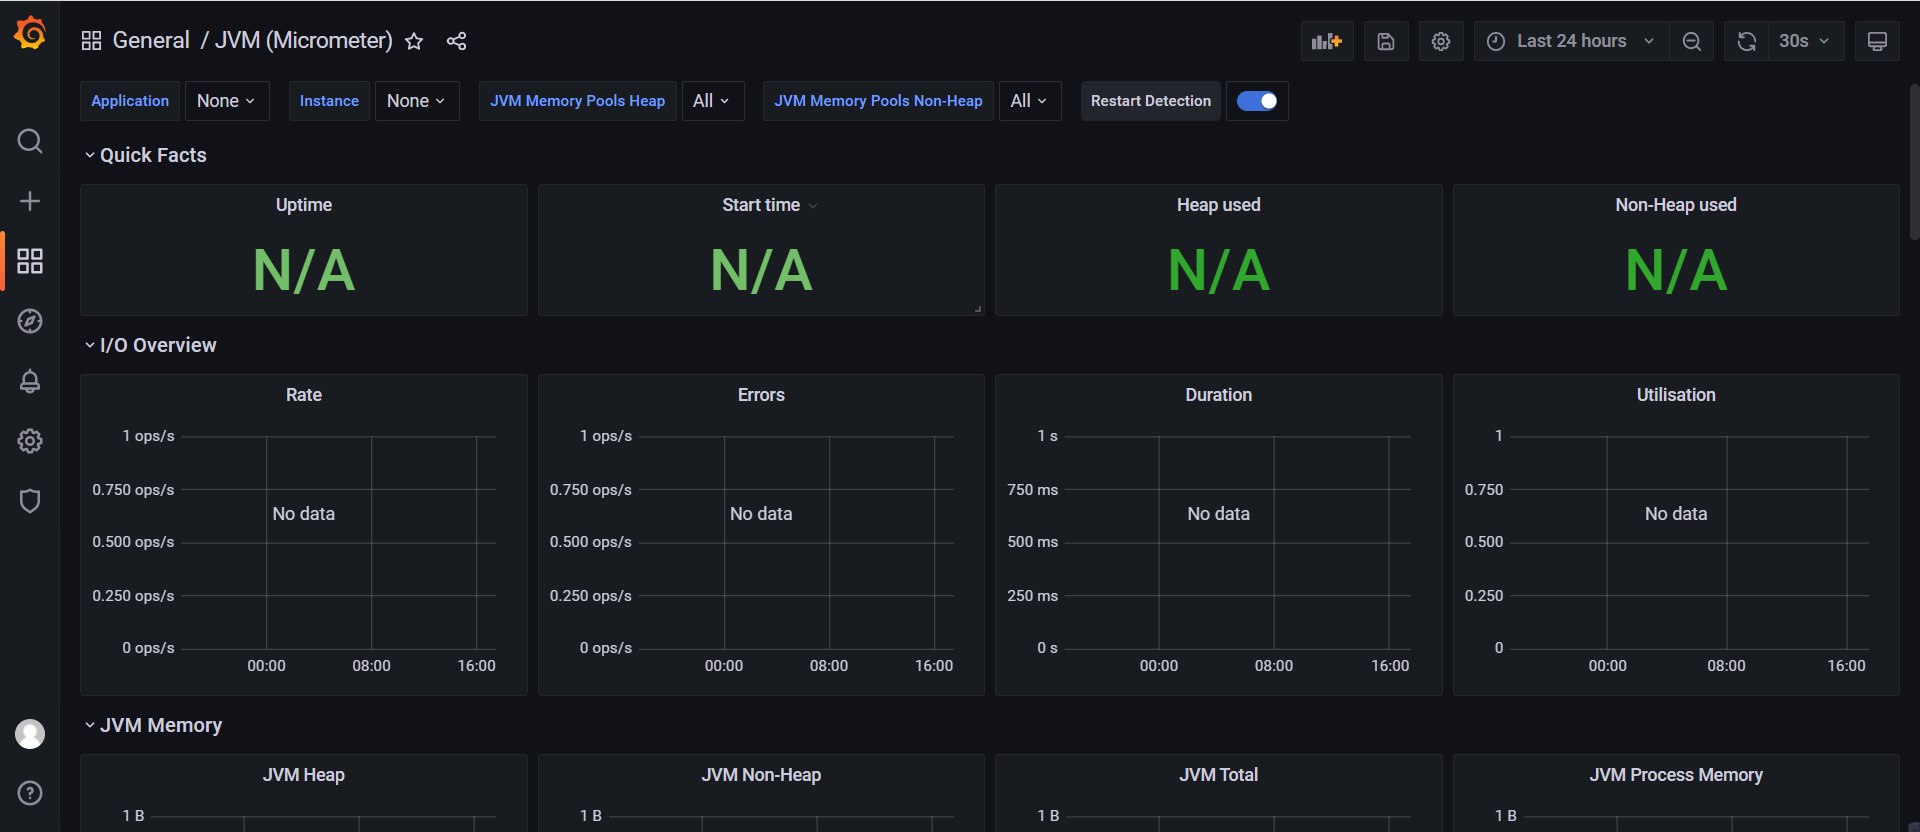
The data is displayed in this view