LEfSe analysis, or LDA Effect Size analysis, is an analysis tool for discovering and interpreting high-dimensional data biomarkers (genes, pathways, taxons, etc.), which can compare two or more groups. It emphasizes statistical significance and biological correlation, and can find biomarkers with statistical differences between groups.
The combinatorial statistics and visualization method specially developed for macrogenome was developed by the Huttenhover research group of Harvard University, published in Genome Biology and cited thousands of times.
LEFSe Fundamentals
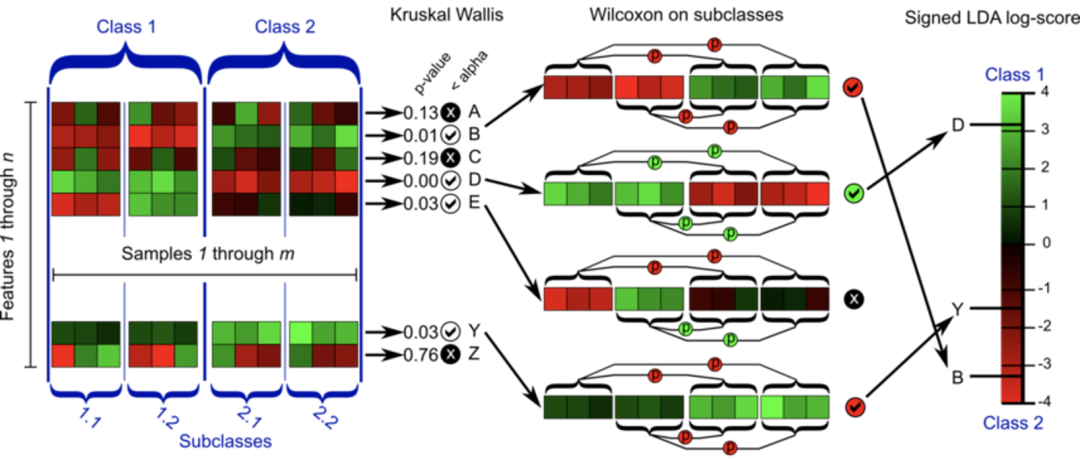
A. Firstly, the nonparametric factor Kruskal Wallis rank sum test was used to detect the species with significant abundance differences among different groups; B. Then, Wilcoxon rank sum test was used to check whether the significantly different species converge to the same classification among the grouping subgroups (if there are grouping subgroups); C. Finally, linear discriminant analysis (LDA) is used to reduce the dimension of the data and evaluate the influence of significantly different species (i.e. LDA score) (support vector machine analysis can also be used).
Rank sum test
Rank sum test is a nonparametric test, which uses sample rank instead of sample value. According to different sample groups, it can be divided into two sample Wilcoxon rank sum test and multi sample Kruskal Wallis test.
The basic idea is: if the test hypothesis is true, the rank sum of the two groups should not differ too much. The rank is used to replace the original data information.
The principle is that no matter how much data is in the sample, the two sample data are mixed and sorted from small to large, and then rank in order. The smallest is assigned as 1 and the largest is assigned as n1+n2. Calculate the average rank of the two samples respectively. If the average rank of the two samples is not different, it means that there is no significant difference between the two populations; On the contrary, if the difference is large, first calculate the rank sum of the two samples respectively, and then calculate the P value of the test statistics (the rank sum of the samples with small content) and Statistics (the expected rank sum can be seen from the T-value table) and make a decision.
Linear discriminant analysis LDA
Linear discriminant analysis LDA is a kind of supervised learning. Some materials are also called Fisher's linear discriminator. It was invented by Ronald Fisher in 1936. It is a classic and popular algorithm in the field of machine learning and data mining.
The idea of linear discriminant analysis (LDA) can be summarized in one sentence, that is, "the intra class variance is the smallest and the inter class variance is the largest after projection". In short, it is a projection, which is to project a high-dimensional point into a low-dimensional space. We hope that after mapping, the farther the distance between different categories, the better, and the closer the distance in the same category, the better.
LEFSe online analysis
LEfSe is a python package and now supports Python 3. It can be downloaded from https://github.com/SegataLab/lefse Download and install local analysis. When we recently upgraded the drawing platform BIC, we also modified and updated the LEfSe code according to the actual needs, and submitted it to the main warehouse.
In short, the advantages of using BIC for online analysis are as follows:
- It can be used without installation
- Support the export of text editable vector graphics (in the early stage, LEfSe can output svg, pdf, but the text cannot be modified and has been routed)
- Support to customize the color of each group
- The exported diagram examples will be automatically divided or recalculated to avoid legend overflow (this is also a problem always encountered before, which needs to be modified manually by Adobe Illustrator)
The middle two functions have not been merged into the main warehouse, and these updated functions are not available in the Galaxy version of LEfSe.
input data
- The first row is the header row, which contains the grouping information of the sample. The sample data is divided into three groups, Ko, OE and wt.
- The sample data does not include subject class and subject information.
- Starting from the second line is the abundance information of each annotation species, which is divided by | between different classification levels.
Class    KO    KO    KO    KO    KO    KO    OE    OE    OE    OE    OE    OE    WT    WT    WT    WT    WT    WT
Bacteria    63.4    62.6    68.2    68.6    72.6    65.9    54.3    58.6    63.7    62.8    62.3    55.0    66.8    70.7    60.6    64.1    70.3    63.8
Bacteria|Actinobacteria    16.4    27.6    18.9    20.9    12.1    15.4    17.0    21.4    22.9    18.3    20.2    16.6    25.0    22.6    21.4    24.1    25.0    21.0
Bacteria|Bacteroidetes    1.4    1.1    6.5    1.9    3.9    1.6    1.7    6.3    6.0    4.5    2.2    1.4    3.4    3.7    2.8    1.6    3.2    4.3
Bacteria|Chloroflexi    0.6    0.5    0.2    0.5    0.6    0.3    0.4    1.1    0.2    0.6    1.0    0.6    2.6    0.2    0.5    0.5    1.1    0.8
Bacteria|Firmicutes    0.5    0.4    0.1    0.2    0.1    0.3    2.0    0.7    1.0    1.1    0.5    2.2    0.2    0.1    0.3    0.2    0.1    0.2
Bacteria|Proteobacteria    44.4    33.0    42.5    45.0    55.9    48.3    33.2    28.9    33.6    38.2    38.4    34.2    35.7    44.1    35.7    37.9    40.9    37.5
Bacteria|Actinobacteria|Actinobacteria    16.4    27.6    18.9    20.9    12.1    15.4    17.0    21.4    22.9    18.3    20.2    16.6    25.0    22.6    21.4    24.1    25.0    21.0
This method of species annotation is also supported
Class    KO    KO    KO    KO    KO    KO    OE    OE    OE    OE    OE    OE    WT    WT    WT    WT    WT    WT
k__Bacteria    63.4    62.6    68.2    68.6    72.6    65.9    54.3    58.6    63.7    62.8    62.3    55.0    66.8    70.7    60.6    64.1    70.3    63.8
k__Bacteria|p__Actinobacteria    16.4    27.6    18.9    20.9    12.1    15.4    17.0    21.4    22.9    18.3    20.2    16.6    25.0    22.6    21.4    24.1    25.0    21.0
k__Bacteria|p__Bacteroidetes    1.4    1.1    6.5    1.9    3.9    1.6    1.7    6.3    6.0    4.5    2.2    1.4    3.4    3.7    2.8    1.6    3.2    4.3
k__Bacteria|p__Chloroflexi    0.6    0.5    0.2    0.5    0.6    0.3    0.4    1.1    0.2    0.6    1.0    0.6    2.6    0.2    0.5    0.5    1.1    0.8
k__Bacteria|p__Firmicutes    0.5    0.4    0.1    0.2    0.1    0.3    2.0    0.7    1.0    1.1    0.5    2.2    0.2    0.1    0.3    0.2    0.1    0.2
k__Bacteria|p__Proteobacteria    44.4    33.0    42.5    45.0    55.9    48.3    33.2    28.9    33.6    38.2    38.4    34.2    35.7    44.1    35.7    37.9    40.9    37.5
This format can be generated by ourselves or in one step based on the process code of our training course.
Online operation
Paste the data into the text field or upload it to the BIC platform http://www.ehbio.com/Cloud_Platform/front/#/analysis?page=b%27MzY%3D%27 (or click to read the original text) and submit the results directly.
Of course, we also provide many adjustable parameters:
- Group feature row: Specifies the row where the grouping information is located; Sub group feature row and Subject feature row specify subgroup and individual information.
- Per sample normalization tolerance: specifies how data is preprocessed.
- Biomarker identification parameters: It is used to set the threshold and statistical calculation method for screening biomarker species.
- Visualization related parameters: Adjust the properties of the result graph.
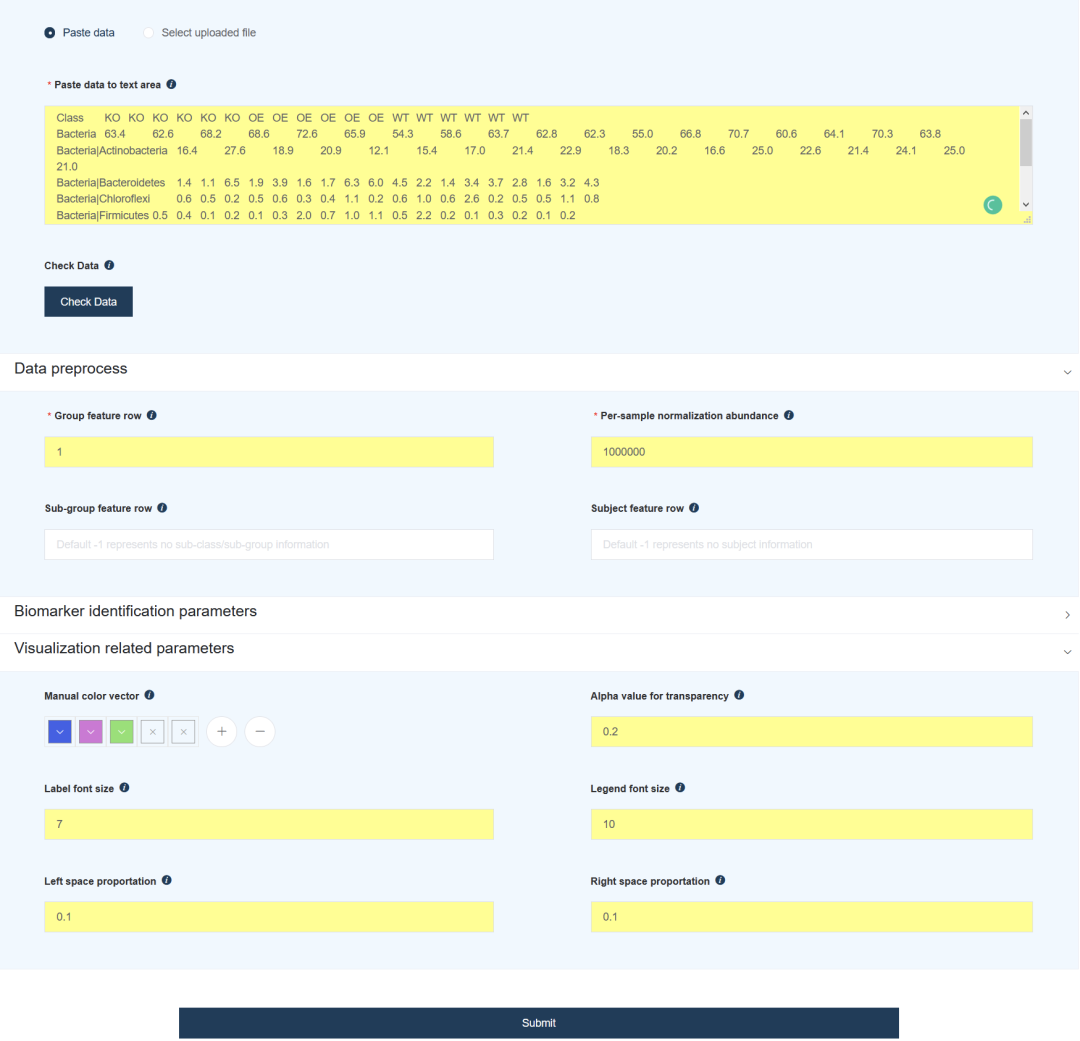
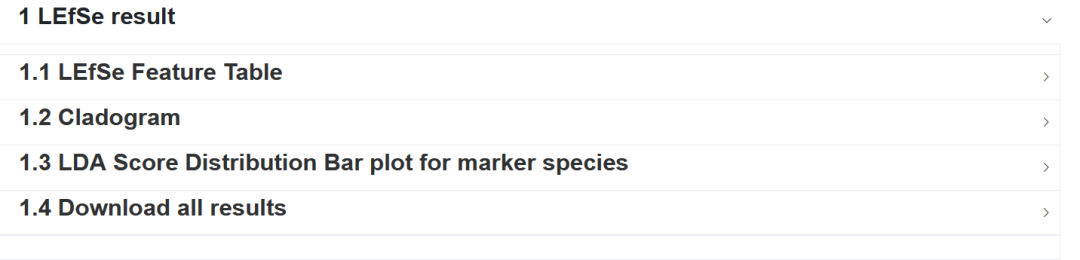
Click Submit and wait a moment to get the result report.
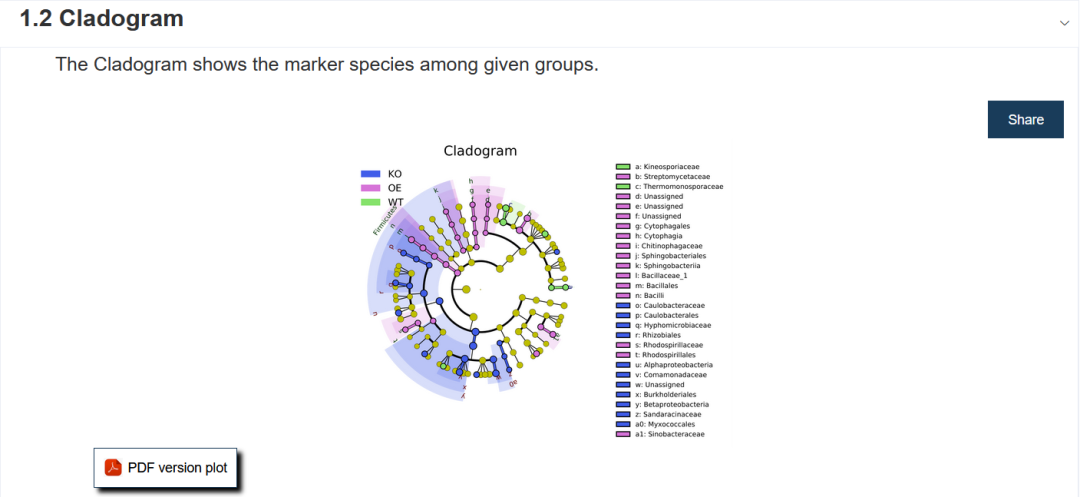
- Small circle: the circle radiating from inside to outside in the figure represents the taxonomic level from phylum to genus (the innermost yellow circle is the boundary).
- Each small circle at different classification levels represents a classification at that level, and the diameter of the small circle represents the size of relative abundance.
- Color: the species with no significant difference are uniformly colored as yellow, and the species with significant difference are colored with the group. The red node indicates the microbial groups that play an important role in the red group, and the blue node indicates the microbial groups that play an important role in the blue group.
- The species names corresponding to Biomarker that cannot be displayed in the figure will be displayed on the right, and the letter numbers correspond to those in the figure (for beauty, only the different species from door to family are displayed on the right by default). (if required, this parameter can also be configured later.)
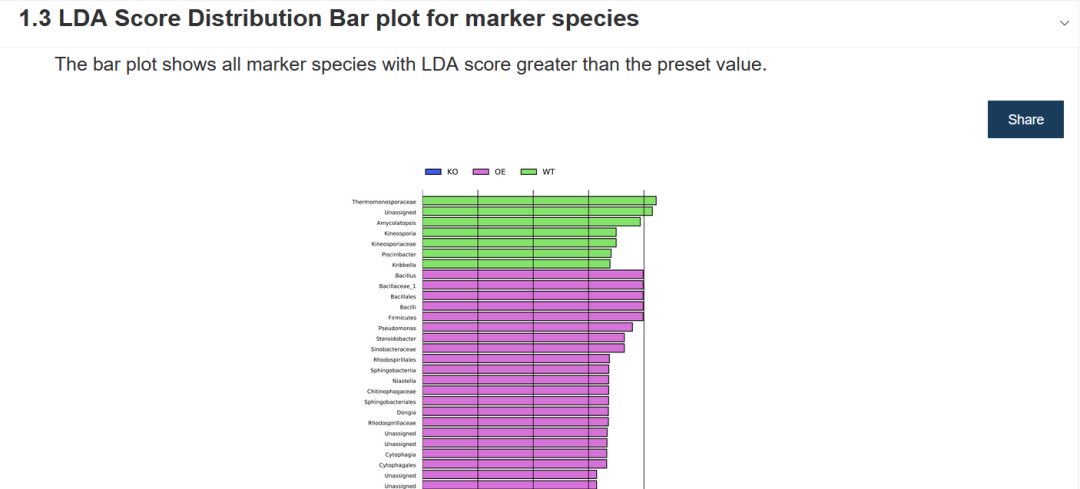
The bar chart shows the significantly different species with LDA score greater than the preset value, that is, Biomaker with statistical difference. The default preset value is 2.0 (look at the abscissa, only the absolute value of LDA value greater than 2 will be displayed in the chart); The color of the histogram represents their respective groups, and the length represents LDA score, that is, the influence degree of significantly different species among different groups.
- First column: Biomarker name;
- Second column: log10 of the maximum of the average abundance of each component. If the average abundance is less than 10, it shall be calculated as 10;
- Column 3: Group name of differential gene or species enrichment;
- Column 4: LDA value;
- Column 5: The p value of Kruskal Wallis rank sum test is expressed with "-" if it is not Biomarker.
Biomarkernames  Log10AverageAbundance   EnrichedGroups  LDA     KW_Pvalue
Bacteria        5.999999999999999                       -
Bacteria.Actinobacteria 5.545677071926983                       -
Bacteria.Bacteroidetes  4.784654378236204                       -
Bacteria.Chloroflexi    4.156289416781956                       -
Bacteria.Firmicutes     4.335852223799717       OE      3.984113612146213       0.0032249362213254236
Bacteria.Proteobacteria 5.824940805591662                       -
Bacteria.Actinobacteria.Actinobacteria  5.545677071926983                       -
Bacteria.Bacteroidetes.Cytophagia       3.561510337945784       OE      3.3268754254757593      0.004223833758324139
Bacteria.Bacteroidetes.Flavobacteriia   4.7270068698599115                      -
Bacteria.Bacteroidetes.Sphingobacteriia 3.5208071522996613      OE      3.3648561167542708      0.0038519140162918985
Test data can be accessed using the tool's Demo data, or https://gitee.com/ct5869/bic obtain.