Content introduction
Abnormal data are often encountered in daily data analysis, that is, data beyond a specific area or range is usually defined as abnormal or "noise", also known as outliers.
This paper introduces the visualization and processing routine of data outliers in daily work.
Distinguish true and false exceptions
Judging outliers based on business experience
- Pseudo exceptions: these exceptions are caused by specific business operations. They actually reflect the business state normally, rather than the abnormal law of the data itself.
- True exceptions: these exceptions are not caused by specific business operations, but objectively reflect the abnormal distribution of the data itself.
Outlier screening method and visualization
one point three σ criterion
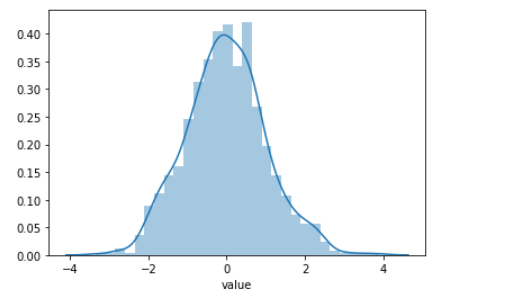
If the sample is normally distributed or approximately normally distributed, consider using 3 σ Methods it is considered that more than 99% of the data are concentrated in the range of three standard deviations above and below the mean. Specifically, the values are distributed in( μ- three σ,μ+ three σ) The probability of exceeding the maximum or minimum of this range is 99.73%, which is the outlier.
import pandas as pd
import random
import seaborn as sns
import numpy as np

# Generate a normal distribution with a mean of 0 and a standard deviation of 11000 points
data = np.random.normal(0, 1, size=1000)
df = pd.DataFrame(data,columns=["value"])
sns.distplot(df['value'])

# Calculated mean
mean = df['value'].mean()
mean
>>> -0.015112376391741298

# Calculate standard deviation
sigma = df['value'].std()
sigma
>>> 1.022523743271161


# Range of outliers (mean - 3 * standard deviation, mean + 3 * standard deviation)
[mean-3*sigma,mean+3*sigma]
>>> [-3.082683606205224, 3.052458853421742]

# Filter outliers
[ i for i in data if not mean-3*sigma<i<mean+3*sigma]
>>> [-3.3411613233772415,
	  3.1618429735810696,
	  3.8839317879436583,
	  3.5785429625413543,
	  3.0799355798019774]
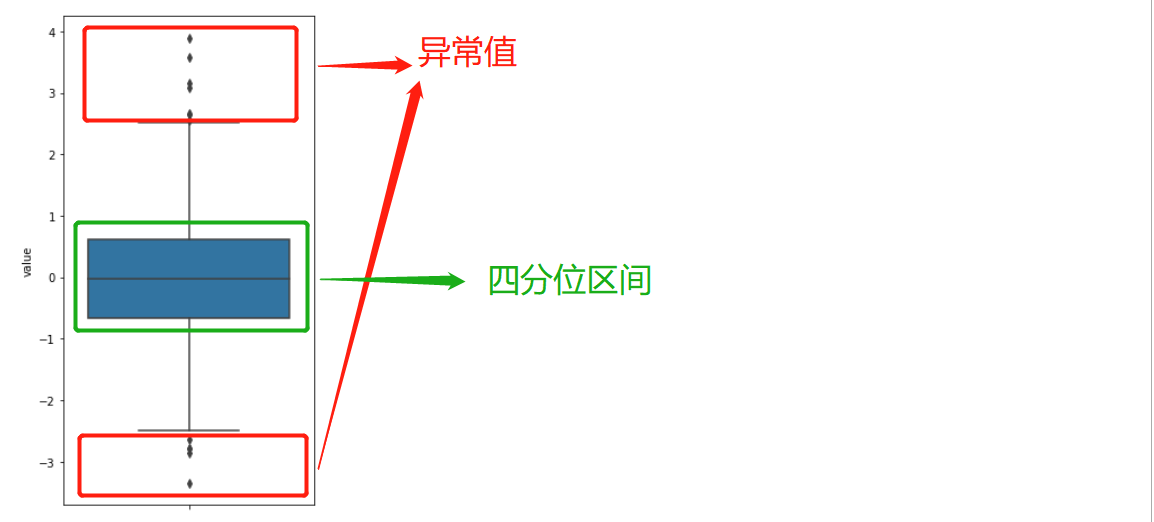
2. Use box diagram
Baidu Encyclopedia: box plot, also known as box whisker chart, box chart or box line chart, is a statistical chart used to display a group of data dispersion. It is named for its shape like a box.
import matplotlib.pyplot as plt

plt.figure(figsize = (2,4))
sns.boxplot(y = df['value'])
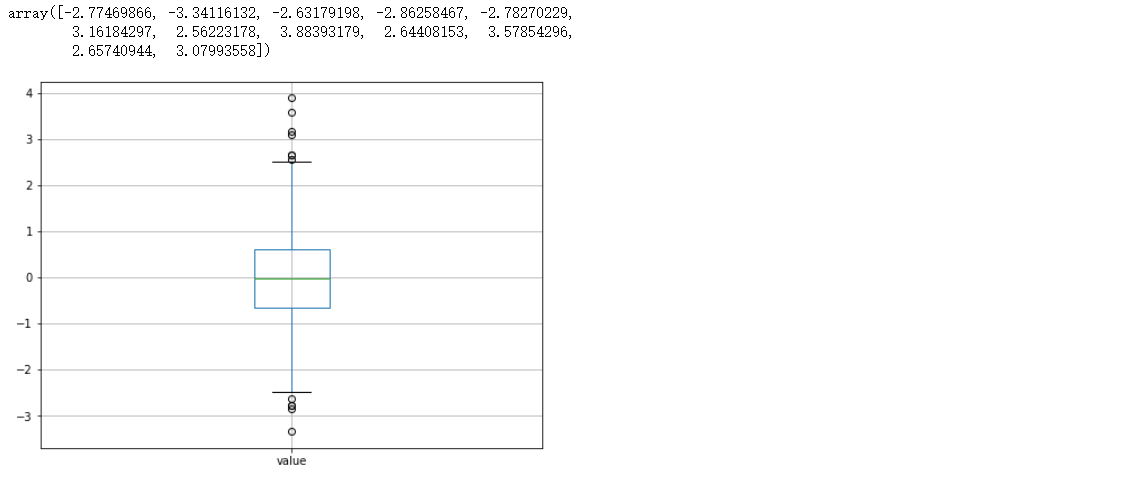
3. Use DataFrame
plt.figure(figsize = (8,6))
outlier = df.boxplot(return_type = 'dict')
y = outlier['fliers'][0].get_ydata() # Outliers

>>> array([-2.77469866, -3.34116132, -2.63179198, -2.86258467, -2.78270229,
        3.16184297,  2.56223178,  3.88393179,  2.64408153,  3.57854296,
        2.65740944,  3.07993558])
Processing method of outliers
In general, the data application is around outliers, so outliers cannot be discarded. Anomaly detection model is usually used for customer anomaly identification, such as credit card fraud, loan approval identification, drug mutation identification, bad weather prediction, network intrusion detection, traffic fraud detection, etc. In this case, the exception data itself is the target data.
-
Completely delete: if you want to find out the general rule and there are not too many outliers, you can consider deleting. Because outliers may affect the conclusion. For example, in the diving competition, the highest score and the lowest score will be removed when calculating the final score of the player.
-
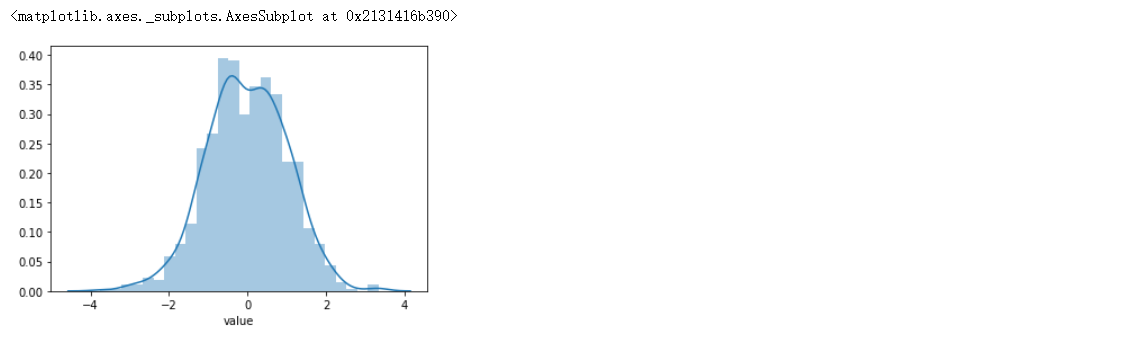
Logarithmic conversion: logarithmic conversion of data can make the distribution of data more centralized, and will not change the relative relationship and distribution state of the original data. In this way, the influence on the data set with outliers does not change greatly.
df["value"] = np.log(df["value"])
sns.distplot(df['value'])
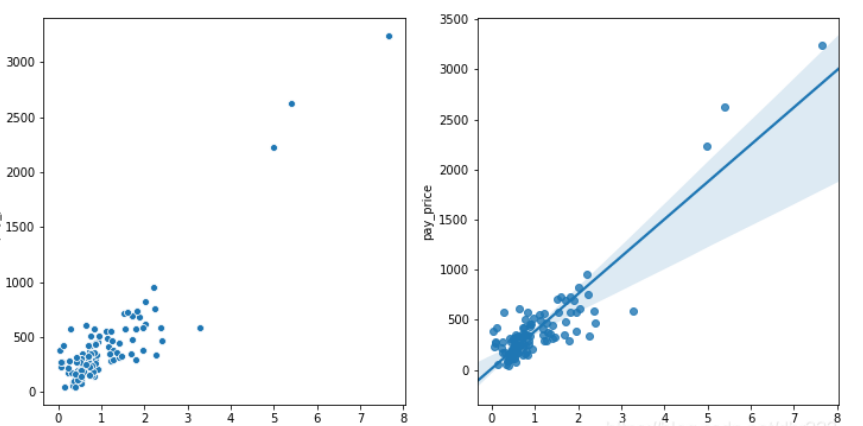
- Keep exceptions: because outliers represent real events, and specific behaviors are behind them. Even if some values are abnormal, they will not affect the model. However, the fitting did not cause too much deviation to the model. So this outlier is very reasonable for our model.
plt.figure(figsize = (12,6))
plt.subplot(1,2,1)
sns.scatterplot(x='value_type', y='value',data = df)
plt.subplot(1,2,2)
sns.regplot(x='value_type', y='value',data = df)
-
Filling in as missing values: deleting data directly may lose information, leaving it alone may affect the model, so you can consider filling in with mean and adjacent values. A method of giving a relatively reasonable new value to outliers by using the original data information. The method of data assignment can also use random assignment, nearest point assignment, mean assignment, regression assignment, etc. Interpolation is a method of data assignment, which generally refers to linear interpolation.
-
Truncation: only 2.5% - 97.5% of the data in the data set are taken.
def cut_data(data,cut1,cut2):
    len_data = len(data)
    p1 = int(len_data * cut1)
    p2 = int(len_data * cut2)
    return data[p1:p2]

cut_data(data,0.25,0.975)